. 2015 Jun 2:6:7153.
doi: 10.1038/ncomms8153.

Optogenetic control of contractile function in skeletal muscle

Affiliations

Optogenetic control of contractile function in skeletal muscle

Tobias Bruegmann et al. Nat Commun. .

Abstract

Optogenetic stimulation allows activation of cells with high spatial and temporal precision. Here we show direct optogenetic stimulation of skeletal muscle from transgenic mice expressing the light-sensitive channel Channelrhodopsin-2 (ChR2). Largest tetanic contractions are observed with 5-ms light pulses at 30 Hz, resulting in 84% of the maximal force induced by electrical stimulation. We demonstrate the utility of this approach by selectively stimulating with a light guide individual intralaryngeal muscles in explanted larynges from ChR2-transgenic mice, which enables selective opening and closing of the vocal cords. Furthermore, systemic injection of adeno-associated virus into wild-type mice provides sufficient ChR2 expression for optogenetic opening of the vocal cords. Thus, direct optogenetic stimulation of skeletal muscle generates large force and provides the distinct advantage of localized and cell-type-specific activation. This technology could be useful for therapeutic purposes, such as restoring the mobility of the vocal cords in patients suffering from laryngeal paralysis.


Figures
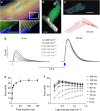
Figure 1
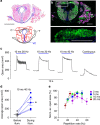
Figure 1. Functional expression of ChR2 in skeletal muscle.
(ac) Expression of ChR2-EYFP in skeletal muscles. (a) Single fibres isolated from flexor digitorum brevis muscles showed bright ChR2-EYFP (green) signals with localization at the cell membrane including the t-tubulus system that surrounds the α-actinin (magenta) containing z-discs (enlargements in lower panels). (b,c) Bright ChR2-EYFP (green) signals were found in explanted soleus muscles (b) and were restricted to α-actinin (magenta) positive skeletal muscle cells (c, top). No expression was seen in the tendon identified with haematoxylin and eosin staining (c, bottom). (df) Light-induced single twitches in soleus muscles. (d) Representative examples of single twitches induced by 2- and 25-ms-long light pulses with increasing light intensities. (e) Relationship of pulse duration and maximal twitch force at high light intensity (1.4 mW mm−2, n=5). (f) Overall comparison of the maximum twitch force induced by single light pulses of different durations and intensities (n=5). Error bars, s.e.m., nuclear staining in blue, scale bars, 10 μm (a), 1 mm (b,c).
Figure 2
Figure 2. Optogenetic generation of tetanic contractions.
(a) Representative examples of sustained contractions generated by various 2-s-long illumination patterns. (b) Quantification of average force during optical stimulation in comparison with electrical stimulation (100 Hz, 20 V, 1 ms, biphasic) (P<0.0001, repeated Dunnett ANOVA test with continuous light stimulation as control, n=6). (c) Relationship between repetition rate and average force normalized to maximal electrical stimulation for different light pulse durations (n=4). Error bars, s.e.m. Av., average; cont., continuous; elect., electrical; norm., normalized; stim., stimulation.
Figure 3
Figure 3. Light-induced action potentials.
(a) Light-induced depolarizations and action potentials using 1-, 5-, 10- and 50-ms-long light pulses (1.4 mW mm−2). (b) Relationship between the duration of light pulses and action potential durations (APD, n=4). (c) Membrane potential change during tetanic stimulation (rate of 10 or 50 Hz) using 5-ms-long light pulses (1.4 mW mm−2). Error bars, s.e.m.
Figure 4
Figure 4. Fatigue induction during optical and electrical stimulation.
Fatigue development during 350-ms-long tetanic stimulation pattern (optical, 5 ms pulses, 30 Hz, 1.4 mW mm−2, electrical, 0.1 ms, biphasic, 100 Hz, 20 V) over a time period of 10 min. Fatigue values were compared at each time point using a two-way, paired Student's t-test resulting in P values>0.05 (n=7).
Figure 5
Figure 5. Optical stimulation in CAG EGFP control mice.
Representative recording (n=4) of isometric force measurements of soleus muscles from mice expressing only EGFP during optical stimulation with 5-ms-long pulses at 30 Hz (1.4 mW mm−2) and electrical stimulation (10 mA, 1 ms, 100 Hz).
Figure 6
Figure 6. Optogenetic opening of the vocal cords.
(a) H&E staining of a section through the larynx (top) and schematic drawing displaying the different muscle groups and cartilages (bottom: P: posterior cricoarytenoid muscle; L, lateral cricoarytenoid muscle, C, cricoid cartilage; VC, vocal cords; T, thyroid cartilage; Tl, lateral cricothyroid muscle; Tm, medial cricothyroid muscle). (b) Membrane-bound ChR2-EYFP signals (green, enlargement in lower panel) overlaid with α-actinin staining (magenta) in a consecutive slice. (c) Representative examples of opening of the vocal cords induced by various 4-s-long illumination patterns. (d) Open area between the vocal cords calculated before and during illumination (10 ms light pulses, 35.7 mW mm−2, 40 Hz repetition rate, n=5, two-way, paired Student's t-test, P=0.0145). (e) Relationship between repetition rate and average open area normalized to maximal opening for different light pulse durations (35.7 mW mm−2, n=3). Error bars, s.e.m., nuclear staining in blue, scale bars, 1 mm (a), 500 μm (b).
Figure 7
Figure 7. Functional ChR2 expression in the larynx after AAV-based gene transfer.
(a) mCherry expression (magenta) in α-actinin (white)-positive fibres of the posterior cricoarytenoid muscle (autofluorescence in green, enlargements in lower panels). (b) Representative example of the transient opening of the vocal cords during 2-s-long pulsed illumination (10 ms, 40 Hz, 35.7 mW mm−2). Nuclear staining in blue, scale bar, 200 μm.

References

    1. Nagel G. et al.. Channelrhodopsin-2, a directly light-gated cation-selective membrane channel. Proc. Natl Acad. Sci. USA 100, 13940–13945 (2003). - PMC - PubMed
    1. Boyden E. S., Zhang F., Bamberg E., Nagel G. & Deisseroth K. Millisecond-timescale, genetically targeted optical control of neural activity. Nat. Neurosci. 8, 1263–1268 (2005). - PubMed
    1. Gradinaru V. et al.. Targeting and readout strategies for fast optical neural control in vitro and in vivo. J. Neurosci. 27, 14231–14238 (2007). - PMC - PubMed
    1. Llewellyn M. E., Thompson K. R., Deisseroth K. & Delp S. L. Orderly recruitment of motor units under optical control in vivo. Nat. Med. 16, 1161–1165 (2010). - PMC - PubMed
    1. Bryson J. B. et al.. Optical control of muscle function by transplantation of stem cell-derived motor neurons in mice. Science 344, 94–97 (2014). - PMC - PubMed

Publication types

Substances