Comparative Study
. 2015 Jun 2;10(6):e0128669.
doi: 10.1371/journal.pone.0128669. eCollection 2015.

Fecal Microbiota in Healthy Subjects Following Omnivore, Vegetarian and Vegan Diets: Culturable Populations and rRNA DGGE Profiling

Affiliations
Comparative Study

Fecal Microbiota in Healthy Subjects Following Omnivore, Vegetarian and Vegan Diets: Culturable Populations and rRNA DGGE Profiling

Ilario Ferrocino et al. PLoS One. .

Abstract

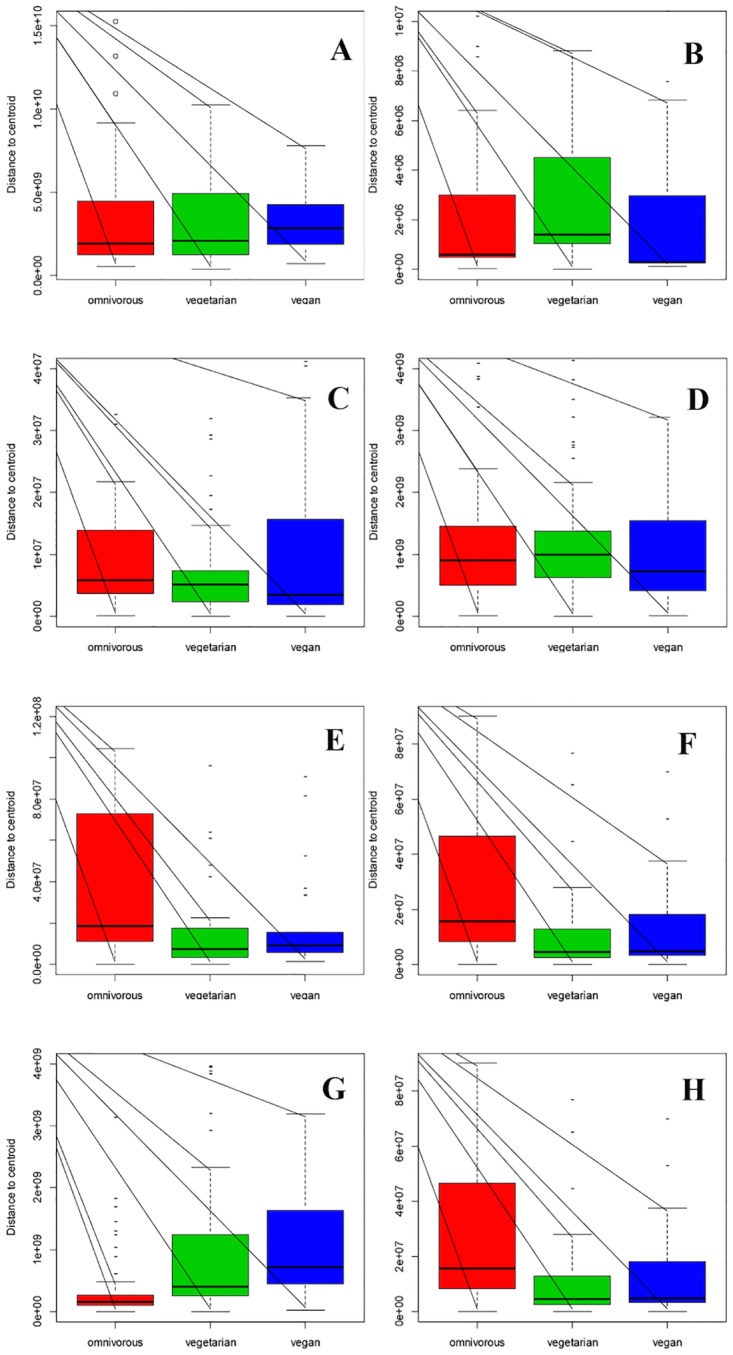
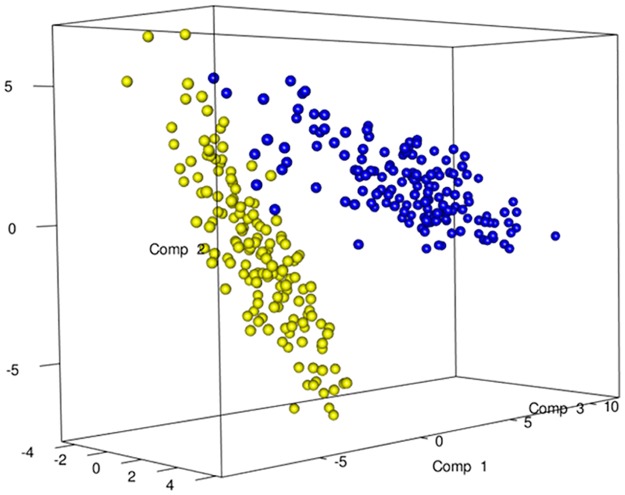
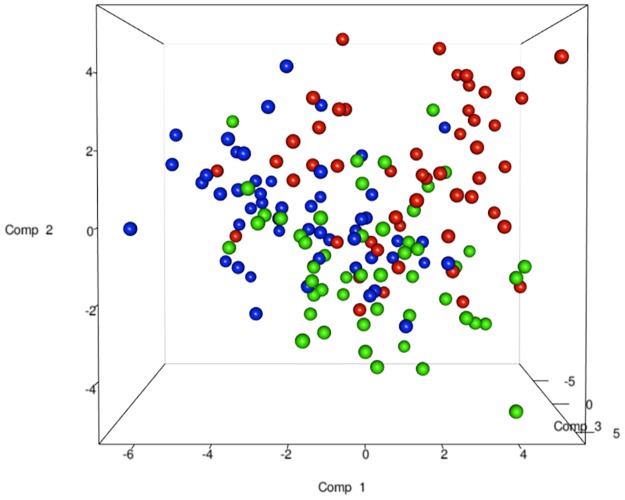
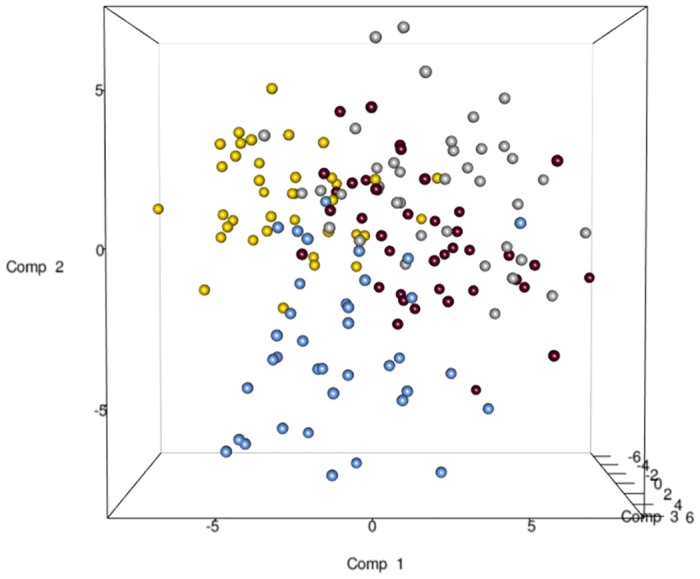
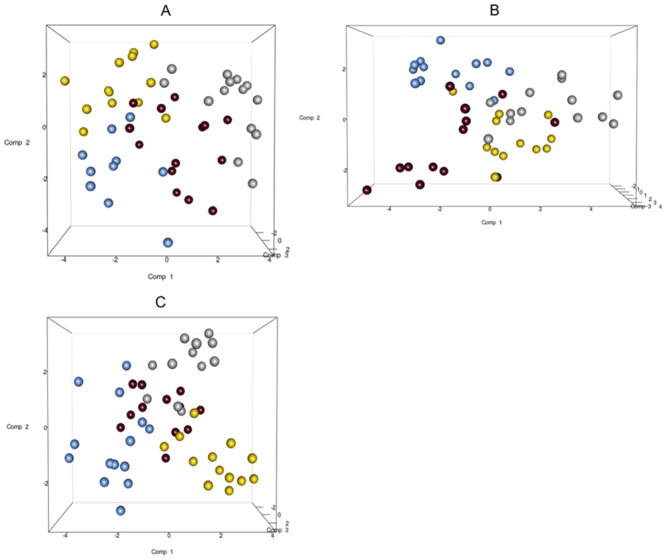
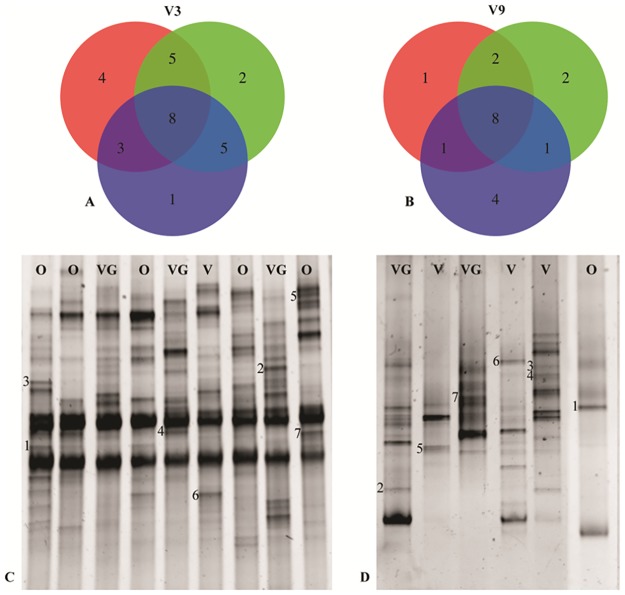
In this study, the fecal microbiota of 153 healthy volunteers, recruited from four different locations in Italy, has been studied by coupling viable counts, on different microbiological media, with ribosomal RNA Denaturing Gradient Gel Electrophoresis (rRNA-DGGE). The volunteers followed three different diets, namely omnivore, ovo-lacto-vegetarian and vegan. The results obtained from culture-dependent and -independent methods have underlined a high level of similarity of the viable fecal microbiota for the three investigated diets. The rRNA DGGE profiles were very complex and comprised a total number of bands that varied from 67 to 64 for the V3 and V9 regions of the 16S rRNA gene, respectively. Only a few bands were specific in/of all three diets, and the presence of common taxa associated with the dietary habits was found. As far as the viable counts are concerned, the high similarity of the fecal microbiota was once again confirmed, with only a few of the investigated groups showing significant differences. Interestingly, the samples grouped differently, according to the recruitment site, thus highlighting a higher impact of the food consumed by the volunteers in the specific geographical locations than that of the type of diet. Lastly, it should be mentioned that the fecal microbiota DGGE profiles obtained from the DNA were clearly separated from those produced using RNA, thus underlining a difference between the total and viable populations in the fecal samples.


Conflict of interest statement

Competing Interests: The authors have declared that no competing interests exist.

Figures

Fig 1
Fig 1. Distribution of the viable counts of the three diets according to the different culture media.
Box plot interpretation: the central line indicates the median, upper and lower box lines of the first and third quartiles (Q1 and Q3), respectively, and the bars at the end of the whiskers represent the distribution extremities, while the dots indicate outliers. Plot A, all the media considered together; Plot B, GSP medium at 25°C; Plot C, Chromocult Coliform Agar at 37°C; Plot D, Bifidumbacterium Agar at 37°C; Plot E, MRS at 25°C; Plot F, MRS at 37°C; Plot G, Wilkins-Chalgren Anaerobe Agar + GN Supplement; Plot H, Bacteroides Bile Esculine Agar. For specifications on the counted microbial groups, reference can be made to Table 1.
Fig 2
Fig 2. PLS-DA models based on the similarity distance matrix of DGGE built as a function of the nucleic acids.
Data from DNA (blue) and RNA (yellow).
Fig 3
Fig 3. PLS-DA models based on the RNA-DGGE similarity distance matrix as a function of the diet.
Data from omnivore (red), ovo-lacto-vegetarian (green) and vegan (blue) individuals.
Fig 4
Fig 4. PLS-DA models based on the RNA-DGGE similarity distance matrix as a function of the geographical site.
The plot is color coded as a function of the city: Bari (silver), Bologna (gold), Parma (blue), Torino (maroon).
Fig 5
Fig 5. PLS-DA models based on the RNA-DGGE similarity distance matrix from each diet group using the geographical site as the discriminating factor.
Plot A, omnivore individuals; Plot B, ovo-lacto-vegetarian individuals; Plot C, vegan individuals. The samples are color coded according to the geographical site (Bari: silver; Bologna: gold; Parma: blue; Torino: maroon).
Fig 6
Fig 6. RNA-DGGE band distribution.
Plot A and Plot B, Venn diagrams of the unique and overlapping bands present in the RNA-DGGE profile of the omnivore (red), ovo-lacto-vegetarian (green) and vegan (blue) individuals for the V3 and V9 regions, respectively; Plot C, RNA-DGGE fingerprints of the V3 amplicons, where the letters indicate the dietary groups: the omnivore (O), ovo-lacto-vegetarian (VG) and vegan (V) band identifications are reported in Table 2; Plot D, RNA-DGGE fingerprints of the V9 amplicons; the band identifications are reported in Table 3.

References

    1. O’Hara AM, Shanahan F. The gut flora as a forgotten organ. EMBO Rep. 2006;7:688–93. - PMC - PubMed
    1. Eckburg PB, Bik EM, Bernstein CN, Purdom E, Dethlefsen L, Sargent M, et al. Diversity of the human intestinal microbial flora. Science. 2005;308:1635–8. - PMC - PubMed
    1. Lewis JD. Analysis of the human gut microbiome and association with disease. Clin Gastroenterol Hepatol. 2013;11:774–7. 10.1016/j.cgh.2013.03.038 - DOI - PMC - PubMed
    1. Foerster J, Maskarinec G, Reichardt N, Tett A, Narbad A, Blaut M, et al. The Influence of Whole Grain Products and Red Meat on Intestinal Microbiota Composition in Normal Weight Adults: A Randomized Crossover Intervention Trial. PLoS One. 2014;9:e109606 10.1371/journal.pone.0109606 - DOI - PMC - PubMed
    1. Agans R, Rigsbee L, Kenche H, Michail S, Khamis HJ, Paliy O. Distal gut microbiota of adolescent children is different from that of adults. FEMS Microbiol Ecol. 2011;77:404–12. 10.1111/j.1574-6941.2011.01120.x - DOI - PMC - PubMed

Publication types