. 2015 Jun 3:5:10564.
doi: 10.1038/srep10564.

A sensitised RNAi screen reveals a ch-TOG genetic interaction network required for spindle assembly

Affiliations

A sensitised RNAi screen reveals a ch-TOG genetic interaction network required for spindle assembly

Alexis R Barr et al. Sci Rep. .

Erratum in

Abstract

How multiple spindle assembly pathways are integrated to drive bipolar spindle assembly is poorly understood. We performed an image-based double RNAi screen to identify genes encoding Microtubule-Associated Proteins (MAPs) that interact with the highly conserved ch-TOG gene to regulate bipolar spindle assembly in human cells. We identified a ch-TOG centred network of genetic interactions which promotes centrosome-mediated microtubule polymerisation, leading to the incorporation of microtubules polymerised by all pathways into a bipolar structure [corrected]. Our genetic screen also reveals that ch-TOG maintains a dynamic microtubule population, in part, through modulating HSET activity. ch-TOG ensures that spindle assembly is robust to perturbation but sufficiently dynamic such that spindles can explore a diverse shape space in search of structures that can align chromosomes.


Figures
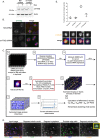
Figure 1
Figure 1
Setup of combinatorial RNAi screen. A. Western blot showing the extent of ch-TOG protein reduction 42 hr after Doxycycline (Dox) induction in a cell line stably expressing ch-TOG shRNA. β-actin is used as a loading control. B. Images showing that ch-TOG is depleted from the centrosomes and spindle MTs 42 hr after Dox addition. ch-TOG is in green, α-tub in red and DNA in blue in merged images. C. Workflow of RNAi screen. D. Image segmentation workflow to identify mitotic nuclei, segment mitotic cells and detect spindle poles. In yellow is a zoomed image from the final panel to show spindle pole segmentation. Scale bars are 10 μm. E. Graph showing the quantification of validation experiments. Mean +/− standard deviation (STD) of n =  4 is shown. Underneath the graph are representative images taken from the screening data to show the spindle phenotypes of each of the four conditions shown in the graph. α-tubulin is in yellow, PHH3 in green, RFP in red and DNA is in blue in merged images. All scale bars represent 10 μm.
Figure 2
Figure 2
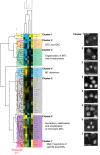
Hierarchical clustering of differential Z (dZ) scores. Only genes that had a Z-score > +/−1 for changes in either percentage of cells with multipolar spindles or number of spindle poles per cell in ch-TOG shRNA cells are included here. Yellow represents a positive dZ score, blue represents a negative dZ score and darker shading represents a dZ score close to zero. On the right are representative images of α-tubulin staining from the screen for some of the genes listed. ‘MN’ refers to percentage of multinucleate cells. All scale bars represent 10 μm.
Figure 3
Figure 3
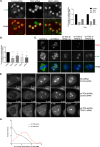
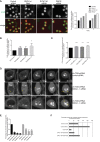
Suppressing the chromatin-mediated spindle assembly pathway restores bipolar spindles to ch-TOG shRNA cells. A. Representative images of screening data of control, TPX2 and RCC1 siRNA in ch-TOG shRNA cells. α-tubulin is shown in green and PHH3 in red in merged images. Scale bar represents 10 μm. Graph shows the fold change in the percentage of cells with multipolar spindles across duplicate plates in the screen. B. Graph showing the validation of screening data with three independent siRNAs targeting TPX2. MCAK siRNA was included as a positive control. n = 3, mean +/− STD are shown. One-way ANOVA followed by Dunnett’s test for multiple comparisons: **p ≤ 0.001, *p ≤ 0.05. C. Images from synchronised cells showing depletion of TPX2 using three siRNAs and loss of multipolar spindle formation in ch-TOG+TPX2 codepleted cells. TPX2 is in red, α-tubulin in green and DAPI in blue in merged images. Scale bar represents 10 μm. D. Stills taken from live imaging of GFP-Tubulin NS and ch-TOG shRNA cells treated with control or TPX2-1 siRNA. All images are aligned to NEBD at 0 min. Images shown are maximum intensity projections of Z-stacks. Scale bar represents 5 μm. E. Graph showing the frequency distribution of acentrosomal aster appearance in ch-TOG shRNA cells treated with either control or TPX2-1 siRNA. Acentrosomal asters were scored 2 min post-NEBD, n = 22 cells (control) and n = 25 cells (TPX2). Student’s t-test determined the difference between the two distributions to be significant (p = 0.0002).
Figure 4
Figure 4
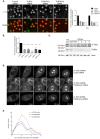
Depleting γ-TuRC components restores bipolar spindle formation to ch-TOG depleted cells. A. Representative images of screening data of control, TUBG1, TUBGCP3 and TUBGCP6 siRNA in ch-TOG shRNA cells. α-tubulin is shown in green and PHH3 is shown in red in merged images. Scale bar represents 10 μm. Graph shows the fold change in the percentage of cells with multipolar spindles across duplicate plates in the screen. B. Graph showing the validation of our screening data with four independent siRNAs targeting TUBG1 and a re-test of the TUBG1 pooled siRNA. n = 3, mean +/− STD are shown. One-way ANOVA followed by Dunnett’s test for multiple comparisons: ****p ≤ 0.0001. C. Western blot showing decrease in ch-TOG protein in ch-TOG shRNA cells and γ-tubulin protein after TUBG1 siRNA. Β-actin is used as a loading control. D. Stills taken from movies of ch-TOG shRNA cells expressing GFP-Tubulin treated with either control siRNA or TUBG1pool siRNA. All images are aligned to NEBD at 0 min. Images shown are maximum intensity projections of Z-stacks. Scale bar represents 10 μm. E. Graph shows the frequency distribution of acentrosomal aster appearance in ch-TOG shRNA cells treated with either control, TUBG1pool or MCAK siRNA. Acentrosomal asters were scored 2 min post-NEBD, n = 24 cells (control), n = 16 cells (TUBG1), n = 15 cells (MCAK).
Figure 5
Figure 5
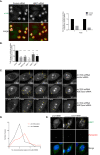
ch-TOG and HSET interact during mitotic spindle formation. A. Representative images of control and HSET depleted ch-TOG shRNA cells. α-tubulin is in green and PHH3 is in red in merged images. Graph shows the fold change in the percentage of cells with multipolar spindles across duplicate plates in the screen. B. Graph showing the validation of our screening data with three independent siRNAs targeting HSET and a re-test of the HSET pooled siRNA. MCAK siRNA was included as a positive control in all experiments. n = 3, mean +/− STD is shown. One-way ANOVA followed by Dunnett’s test for multiple comparisons: ****p ≤ 0.0001, ***p ≤ 0.001. C. Stills taken from movies of ch-TOG shRNA cells expressing GFP-Tubulin treated with either control siRNA or HSETpool siRNA. All images are aligned to NEBD at 0 min. Yellow arrows indicate acentrosomal asters, which are smaller in ch-TOG+HSET codepleted cells. Yellow asterisk indicates non-specific fluorescence (outside the cell at −2 min). Images shown are maximum intensity projections of Z-stacks. Scale bar represents 10 μm. D. Graph shows the frequency distribution of acentrosomal aster appearance in ch-TOG shRNA cells treated with either control or HSETpool siRNA. Acentrosomal asters were scored 2 min post-NEBD, n = 21 cells (control), n = 26 cells (HSET). Student’s t-test determined the difference between the two distributions to be significant (p = 0.025). E. Representative images of ch-TOG shRNA cells in the process of undergoing NEBD. Prior to NEBD, HSET is nuclear. As the nuclear envelope breaks down, HSET is released and localises to acentrosomal MT asters and bundles (indicated by yellow arrows), as well as centrosomal MTs. HSET is green, Pericentrin is red and DNA is blue in merged images. All scale bars represent 10 μm.
Figure 6
Figure 6
ch-TOG maintains a balance between microtubule motor activities. A. Representative images of screening data of control, DNCL1, DYNC1H1 and DNCI2 siRNA in ch-TOG shRNA cells. α-tubulin is in green and PHH3 is in red in merged images. Scale bar represents 10 μm. Graph shows the fold change in the percentage of cells with multipolar spindles across duplicate plates in the screen. B. Graph showing the validation of our screening data with three independent siRNAs targeting DNCL1. n = 3, mean +/− STD is shown. One-way ANOVA followed by Dunnett’s test for multiple comparisons: **p ≤ 0.01. C. Graph showing an increase in the number of spindle poles in ch-TOG shRNA cells after depletion of DNCL1. n = 3, mean +/− STD is shown. One-way ANOVA followed by Dunnett’s test for multiple comparisons: ****p ≤ 0.0001, ***p ≤ 0.001. D. Stills taken from movies of ch-TOG shRNA cells expressing GFP-Tubulin treated with either control siRNA or DNCL1_1 siRNA. All images are aligned to NEBD at 0 min. Yellow arrows indicate small acentrosomal asters in DNCL1 siRNA cells that are still present at late timepoints. Yellow asterisk indicates non-specific fluorescence. Images shown are maximum intensity projections of Z-stacks. Scale bar represents 10 μm. E. Graph showing the percentage of cells with multipolar spindles in ch-TOG shRNA cells treated with either DMSO or MA, added either pre spindle assembly for 16h or post spindle assembly, for 1h. All data is normalised to DMSO treated cells. n = 2, mean +/− STD is shown. F. Graph showing an interaction between Eg5 and DNCL1 in ch-TOG shRNA cells (DNCL1_3 siRNA was used in this experiment). To determine if an interaction occurs, an interaction score was calculated based on the difference between the observed and expected phenotypes (see Methods). We determined a positive/alleviating genetic interaction score of +1.02.
Figure 7
Figure 7
A network of ch-TOG interactions ensures bipolar spindle formation. In wild-type cells, MTs nucleated from the centrosome are dominant in spindle formation. Depletion of ch-TOG not only reduces the contribution of centrosomal MTs to the spindle, but also reduces MT dynamics and leads to an imbalance in motor activity. Depletion of TPX2 or TUBG1 in ch-TOG depleted cells reduces the contribution of acentrosomal MTs to spindle formation, thus redressing the balance between centrosomal and acentrosomal pathways. Depletion of HSET in ch-TOG depleted cells reduces MT crosslinking and increases overall MT dynamics allowing acentrosomal asters to be incorporated into centrosomal asters. Depletion of dynein in ch-TOG depleted cells leads to an increased imbalance in motor activity and generates additional spindle poles.

References

    1. Heald R., Tournebize R., Habermann A., Karsenti E. & Hyman A. Spindle assembly in Xenopus egg extracts: respective roles of centrosomes and microtubule self-organization. J Cell Biol 138, 615–628 (1997). - PMC - PubMed
    1. Khodjakov A., Cole R.W., Oakley B.R. & Rieder C.L. Centrosome-independent mitotic spindle formation in vertebrates. Curr Biol 10, 59–67 (2000). - PubMed
    1. Wadsworth P. & Khodjakov A. E pluribus unum: towards a universal mechanism for spindle assembly. Trends Cell Biol 14, 413–419 (2004). - PubMed
    1. Luders J. & Stearns T. Microtubule-organizing centres: a re-evaluation. Nat Rev Mol Cell Biol 8, 161–167 (2007). - PubMed
    1. Luders J., Patel U.K. & Stearns T. GCP-WD is a gamma-tubulin targeting factor required for centrosomal and chromatin-mediated microtubule nucleation. Nat Cell Biol 8, 137–147 (2006). - PubMed

Publication types