

Adipose Tissue Redistribution and Ectopic Lipid Deposition in Active Acromegaly and Effects of Surgical Treatment
- PMID: 26037515
- PMCID: PMC4524994
- DOI: 10.1210/jc.2015-1917
Adipose Tissue Redistribution and Ectopic Lipid Deposition in Active Acromegaly and Effects of Surgical Treatment
Abstract
Context: GH and IGF-I have important roles in the maintenance of substrate metabolism and body composition. However, when in excess in acromegaly, the lipolytic and insulin antagonistic effects of GH may alter adipose tissue (AT) deposition.
Objectives: The purpose of this study was to examine the effect of surgery for acromegaly on AT distribution and ectopic lipid deposition in liver and muscle.
Design: This was a prospective study before and up to 2 years after pituitary surgery.
Setting: The setting was an academic pituitary center.
Patients: Participants were 23 patients with newly diagnosed, untreated acromegaly.
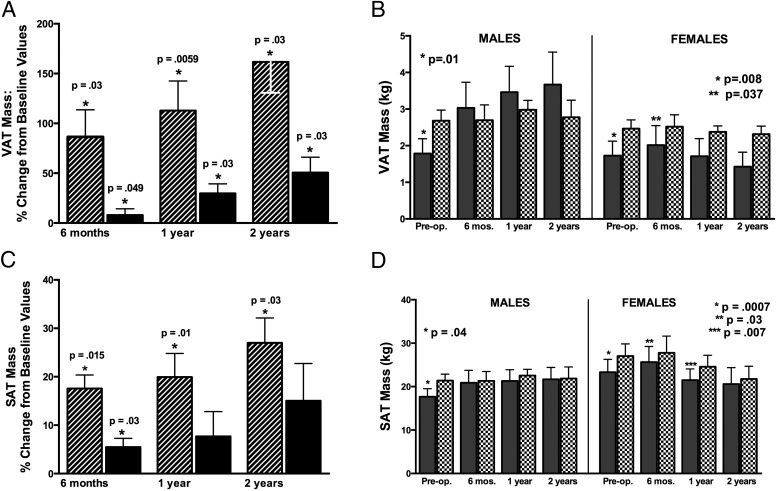
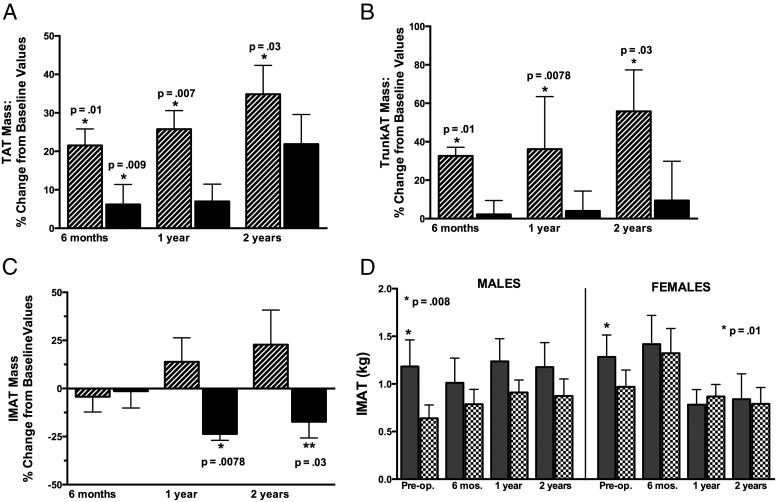
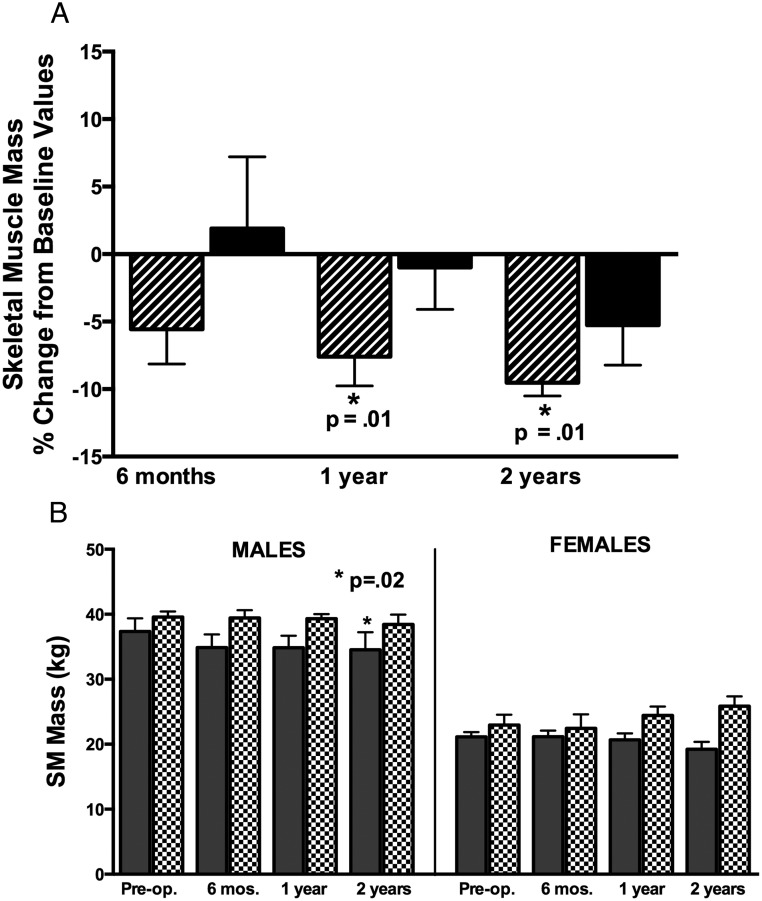
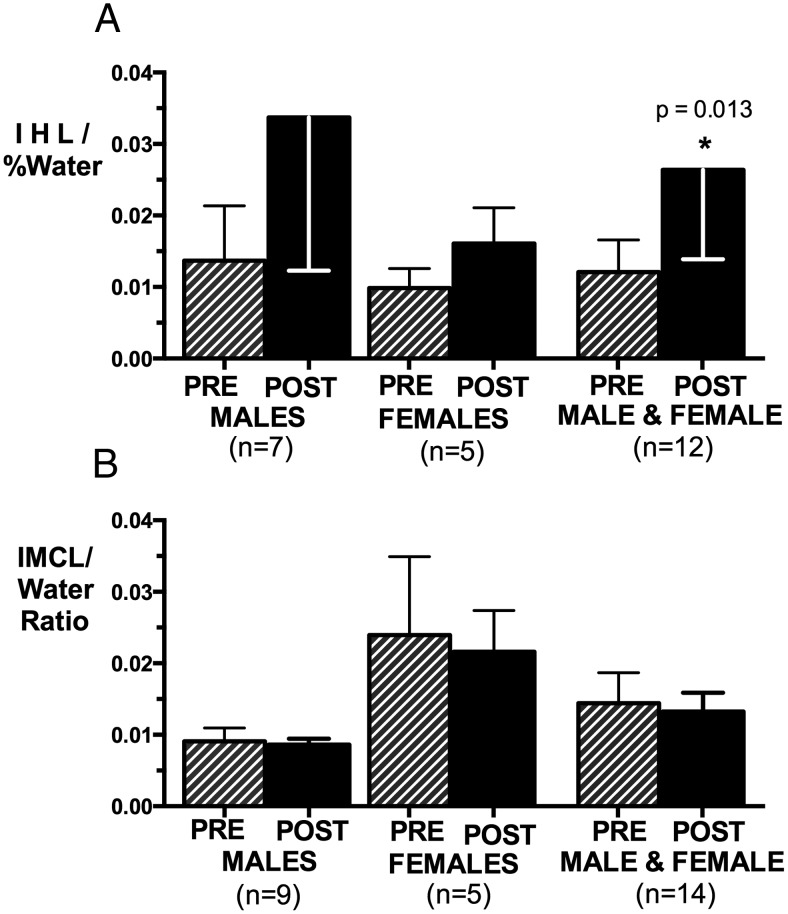
Main outcome measures: We determined visceral (VAT), subcutaneous (SAT), and intermuscular adipose tissue (IMAT), and skeletal muscle compartments by total-body magnetic resonance imaging, intrahepatic and intramyocellular lipid by proton magnetic resonance spectroscopy, and serum endocrine, metabolic, and cardiovascular risk markers.
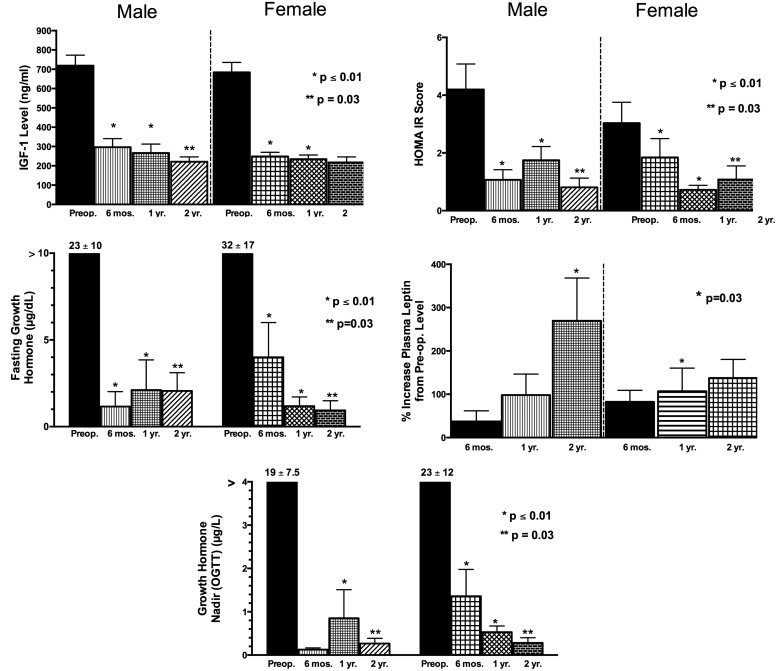
Results: VAT and SAT masses were lower than predicted in active acromegaly, but increased after surgery in male and female subjects along with lowering of GH, IGF-I, and insulin resistance. VAT and SAT increased to a greater extent in men than in women. Skeletal muscle mass decreased in men. IMAT was higher in active acromegaly and decreased in women after surgery. Intrahepatic lipid increased, but intramyocellular lipid did not change after surgery.
Conclusions: Acromegaly may present a unique type of lipodystrophy characterized by reduced storage of AT in central depots and a shift of excess lipid to IMAT. After surgery, this pattern partially reverses, but differentially in men and women. These findings have implications for understanding the role of GH in body composition and metabolic risk in acromegaly and other clinical settings of GH use.
Trial registration: ClinicalTrials.gov NCT01809808.
Figures
References
-
- Ho KK, O'Sullivan AJ, Hoffman DM. Metabolic actions of growth hormone in man. Endocr J. 1996;43(suppl):S57–S63. - PubMed
-
- O'Sullivan AJ, Kelly JJ, Hoffman DM, Freund J, Ho KK. Body composition and energy expenditure in acromegaly. J Clin Endocrinol Metab. 1994;78:381–386. - PubMed
-
- Møller N, Schmitz O, Jørgensen JO, et al. Basal- and insulin-stimulated substrate metabolism in patients with active acromegaly before and after adenomectomy. J Clin Endocrinol Metab. 1992;74:1012–1019. - PubMed
-
- Bengtsson BA, Brummer RJ, Eden S, Bosaeus I. Body composition in acromegaly. Clin Endocrinol (Oxf). 1989;30:121–130. - PubMed
-
- Goodpaster BH, Thaete FL, Kelley DE. Thigh adipose tissue distribution is associated with insulin resistance in obesity and in type 2 diabetes mellitus. Am J Clin Nutr. 2000;71:885–892. - PubMed
Publication types
MeSH terms
Associated data
Grants and funding
- P01 DK042618/DK/NIDDK NIH HHS/United States
- UL1 RR 024156/RR/NCRR NIH HHS/United States
- R01 DK 064720/DK/NIDDK NIH HHS/United States
- UL1 RR024156/RR/NCRR NIH HHS/United States
- K24 DK 073040/DK/NIDDK NIH HHS/United States
- P01-DK42618/DK/NIDDK NIH HHS/United States
- R01 CA118559/CA/NCI NIH HHS/United States
- P30 DK026687/DK/NIDDK NIH HHS/United States
- R01 DK064720/DK/NIDDK NIH HHS/United States
- R56 DK064720/DK/NIDDK NIH HHS/United States
- K24 DK073040/DK/NIDDK NIH HHS/United States
- P30-DK26687/DK/NIDDK NIH HHS/United States
LinkOut - more resources
Full Text Sources
Other Literature Sources
Medical
Research Materials
