

Blood-borne biomarkers of mortality risk: systematic review of cohort studies
- PMID: 26039142
- PMCID: PMC4454670
- DOI: 10.1371/journal.pone.0127550
Blood-borne biomarkers of mortality risk: systematic review of cohort studies
Abstract
Background: Lifespan and the proportion of older people in the population are increasing, with far reaching consequences for the social, political and economic landscape. Unless accompanied by an increase in health span, increases in age-related diseases will increase the burden on health care resources. Intervention studies to enhance healthy ageing need appropriate outcome measures, such as blood-borne biomarkers, which are easily obtainable, cost-effective, and widely accepted. To date there have been no systematic reviews of blood-borne biomarkers of mortality.
Aim: To conduct a systematic review to identify available blood-borne biomarkers of mortality that can be used to predict healthy ageing post-retirement.
Methods: Four databases (Medline, Embase, Scopus, Web of Science) were searched. We included prospective cohort studies with a minimum of two years follow up and data available for participants with a mean age of 50 to 75 years at baseline.
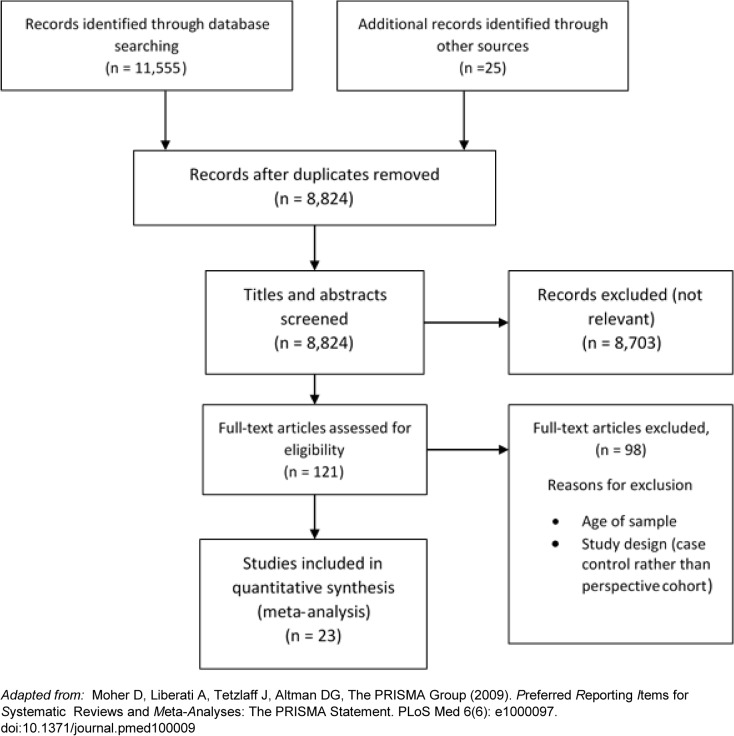
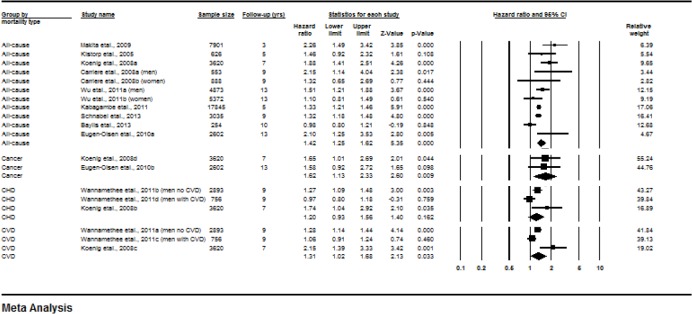
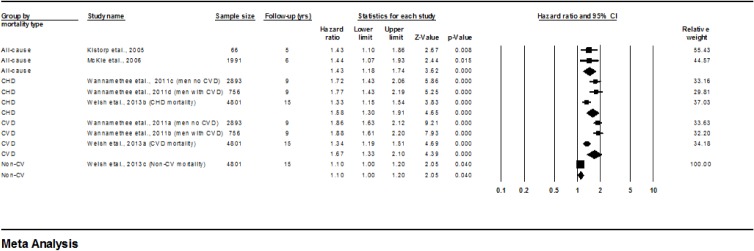
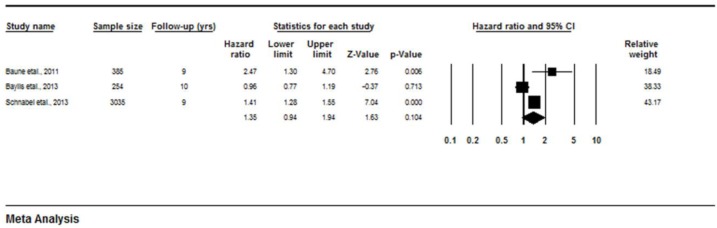
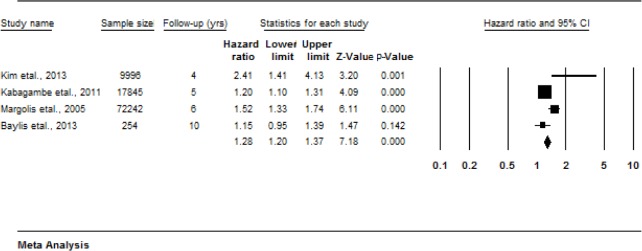
Results: From a total of 11,555 studies identified in initial searches, 23 fulfilled the inclusion criteria. Fifty-one blood borne biomarkers potentially predictive of mortality risk were identified. In total, 20 biomarkers were associated with mortality risk. Meta-analyses of mortality risk showed significant associations with C-reactive protein (Hazard ratios for all-cause mortality 1.42, p<0.001; Cancer-mortality 1.62, p<0.009; CVD-mortality 1.31, p = 0.033), N Terminal-pro brain natriuretic peptide (Hazard ratios for all-cause mortality 1.43, p<0.001; CHD-mortality 1.58, p<0.001; CVD-mortality 1.67, p<0.001) and white blood cell count (Hazard ratios for all-cause mortality 1.36, p = 0.001). There was also evidence that brain natriuretic peptide, cholesterol fractions, erythrocyte sedimentation rate, fibrinogen, granulocytes, homocysteine, intercellular adhesion molecule-1, neutrophils, osteoprotegerin, procollagen type III aminoterminal peptide, serum uric acid, soluble urokinase plasminogen activator receptor, tissue inhibitor of metalloproteinases 1 and tumour necrosis factor receptor II may predict mortality risk. There was equivocal evidence for the utility of 14 biomarkers and no association with mortality risk for CD40 ligand, cortisol, dehydroepiandrosterone, ferritin, haemoglobin, interleukin-12, monocyte chemoattractant protein 1, matrix metalloproteinase 9, myelopereoxidase, P-selectin, receptor activator of nuclear factor KappaB ligand, sex hormone binding globulin, testosterone, transferrin, and thyroid stimulating hormone and thyroxine.
Conclusions: Twenty biomarkers should be prioritised as potential predictors of mortality in future studies. More studies using standardised protocols and reporting methods, and which focus on mortality rather than risk of disease or health status as an outcome, are needed.
Conflict of interest statement
Figures
References
-
- Office for National Statistics. National population projections UK2009 [14/06/2011]. 14]. Available from: http://www.statistics.gov.uk/pdfdir/pproj1009.pdf.
Publication types
MeSH terms
Substances
Grants and funding
LinkOut - more resources
Full Text Sources
Other Literature Sources
Research Materials
