. 2015 Jun 4:11:23.
doi: 10.1186/s12992-015-0109-9.

Reducing the global burden of type 2 diabetes by improving the quality of staple foods: The Global Nutrition and Epidemiologic Transition Initiative

Collaborators, Affiliations

Reducing the global burden of type 2 diabetes by improving the quality of staple foods: The Global Nutrition and Epidemiologic Transition Initiative

Josiemer Mattei et al. Global Health. .

Abstract

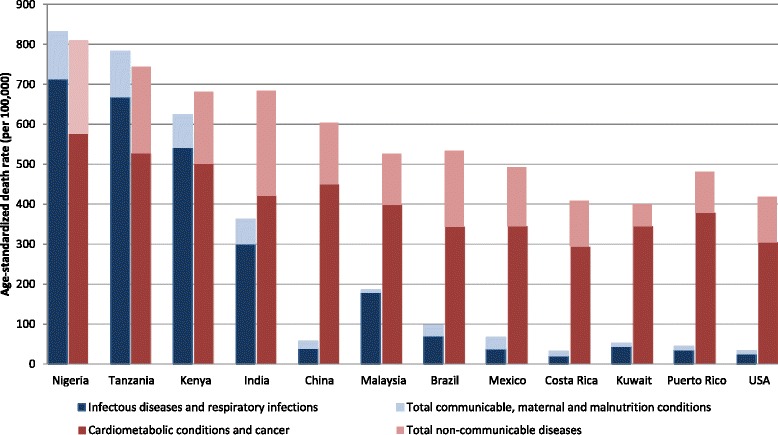
Background: The prevalence of type 2 diabetes has been reaching epidemic proportions across the globe, affecting low/middle-income and developed countries. Two main contributors to this burden are the reduction in mortality from infectious conditions and concomitant negative changes in lifestyles, including diet. We aimed to depict the current state of type 2 diabetes worldwide in light of the undergoing epidemiologic and nutrition transition, and to posit that a key factor in the nutrition transition has been the shift in the type and processing of staple foods, from less processed traditional foods to highly refined and processed carbohydrate sources.

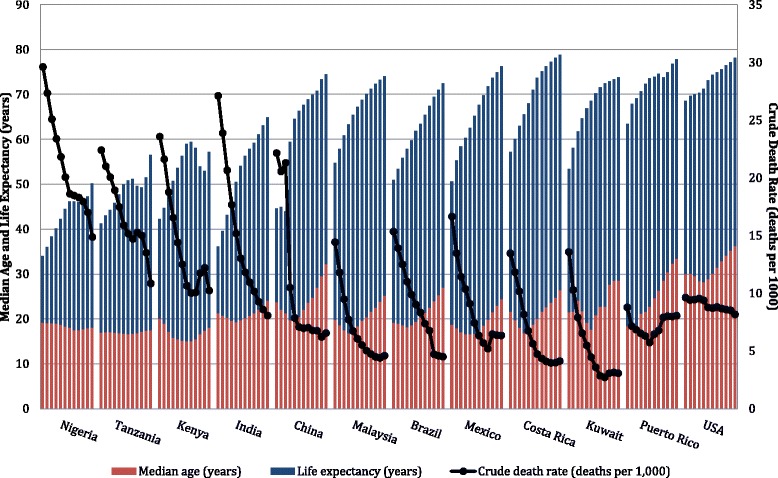
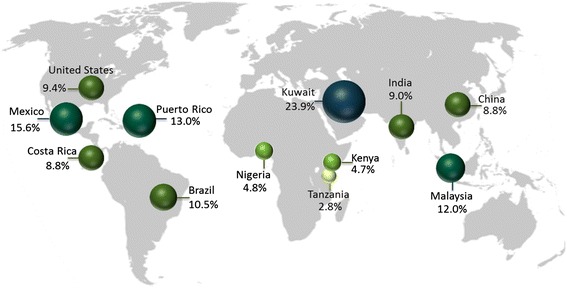
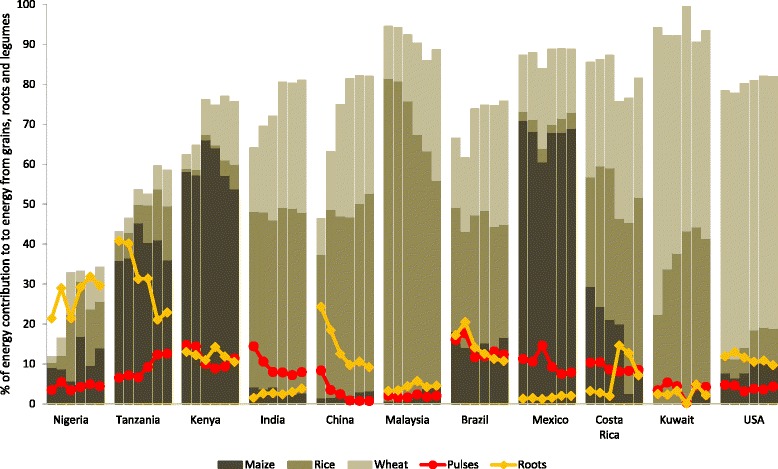
Discussion: We showed data from 11 countries participating in the Global Nutrition and Epidemiologic Transition Initiative, a collaborative effort across countries at various stages of the nutrition-epidemiologic transition whose mission is to reduce diabetes by improving the quality of staple foods through culturally-appropriate interventions. We depicted the epidemiologic transition using demographic and mortality data from the World Health Organization, and the nutrition transition using data from the Food and Agriculture Organization food balance sheets. Main staple foods (maize, rice, wheat, pulses, and roots) differed by country, with most countries undergoing a shift in principal contributors to energy consumption from grains in the past 50 years. Notably, rice and wheat products accounted for over half of the contribution to energy consumption from staple grains, while the trends for contribution from roots and pulses generally decreased in most countries. Global Nutrition and Epidemiologic Transition Initiative countries with pilot data have documented key barriers and motivators to increase intake of high-quality staple foods. Global research efforts to identify and promote intake of culturally-acceptable high-quality staple foods could be crucial in preventing diabetes. These efforts may be valuable in shaping future research, community interventions, and public health and nutritional policies.


Figures

Fig. 1
Fig. 1
Epidemiologic transition in twelve countries, by 5-year period from 1950–2010. Data obtained from United Nations World Population Prospects: The 2012 Revision. Crude death rate reflects the number of deaths over a given period divided by the person-years lived by the population over that period. Life expectancy is the average number of years of life expected by a hypothetical cohort of individuals who would be subject during all their lives to the mortality rates of a given period. Median age is the age that divides the population in two parts of equal size. Tanzania includes Zanzibar. Data for China do not include Hong Kong and Macao, Special Administrative Regions (SAR) of China, and Taiwan Province of China. Malaysia includes Sabah and Sarawak
Fig. 2
Fig. 2
Age-standardized death rate by cause of death in twelve countries, 2008. Data obtained from WHO Global Burden of Disease Death Estimates, 2008. Cause-specific death rates were age-standardized to the WHO global standard population by applying age-specific death rates for the country to a global standard population. Mortality estimates are based on analysis of latest available national information on levels of mortality and cause distributions as at the end of 2010 together with latest available information from WHO programs, IARC and UNAIDS for specific causes of public health importance. Cause of death categories and their definitions were defined using the International Classification of Diseases, Tenth Revision (ICD-10). Cardiometabolic conditions and cancer includes malignant and other neoplasms, diabetes mellitus, endocrine disorders, and cardiovascular diseases. Total non-communicable diseases additionally include diseases in sense organ, respiratory (non-infectious), digestive, genitourinary, skin and musculoskeletal, as well as congenital anomalies, oral conditions and neuropsychiatric conditions Data for Puerto Rico is from 2007, obtained from the Centers for Disease Control and Prevention, National Vital Statistics Reports Final Data for 2007. Population used for computing death rates are postcensal estimates based on the 2000 census estimated as of July 1, 2007. Numbers after causes of death are categories of the International Classification of Diseases, Tenth Revision (ICD–10). Infectious diseases include influenza and pneumonia, and HIV. Total communicable diseases additionally include infant deaths (exclusive of fetal deaths). Cardiometabolic conditions and cancer include diseases of the heart, essential hypertensive disease, cerebrovascular diseases, diabetes, and malignant neoplasms. Total non-communicable diseases additionally include Alzheimer’s disease, chronic lower respiratory diseases, chronic liver disease and cirrhosis, nephritis, nephrotic syndrome and nephrosis, and Parkinson's disease. Causes of deaths included for Puerto Rico differ from those for the other counties, thus caution should be made when comparing death rates
Fig. 3
Fig. 3
Prevalence of diabetes in twelve countries for the 20–79 age group, 2011. Data obtained from the International Diabetes Federation: Diabetes Atlas, 2012. The data are the comparative prevalence of diabetes, calculated according to the WHO standard, in the 20–79 age group
Fig. 4
Fig. 4
Contribution to energy consumption from grains, roots and pulses, for main staple carbohydrate sources, by 10-year period from 1961–2001 and 2009. Data obtained from the FAO Statistics Division: Food Balance (Supply) Data. Dietary energy consumption per person refers to the amount of food in kilocalories per day available for each individual in the total population during the reference period. Caloric content is derived by applying the appropriate food composition factors to the quantities of the commodities. Per person supplies are derived from the total amount of food available for human consumption by dividing total calories by total population actually partaking of the food supplies during the reference period. Per person Figure represent only the average supply available for the population as a whole and do not necessarily indicate what is actually consumed by individuals, which may be lower depending on the magnitude of wastage and losses of food in the household. All food items include edible whole and milled commodity and the derived products. Cereals used for alcoholic beverages were excluded. Other grain contributions not depicted in the figure include sorghum, millet, rye, barley, oats and buckwheat, quinoa, fonio, triticale, popcorn, and mixed grains. Pulses include all dry beans and peas (e.g.: chick peas, cow peas, pigeon peas, lentils). Roots include starchy roots and tubers (e.g.: cassava, plantains, potatoes, sweet potatoes, yams, yautía, and taro). Figure does not depict total carbohydrate contribution. Data not available for Puerto Rico

References

    1. International Diabetes Federation. IDF Diabetes Atlas. 2013. http://www.idf.org/sites/default/files/EN_6E_Atlas_Full_0.pdf. Accessed: 18 Sept 2014.
    1. World Health Organization. Diabetes factsheet. 2013. http://www.who.int/mediacentre/factsheets/fs312/en/. Accessed: 18 Sept 2014.
    1. Danaei G, Finucane MM, Lu Y, Singh GM, Cowan MJ, Paciorek CJ, et al. National, regional, and global trends in fasting plasma glucose and diabetes prevalence since 1980: systematic analysis of health examination surveys and epidemiological studies with 370 country-years and 2.7 million participants. Lancet. 2011;378(9785):31–40. - PubMed
    1. Hossain P, Kawar B, El Nahas M. Obesity and diabetes in the developing world–a growing challenge. N Engl J Med. 2007;356(3):213–5. - PubMed
    1. Omran AR. The epidemiologic transition. A theory of the epidemiology of population change. Milbank Mem Fund Q. 1971;49(4):509––38. - PubMed

Publication types

Substances