. 2015 Sep;78(3):439-53.
doi: 10.1002/ana.24454. Epub 2015 Jul 20.

Age and amyloid effects on human central nervous system amyloid-beta kinetics

Affiliations

Age and amyloid effects on human central nervous system amyloid-beta kinetics

Bruce W Patterson et al. Ann Neurol. 2015 Sep.

Abstract

Objective: Age is the single greatest risk factor for Alzheimer's disease (AD), with the incidence doubling every 5 years after age 65. However, our understanding of the mechanistic relationship between increasing age and the risk for AD is currently limited. We therefore sought to determine the relationship between age, amyloidosis, and amyloid-beta (Aβ) kinetics in the central nervous system (CNS) of humans.

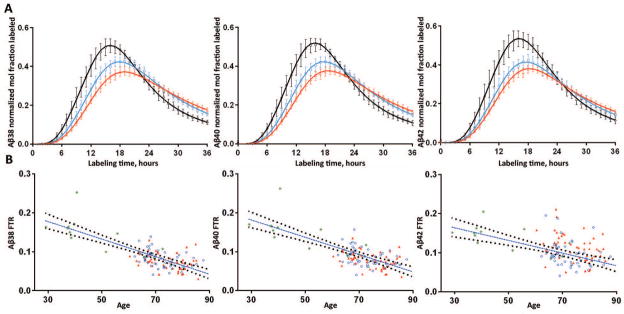
Methods: Aβ kinetics were analyzed in 112 participants and compared to the ages of participants and the amount of amyloid deposition.

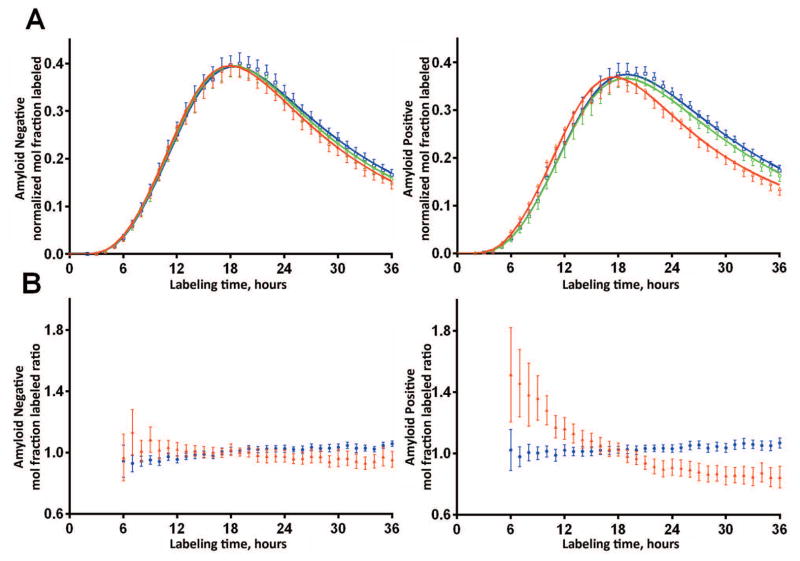
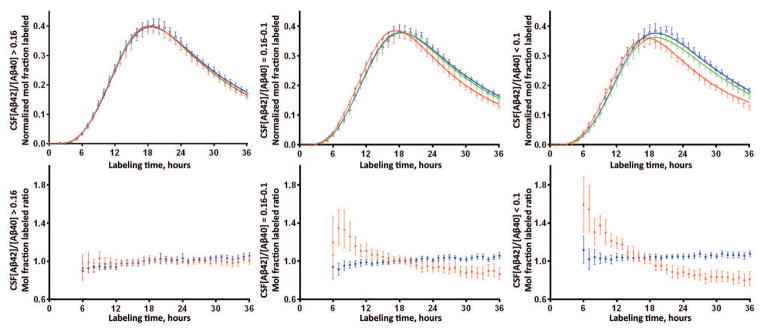
Results: We found a highly significant correlation between increasing age and slowed Aβ turnover rates (2.5-fold longer half-life over five decades of age). In addition, we found independent effects on Aβ42 kinetics specifically in participants with amyloid deposition. Amyloidosis was associated with a higher (>50%) irreversible loss of soluble Aβ42 and a 10-fold higher Aβ42 reversible exchange rate.

Interpretation: These findings reveal a mechanistic link between human aging and the risk of amyloidosis, which may be owing to a dramatic slowing of Aβ turnover, increasing the likelihood of protein misfolding that leads to deposition. Alterations in Aβ kinetics associated with aging and amyloidosis suggest opportunities for diagnostic and therapeutic strategies. More generally, this study provides an example of how changes in protein turnover kinetics can be used to detect physiological and pathophysiological changes and may be applicable to other proteinopathies.


Conflict of interest statement

Potential Conflicts of Interest

Drs. Bateman, Holtzman and Patterson report personal fees for consulting outside the submitted work from C2N Diagnostics, which has licensed related patents from Washington University. The following authors are inventors on patents held by Washington University in which they are eligible for personal fees and/or fees to their laboratories: RJB, BWP, DLE, KGW, DMH. Mr. Ovod, Ms. Ma, Mr. Chott, Dr. Yarasheski, Mrs. Sigurdson, and Ms. Zhang have nothing to disclose.

Figures

Figure 1
Figure 1. Aβ38, Aβ40 and Aβ42 turnover rates slow with increased age
A. The SILK time course profiles of Aβ38 (left), Aβ40 (middle) and Aβ42 (right) from 51 amyloid negative subjects from the present sporadic AD cohort are summarized along with 12 amyloid negative subjects who were previously reported. Results are averaged across 3 age groups spanning decade ranges: black = age 30’s–50’s, n= 9; blue = age 60’s, n=25; red = age 70’s–80’s, n=29. Error bars represent 95% confidence intervals. Solid lines represent the average model fits to the data for each age group. B. The turnover rates of all Aβ isoforms are highly negatively correlated with increased age. Results from older amyloid negative (blue circles) and amyloid positive (red triangles) are shown with 12 younger amyloid negative participants (green asterisks). A linear fit with 95% CI are shown for the age vs. FTR of Aβ.
Figure 2
Figure 2. Compartmental model of Aβ turnover kinetics
See Methods for description of model parameters.
Figure 3
Figure 3. Aβ42 kinetics are altered in brain amyloidosis
A. SILK Aβ time course profiles of the isotopic enrichment of Aβ peptides normalized to plasma leucine for each participant of Aβ38, Aβ40, and Aβ42 show altered Aβ42 kinetics in the amyloid positive group (mean ±95% CI). Amyloid negative participants (PET PIB MCBP < 0.18 or CSF Aβ42/Aβ40 concentration ratio >= 0.12, n=51) shown on left, amyloid positive participants (n=49) shown on right. Solid lines represent the mean model fit to the data. Blue: Aβ38; Green: Aβ40; Red: Aβ42. B. SILK labeled Aβ isoform ratios ≠1 demonstrate altered Aβ42 kinetics in the amyloid positive group (Blue: Aβ38/Aβ40 ratio; Red: Aβ42/Aβ40 ratio, mean ±95% CI). The amyloid negative group demonstrated similar kinetics of all three Aβ isoforms.
Figure 4
Figure 4. Tertile analysis reveals completely normal SILK Aβ42 kinetics in participants with the highest CSF Aβ42/40 ratio and SILK Aβ42 alterations present at intermediate CSF Aβ42/40
The top panel shows the mean and 95% confidence interval of the isotopic enrichment of Aβ peptides normalized to plasma leucine for each participant. Solid lines represent the mean model fit to the data. Blue: Aβ38; Green: Aβ40; Red: Aβ42. The bottom panel shows the mean (±95% CI) of the ratio of Aβ isoforms labeled demonstrating differences in kinetics between Aβ isoforms when ratios ≠ 1. Blue: Aβ38/Aβ40 ratio; Red: Aβ42/Aβ40 ratio. The left column of figures represents n=34 participants with CSF Aβ42/40 concentration ratio > 0.16; middle column is n=34 participants with concentration ratio between 0.10–0.16; right column is n=32 participants with concentration ratio <0.1.
Figure 5
Figure 5
Correlation of Aβ SILK parameters and measures of amyloidosis identify linear correlations of Aβ42/40 peak time ratios and (A) PET PIB MCBP, r=−0.47, n=60 and (B) CSF Aβ42/40 concentration ratios, r=0.63, n=92. FTR Aβ42/40 (C (n=64), D (n=100)) and Aβ42 exchange (E (n=64), F (n=100)) demonstrate a non-linear or state change relationship to amyloidosis, suggesting these measures detect the presence of amyloidosis, but don’t accurately quantify the amount. Amyloid−/CDR− (green circles), Amyloid−/CDR+ (dark green triangles), Amyloid+/CDR− (red circles), Amyloid+/CDR+ (dark red triangles).
Figure 6
Figure 6. Fibrillar plaque growth is observed in cognitively normal participants, but plateaus with clinical dementia
A, The annualized change in PET PIB MCBP is compared by baseline PET PIB and CDR (n=38). Delta PET PIB is the annualized change in PET PIB MCBP at times closest to the SILK study. Reference red dotted line represents conditional cutoff for amyloid groups (0.18). CDR−/PET PIB− (circles), CDR−/PET PIB+ (squares), CDR+/PET PIB− (diamond), CDR+/PET PIB+ (triangles). B, C, Correlations between the annualized change in fibrillar amyloid by PET PIB and FTR Aβ42 indicate that increasing fibrillar amyloid deposition is positively correlated with increased FTR Aβ42. In Amyloid positive (triangles) participants, R=0.75, p=0.002, n=14 and in both Amyloid positive and Amyloid negative (circles) participants, R=0.56, p=0.0002, n=38. The color shows CDR sum of the boxes (redder signifies more impaired clinical dementia on a scale from 0–6).
Figure 7
Figure 7. A biological model for increased Aβ42 exchange and increased irreversible loss
Faster irreversible loss and exchange are present in amyloidosis (regardless of age, ApoE allele type or cognitive impairment), suggesting that amyloid plaques or associated higher-order Aβ structures (e.g. protofibrils or oligomers) underlie altered Aβ42 kinetics. The FTR may represent irreversible loss due to Aβ42 deposition on plaques, while Aβ42 exchange may represent interactions of newly generated soluble Aβ42 with higher order Aβ structures such as oligomeric forms and amyloid plaques.

References

    1. Thies W, Bleiler L, Alzheimer’s A. 2013 Alzheimer’s disease facts and figures Alzheimer’s Association. Alzheimers & Dementia. 2013 Mar;9(2):208–45. - PubMed
    1. Jorm AF, Jolley D. The incidence of dementia - A meta-analysis. Neurology. 1998 Sep;51(3):728–33. - PubMed
    1. Qiu C, Kivipelto M, von Strauss E. Epidemiology of Alzheimer’s disease: occurrence, determinants, and strategies toward intervention. Dialogues in clinical neuroscience. 2009;11(2):111–28. - PMC - PubMed
    1. Roses AD, Saunders AM. APOE is a major susceptibility gene for Alzheimer’s disease. Current opinion in biotechnology 1994. 1994 Dec;5(6):663–7. - PubMed
    1. Ryman DC, Acosta-Baena N, Aisen PS, et al. Symptom onset in autosomal dominant Alzheimer disease: A systematic review and meta-analysis. Neurology. 2014;83(3):253–60. - PMC - PubMed

Publication types