

RPA prevents G-rich structure formation at lagging-strand telomeres to allow maintenance of chromosome ends
- PMID: 26041456
- PMCID: PMC4547897
- DOI: 10.15252/embj.201490773
RPA prevents G-rich structure formation at lagging-strand telomeres to allow maintenance of chromosome ends
Abstract
Replication protein A (RPA) is a highly conserved heterotrimeric single-stranded DNA-binding protein involved in DNA replication, recombination, and repair. In fission yeast, the Rpa1-D223Y mutation provokes telomere shortening. Here, we show that this mutation impairs lagging-strand telomere replication and leads to the accumulation of secondary structures and recruitment of the homologous recombination factor Rad52. The presence of these secondary DNA structures correlates with reduced association of shelterin subunits Pot1 and Ccq1 at telomeres. Strikingly, heterologous expression of the budding yeast Pif1 known to efficiently unwind G-quadruplex rescues all the telomeric defects of the D223Y cells. Furthermore, in vitro data show that the identical D to Y mutation in human RPA specifically affects its ability to bind G-quadruplex. We propose that RPA prevents the formation of G-quadruplex structures at lagging-strand telomeres to promote shelterin association and facilitate telomerase action at telomeres.
Keywords: G‐quadruplex; RPA; Schizosaccharomyces pombe; replication; telomeres.
© 2015 The Authors.
Figures
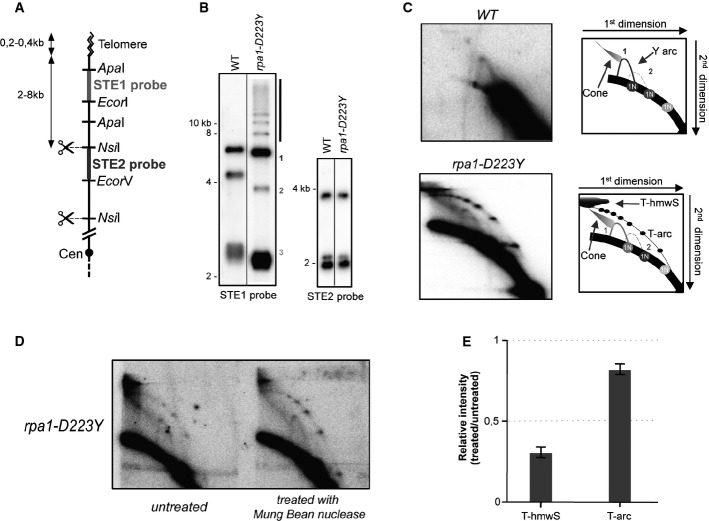
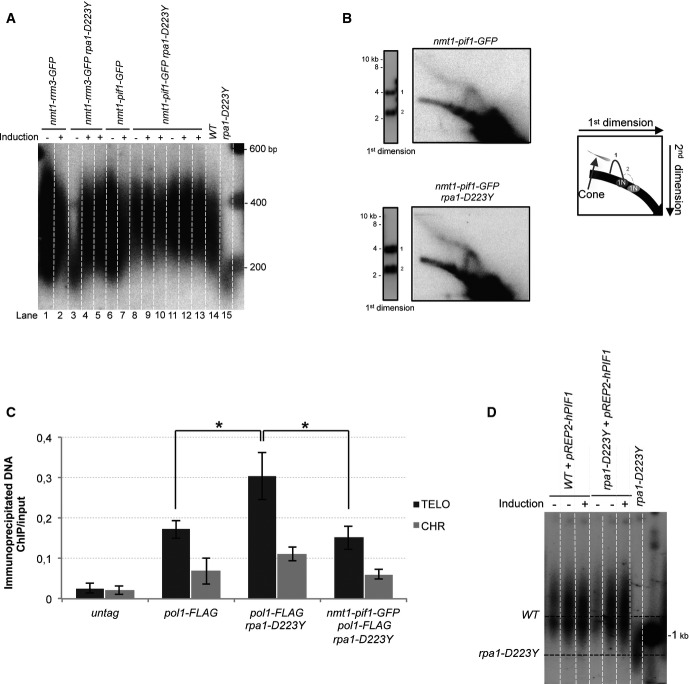
Relative position of the restriction sites in the telomeric and subtelomeric regions of chromosomes I and II. The subtelomeric probes (STE1 and STE2) used for 2D-gel hybridization are represented. Cen, centromere.
Southern blot analysis of NsiI telomeric fragments (1st dimension) revealed by STE1 and STE2 probes.
2D-gel analysis of NsiI telomeric fragments. The Y-arc pattern is generated by the unidirectional movement of a replication fork across each telomeric fragment shown in the 1st dimension. The cone-shaped signal represents four-way DNA junctions (double Y). In the rpa1-D223Y strain (lower panel), additional telomeric high-molecular weight structures (T-hmwS) and an extra telomeric arc (T-arc) are observed.
DNA of the rpa1-D223Y strain was treated with Mung Bean nuclease prior 2D-gel analysis.
Quantification of T-hmwS and T-arc signal for Rpa1-D223Y sample with and without Mung Bean nuclease treatment. T-hmwS and T-arc signals are normalized to the 1N spot signal. Bars correspond to the mean of two independent experiments.
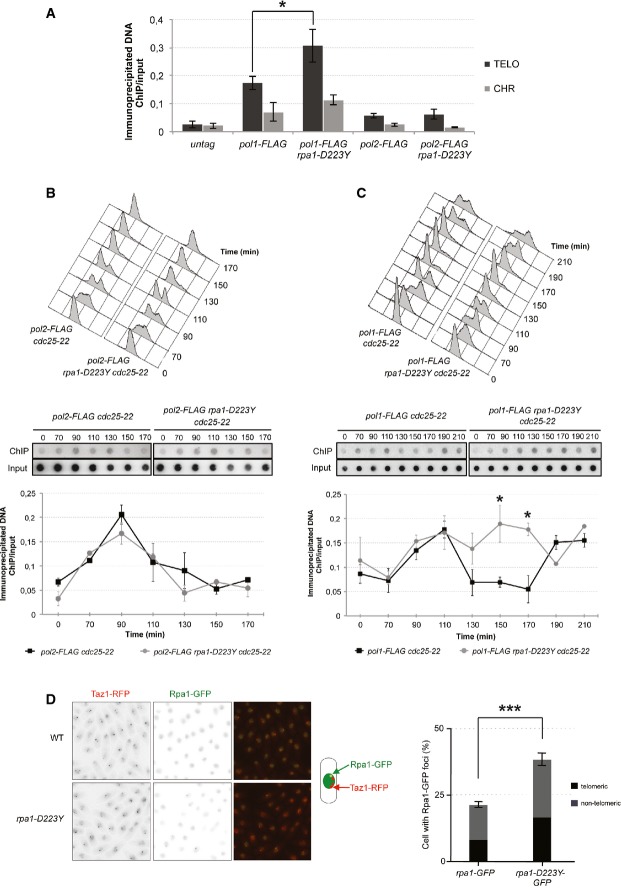
ChIP experiments of FLAG-tagged Pol1 (Polα) and Pol2 (Polε) at telomeres in WT and rpa1-D223Y asynchronous cells. The immunoprecipitated DNA was analyzed by quantitative PCR with telomeric primers and chromosomic primers (listed in Supplementary Table S2). The ratio of bound DNA over input DNA is represented. Data are the mean of five and four independent experiments for Polα and Polε, respectively.
FACS analysis of pol2-FLAG cdc25-22 and rap1-D223Y pol2-FLAG cdc25-22 strains. Cells were grown at 25°C until OD600nm = 0.4 and shifted to 36°C for 3.5 h to synchronize them. Cells were then released at 25°C from the G2/M block. Middle panel, Pol2-FLAG immunoprecipitated DNA were spotted onto Hybond-N+ membrane and hybridized with a telomeric probe. Signals were quantified with “Image Gauge” software. Lower panel, IP/input signals are plotted. Data are the mean of three independent experiments.
Same as (B) for pol1-FLAG cdc25-22 and rap1-D223Y pol1-FLAG cdc25-22 strains.
Number and telomeric localization of Rpa1-GFP and Rpa1-D223Y-GFP foci. Rpa1 foci were analyzed in cells expressing Taz1-RFP. Data are the mean of three independent experiments with n > 300 cells for each clone.
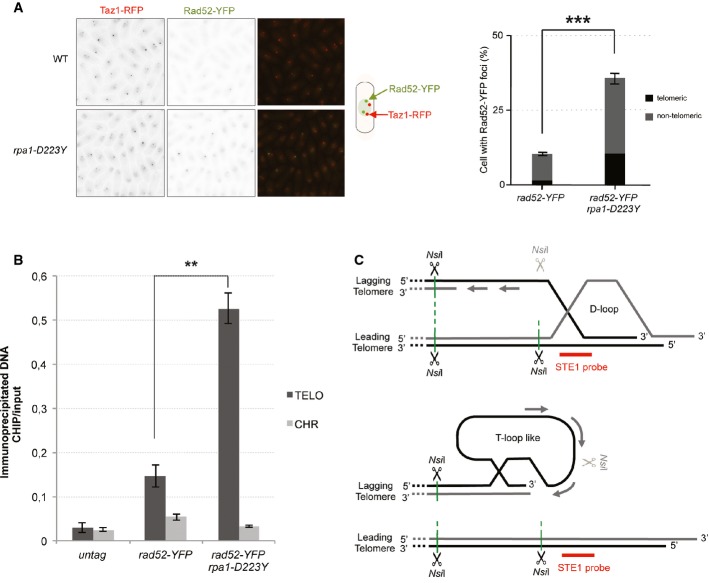
The number of Rad52-YFP foci was analyzed in cells expressing Taz1-RFP. Data are the mean of three independent experiments with n > 300 cells.
Enrichment of Rad52-YFP at telomeres in WT and rpa1-D223Y asynchronous cells. ChIPs were performed with an anti-GFP antibody. The immunoprecipitated DNA was analyzed by quantitative PCR with telomeric primers and chromosome-specific primers (listed in Supplementary Table S2). The ratio of bound DNA over input DNA is represented. Data are the mean of three independent experiments.
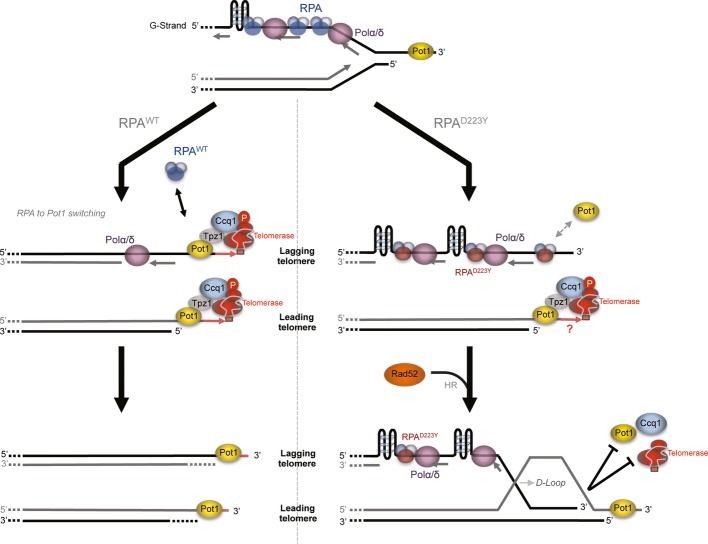
Model representing Rad52-dependent DNA structures that may arise at telomeres as a consequence of lagging-strand replication defects. NsiI sites within ssDNA might become insensitive to the NsiI cut thereby generating larger DNA fragments that result from a cut at a distal NsiI site.
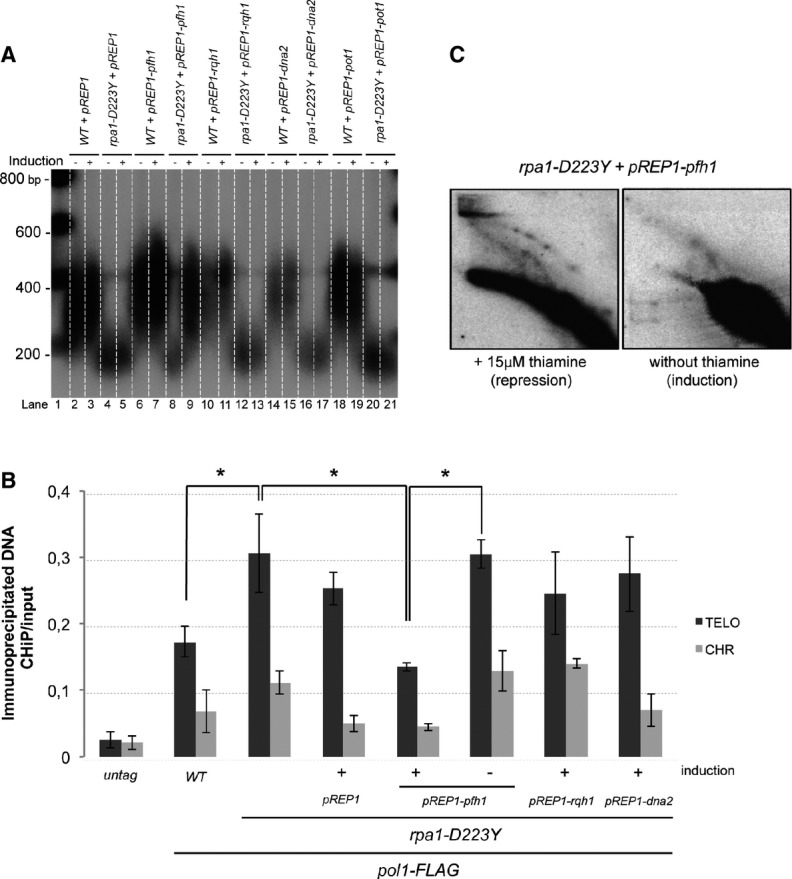
Telomere length of strains overexpressing Pot1, Rqh1, spDNA2, or Pfh1 was analyzed by Southern hybridization. The three helicase genes are under the control of the nmt1 promoter in pREP1 plasmid. Cells were grown in minimum medium ± 15 μM of thiamine. Genomic DNAs were digested by ApaI and hybridized with a telomeric probe (see Materials and Methods).
ChIP experiments of FLAG-tagged Pol1 (Polα) in asynchronous cells overexpressing Rqh1, Dna2, or Pfh1Pif1 helicases. Immunoprecipitated DNAs were analyzed by quantitative PCR with either telomeric or chromosomic primers (see Supplementary Table S2). The ratio of bound DNA over input DNA is represented. Data are the mean of three independent experiments. Error bars indicate standard deviation. P-values are from the Fisher’s LSD test. *P < 0.05.
2D-gel analysis of NsiI telomeric fragments of rpa1-D223Y strain containing the pREP1-pfh1 plasmid in the presence (repression) or absence (induction) of thiamine. The heterologous expression of the Pfh1 helicase suppresses the formation of the T-arc and the T-hmwS.
Telomere length of strains overexpressing Rrm3 and scPif1. Genomic DNAs digested by ApaI were analyzed by Southern hybridization. RRM3 and scPIF1 under the control of nmt1 promoter were induced by removing thiamine from the minimum medium.
2D-gel analysis of NsiI telomeric fragments in a strain expressing scPif1 at basal level (see legend of Fig1). nmt1-pif1-GFP and nmt1-pif1-GFP rpa1-D223Y cells were grown in YES medium under conditions in which the nmt1 promoter is not induced.
ChiP experiments of FLAG-tagged Pol1 (Polα) at telomeres in asynchronous cells expressing scPif1 at basal level. The immunoprecipitated DNA was analyzed by quantitative PCR with telomeric and chromosomic primers and represented as in Fig2A. Data are the mean of three independent experiments. Error bars indicate standard deviation. P-values are from the Fisher’s LSD test. *P < 0.05.
Telomere length of strains overexpressing hPIF1. hPIF1 is under the control of nmt1 promoter in pREP2 plasmid. Cells were grown in minimum medium ± 15 μM of thiamine. Genomic DNAs were digested by EcoRI and analyzed by Southern hybridization.
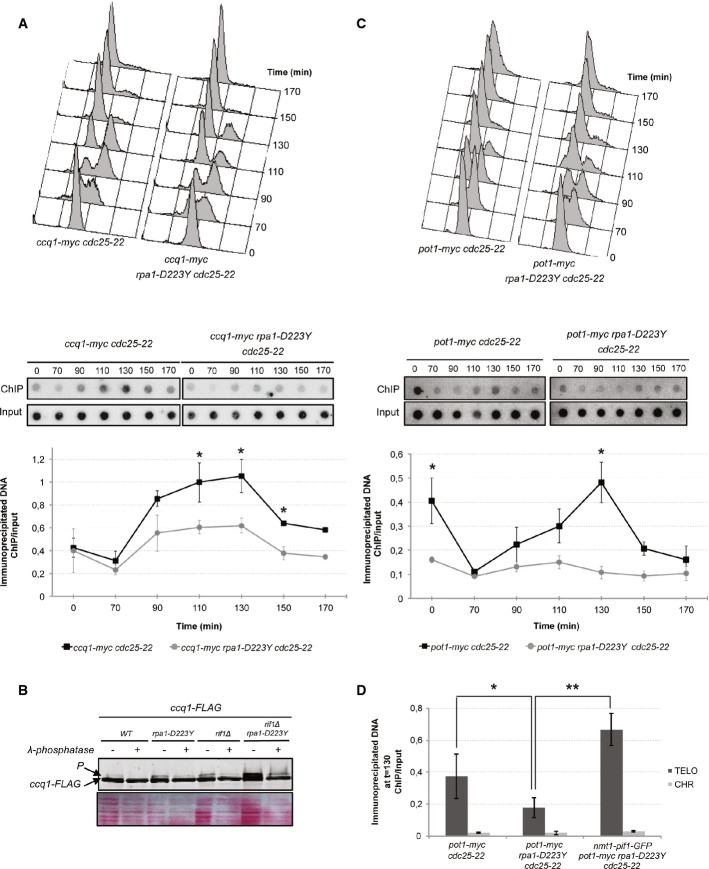
Upper panel, FACS analysis of ccq1-myc cdc25-22 and rap1-D223Y ccq1-myc cdc25-22 strains. Cells were grown as previously described in Fig2B. Lower panel, ChIP of Ccq1-myc was performed with anti-myc 9E10 antibodies. Immunoprecipitated DNA was spotted onto Hybond-N+ membrane and hybridized with a telomeric probe. Signals were quantified with “Image Gauge” software. ChIP over input signals are plotted.
Levels of FLAG-tagged Ccq1 in rpa1-WT and rpa1-D223Y cells in WT or rif1Δ genetic background. Cell lysates were treated with phosphatase inhibitors or with λ-phosphatase as indicated. Ponceau-S staining of the membrane was used as a loading control.
Same as (A) for pot1-myc cdc25-22 and rap1-D223Y pot1-myc cdc25-22 strains.
ChIP of Pot1-myc in synchronized cells at 130 min when the binding of Pot1 at telomeres reaches its maximum. The expression of scPif1 at its basal level restores the defect of Pot1 binding in rpa1-D223Y mutant. Immunoprecipitated DNAs were analyzed by quantitative PCR with either telomeric or chromosomic primers. The ratio of bound DNA over input DNA is represented.
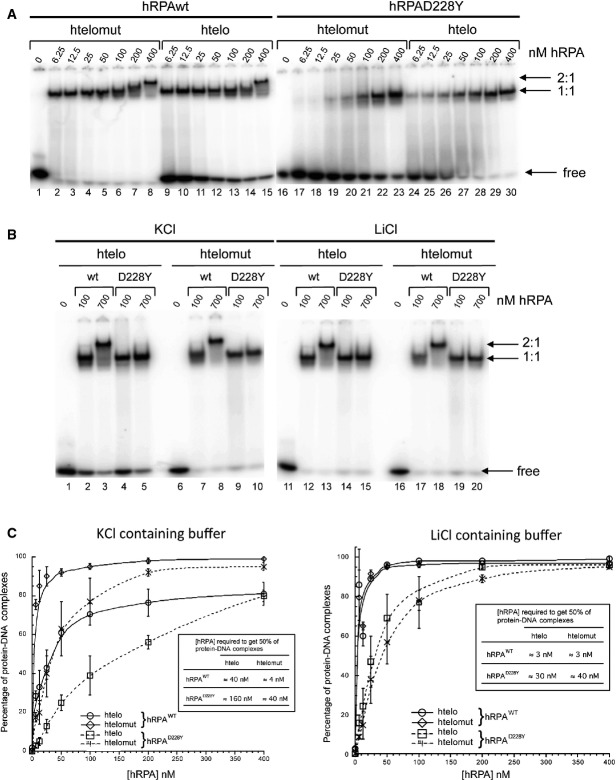
Radiolabeled htelo [(GGGTTA)3GGG] and htelomut (GGCTTACGGTTAGCGTTACGG) (2 nM) were incubated with various amounts of hRPA or hRPAD228Y and the mixture separated by electrophoresis on a 5% acrylamide gel.
700 nM of hRPAD228Y did not allow the formation of 2:1 hRPA:DNA complexes, independently of the nature of the ssDNA (htelo or htelomut) and the monovalent cation (K+ or Li+).
Quantification of the binding of hRPA or hRPAD228Y to ssDNA in KCl (left panel) and LiCl (right panel) containing buffer. The percentage of hRPA:DNA complexes corresponds to the ratio of bound DNA/total DNA (free and bound DNA). Error bars correspond to the standard deviation from three independent experiments. Insert table: concentration of hRPA required to form 50% of hRPA:DNA complex.
References
-
- Bochkarev A, Pfuetzner RA, Edwards AM, Frappier L. Structure of the single-stranded-DNA-binding domain of replication protein A bound to DNA. Nature. 1997;385:176–181. - PubMed
Publication types
MeSH terms
Substances
Grants and funding
LinkOut - more resources
Full Text Sources
Other Literature Sources
Molecular Biology Databases
Research Materials
