

Long-Range HIV Genotyping Using Viral RNA and Proviral DNA for Analysis of HIV Drug Resistance and HIV Clustering
- PMID: 26041893
- PMCID: PMC4508442
- DOI: 10.1128/JCM.00756-15
Long-Range HIV Genotyping Using Viral RNA and Proviral DNA for Analysis of HIV Drug Resistance and HIV Clustering
Erratum in
-
Correction for Novitsky et al., Long-Range HIV Genotyping Using Viral RNA and Proviral DNA for Analysis of HIV Drug Resistance and HIV Clustering.J Clin Microbiol. 2016 Apr;54(4):1175. doi: 10.1128/JCM.00190-16. J Clin Microbiol. 2016. PMID: 27016593 Free PMC article. No abstract available.
Abstract
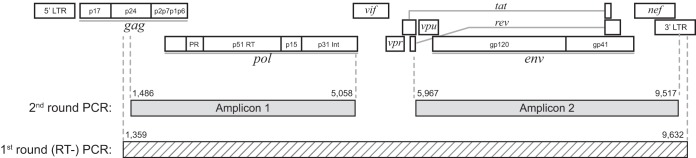
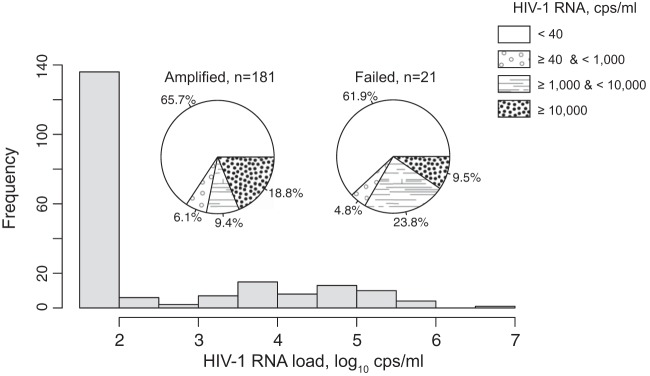
The goal of the study was to improve the methodology of HIV genotyping for analysis of HIV drug resistance and HIV clustering. Using the protocol of Gall et al. (A. Gall, B. Ferns, C. Morris, S. Watson, M. Cotten, M. Robinson, N. Berry, D. Pillay, and P. Kellam, J Clin Microbiol 50:3838-3844, 2012, doi:10.1128/JCM.01516-12), we developed a robust methodology for amplification of two large fragments of viral genome covering about 80% of the unique HIV-1 genome sequence. Importantly, this method can be applied to both viral RNA and proviral DNA amplification templates, allowing genotyping in HIV-infected subjects with suppressed viral loads (e.g., subjects on antiretroviral therapy [ART]). The two amplicons cover critical regions across the HIV-1 genome (including pol and env), allowing analysis of mutations associated with resistance to protease inhibitors, reverse transcriptase inhibitors (nucleoside reverse transcriptase inhibitors [NRTIs] and nonnucleoside reverse transcriptase inhibitors [NNRTIs]), integrase strand transfer inhibitors, and virus entry inhibitors. The two amplicons generated span 7,124 bp, providing substantial sequence length and numbers of informative sites for comprehensive phylogenic analysis and greater refinement of viral linkage analyses in HIV prevention studies. The long-range HIV genotyping from proviral DNA was successful in about 90% of 212 targeted blood specimens collected in a cohort where the majority of patients had suppressed viral loads, including 65% of patients with undetectable levels of HIV-1 RNA loads. The generated amplicons could be sequenced by different methods, such as population Sanger sequencing, single-genome sequencing, or next-generation ultradeep sequencing. The developed method is cost-effective-the cost of the long-range HIV genotyping is under $140 per subject (by Sanger sequencing)-and has the potential to enable the scale up of public health HIV prevention interventions.
Copyright © 2015, American Society for Microbiology. All Rights Reserved.
Figures
References
-
- Bennett DE, Camacho RJ, Otelea D, Kuritzkes DR, Fleury H, Kiuchi M, Heneine W, Kantor R, Jordan MR, Schapiro JM, Vandamme AM, Sandstrom P, Boucher CA, van de Vijver D, Rhee SY, Liu TF, Pillay D, Shafer RW. 2009. Drug resistance mutations for surveillance of transmitted HIV-1 drug-resistance: 2009 update. PLoS One 4:e4724. doi:10.1371/journal.pone.0004724. - DOI - PMC - PubMed
-
- Ssemwanga D, Lihana RW, Ugoji C, Abimiku A, Nkengasong J, Dakum P, Ndembi N. 2015. Update on HIV-1 acquired and transmitted drug resistance in Africa. AIDS Rev 17:3–20. - PubMed
Publication types
MeSH terms
Substances
Grants and funding
LinkOut - more resources
Full Text Sources
Medical
Molecular Biology Databases
