. 2015 Jun 5;64(21):583-90.

Influenza activity - United States, 2014-15 season and composition of the 2015-16 influenza vaccine

Influenza activity - United States, 2014-15 season and composition of the 2015-16 influenza vaccine

Grace D Appiah et al. MMWR Morb Mortal Wkly Rep. .

Abstract

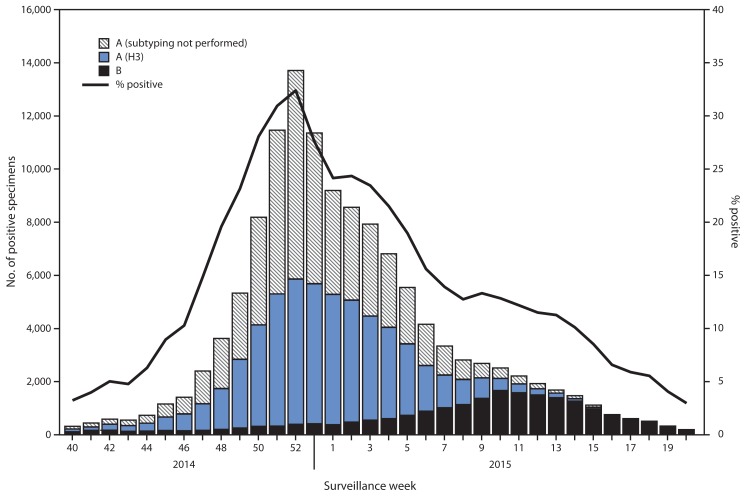
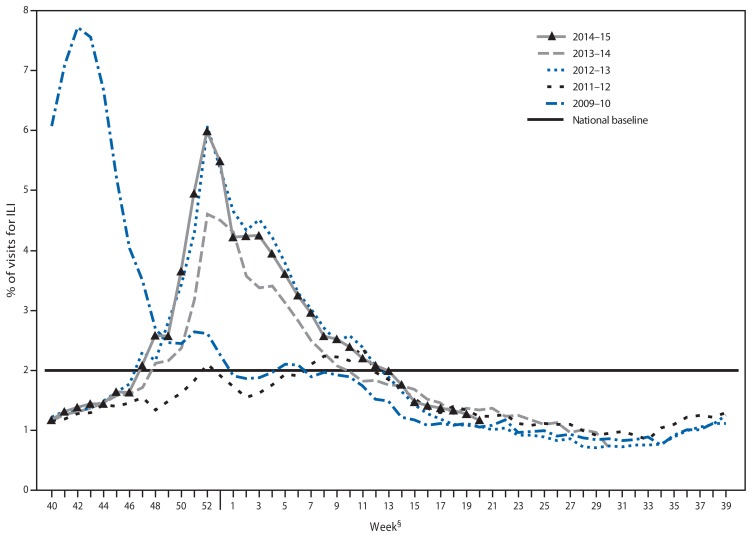
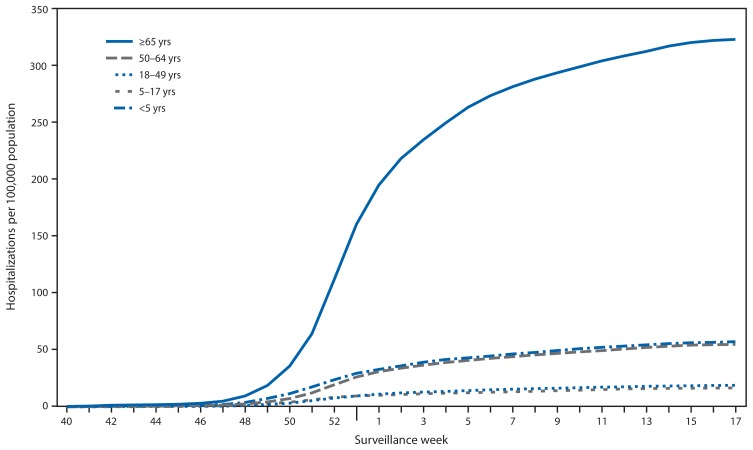
During the 2014-15 influenza season in the United States, influenza activity increased through late November and December before peaking in late December. Influenza A (H3N2) viruses predominated, and the prevalence of influenza B viruses increased late in the season. This influenza season, similar to previous influenza A (H3N2)-predominant seasons, was moderately severe with overall high levels of outpatient illness and influenza-associated hospitalization, especially for adults aged ≥65 years. The majority of circulating influenza A (H3N2) viruses were different from the influenza A (H3N2) component of the 2014-15 Northern Hemisphere seasonal vaccines, and the predominance of these drifted viruses resulted in reduced vaccine effectiveness. This report summarizes influenza activity in the United States during the 2014-15 influenza season (September 28, 2014-May 23, 2015) and reports the recommendations for the components of the 2015-16 Northern Hemisphere influenza vaccine.


Figures

FIGURE 1
FIGURE 1
Number* and percentage of respiratory specimens testing positive for influenza reported by World Health Organization and National Respiratory and Enteric Virus Surveillance System collaborating laboratories, by type, subtype, and surveillance week — United States, 2014–15 influenza season * N = 125,462. Data as of May 23, 2015.
FIGURE 2
FIGURE 2
Percentage of visits for influenza-like illness (ILI)* reported to CDC, by surveillance week — Outpatient Influenza-Like Illness Surveillance Network, United States, 2014–15 influenza season and selected previous influenza seasons * Defined as a fever (≥100.0°F [≥37.8°C]), oral or equivalent, and cough and/or sore throat, without a known cause other than influenza. Data as of May 23, 2015. § Because there was no week 53 in the previous influenza seasons displayed, the week 53 data point for those seasons is an average of percentages from weeks 52 and 1.
FIGURE 3
FIGURE 3
Cumulative rates of hospitalization for laboratory-confirmed influenza, by age group and surveillance week — FluSurv-NET,* United States, 2014–15 influenza season * FluSurv-NET conducts population-based surveillance for laboratory-confirmed influenza-associated hospitalizations in children aged <18 years (since the 2003–04 influenza season) and adults aged ≥18 years (since the 2005–06 influenza season). FluSurv-NET covers approximately 80 counties in the 10 Emerging Infections Program states (California, Colorado, Connecticut, Georgia, Maryland, Minnesota, New Mexico, New York, Oregon, and Tennessee) and three additional Influenza Hospitalization Surveillance Project states (Michigan, Ohio, and Utah). Data as of May 23, 2015.
FIGURE 4
FIGURE 4
Percentage of all deaths attributable to pneumonia and influenza (P&I), by surveillance week and year* — 122 Cities Mortality Reporting System, United States, 2010–2015 * Data as of May 23, 2015.

References

    1. Flannery B, Clippard J, Zimmerman RK, et al. Early estimates of seasonal influenza vaccine effectiveness—United States, January 2015. MMWR Morb Mortal Wkly Rep. 2015;64:10–5. - PMC - PubMed
    1. Food and Drug Administration. March 4, 2015: Vaccines and Related Biological Products Advisory Committee meeting summary minutes. Silver Spring, MD: Food and Drug Administration; 2015. Available at http://www.fda.gov/downloads/AdvisoryCommittees/CommitteesMeetingMateria....
    1. CDC. FluView interactive. Available at http://www.cdc.gov/flu/weekly/fluviewinteractive.htm.
    1. Thompson WW, Shay DK, Weintraub E, et al. Influenza-associated hospitalizations in the United States. JAMA. 2004;292:1333–40. - PubMed
    1. CDC. Estimates of deaths associated with seasonal influenza—United States, 1976–2007. MMWR Morb Mortal Wkly Rep. 2010;59:1057–62. - PubMed

MeSH terms

Substances