. 2015 Jun 5:5:9608.
doi: 10.1038/srep09608.

Defective pollen wall contributes to male sterility in the male sterile line 1355A of cotton

Affiliations

Defective pollen wall contributes to male sterility in the male sterile line 1355A of cotton

Yuanlong Wu et al. Sci Rep. .

Abstract

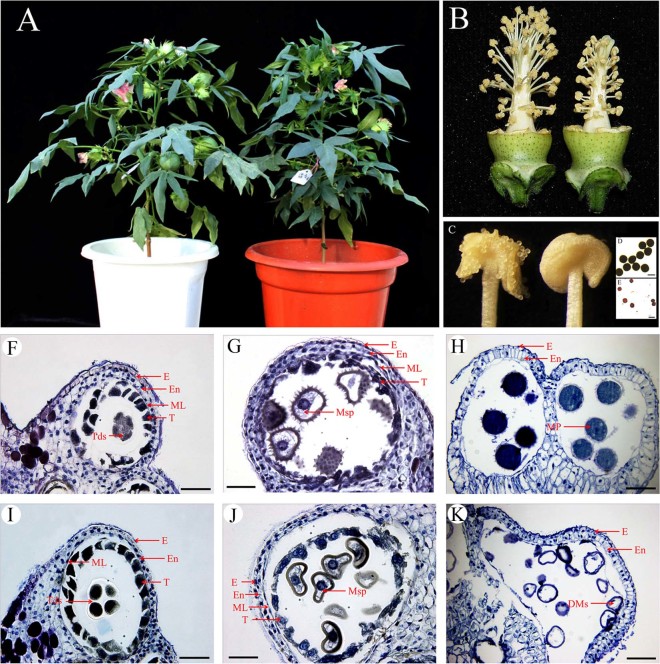
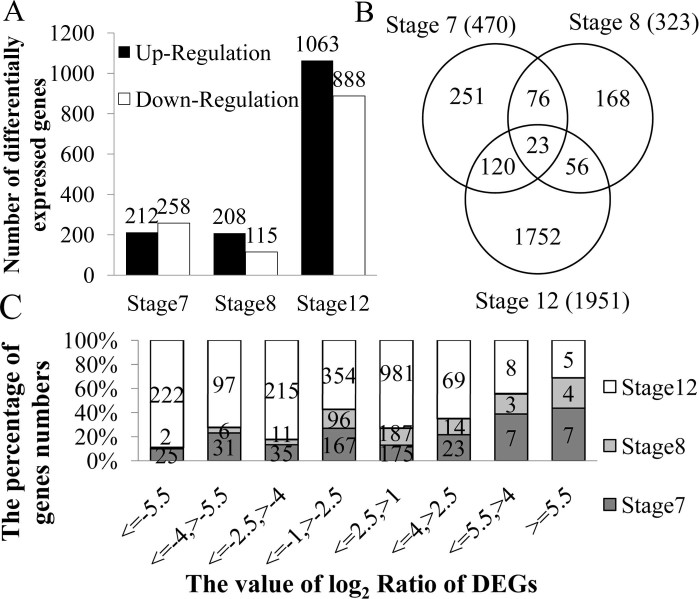
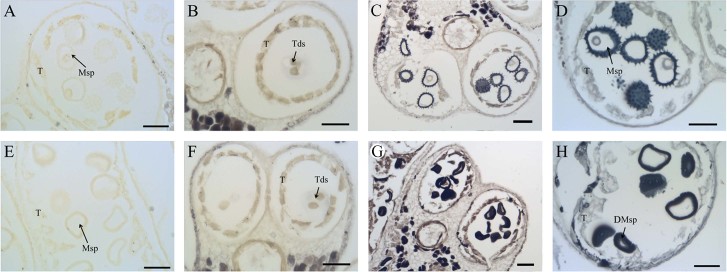
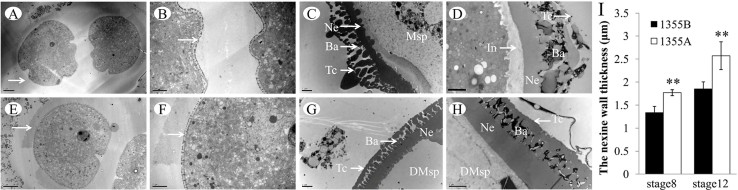
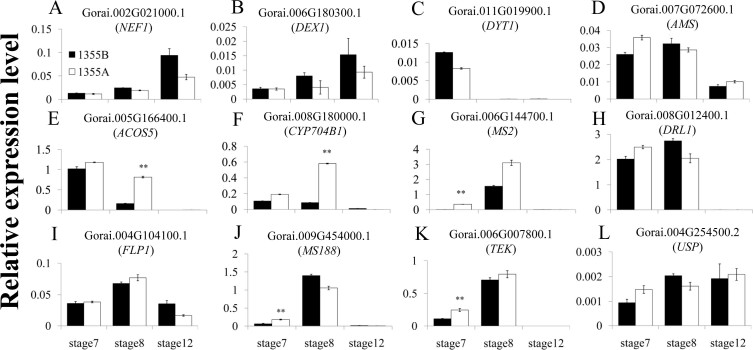
To understand the mechanisms of male sterility in cotton (Gossypium spp.), combined histological, biochemical and transcription analysis using RNA-Seq was carried out in the anther of the single-gene recessive genic male sterility system of male sterile line 1355A and male fertile line 1355B, which are near-isogenic lines (NILs) differing only in the fertility trait. A total of 2,446 differentially expressed genes were identified between the anthers of 1355AB lines, at three different stages of development. Cluster analysis and functional assignment of differentially expressed genes revealed differences in transcription associated with pollen wall and anther development, including the metabolism of fatty acids, glucose, pectin and cellulose. Histological and biochemical analysis revealed that a major cellular defect in the 1355A was a thicker nexine, consistent with the RNA-seq data, and further gene expression studies implicated differences in fatty acids synthesis and metabolism. This study provides insight into the phenotypic characteristics and gene regulatory network of the genic male sterile line 1355A in upland cotton.


Figures

Figure 1
Figure 1. Phenotypic comparison between the 1355B and the 1355A lines.
(A) A 1355B plant (left) and a 1355A plant (right) at full-bloom stage. (B) A 1355B flower (left) and a 1355A flower (right), with petals removed. (C) In a 1355B anther (left), dehiscence is normal; while in a 1355A anther (right), dehiscence is abnormal. (D) 1355B pollen grains stained with 1% I2-KI solution at stage 12 showing mature pollen grains that are dyed black. (E) 1355A pollen grains stained with 1% I2-KI solution at stage 12 showing mature pollen grains that are not dyed black. (F–K) Locules from the anther section of the 1355B (F–H) and 1355A (I–K) plants during stage 7, stage 8 and stage 12. (F) and (I) stage 7. (G) and (J) stage8. (H) and (K) stage 12. There are no differences between the 1355B (F) and 1355A (I) plants at stage 7. Compared to those of the 1355B plant (G), the spines could not be identified on the surface of pollen in the 1355A plant (J). The microspore cytoplasm was stained deeply in the 1355B plants (H), but the microspores aborted in 1355A plants (K). E, epidermis; En, endothecium; ML, middle layer; T, tapetal layer; Mp, mature pollen; DMs, degenerated microspores; Msp, microspores and Tds, tetrads. Bars, 100 μm in (D) and (E); Bars, 50 μm in (F) to (K). Acknowledge the authors Yuanlong Wu and Li Yang for photographing (A), Yuanlong Wu for photographing (B), (D) and (E), and Zancheng Wu for photographing (C) and (F) to (K).
Figure 2
Figure 2. The statistical analysis of differentially expressed genes in the 1355A plants compared to those of the 1355B plants.
(A) Number of differentially expressed genes that were up- or down-regulated during analyzed stages. (B) Showing the relationship of differentially expressed genes in three pollen development stages using a Venn diagram. The overlapping regions indicate the number of DEGs that are present in more than one stage, and the central region corresponds to the expressed genes that are present in all three of the stages. (C) The distribution of the value log2 Ratio of the DEGs in the 1355A plants compared to the 1355B plants.
Figure 3
Figure 3. Sudan Black B staining of anthers of the 1355B and1355A plants.
The black staining signals indicate the lipid accumulation. (A) and (E) The non-stained anthers of the 1355B (A) and 1355A (E) plants at stage 8 are the negative signals. (B) and (F) The stained anthers of the 1355B (B) and 1355A (F) plants at stage 7. (C) and (G) The stained anthers of the 1355B (C) and 1355A (G) plants at stage 8. (D) and (H) The stained anthers of the 1355B (D) and 1355A (H) plants at stage 9. T, tapetal layer; Tds, tetrads; Msp, microspores; DMsp, degenerated microspores; Bars = 50 μm.
Figure 4
Figure 4. TEMS of pollen walls from the 1355B and 1355A plants.
(A) and (E) Anthers of the 1355B (A) and 1355A (E) plants at stage 7 showing tetrads. The white arrows indicate the callose wall of the tetrads. (B) and (F) The higher magnification of (A) and (E) respectively. The white arrows indicate primexine and probacula formation. (C) and (G) Pollen wall of the 1355B (C) and 1355A (G) plants at stage 8 exhibiting early uninuclear microspores. (D) and (H) Pollen wall of the 1355B (D) and 1355A (H) plants at stage 12 exhibiting mature microspores. (I) The nexine wall thickness at stages 8 and 12. Msp, microspores; DMsp, degenerated microspores; In, intine; Ne, nexine; Ba, bacula; Te, tectum. The error bars represent SD (student's t test, ** p < 0.01, p = 5.34E-07 at stage 8, p = 1.39E-05 at stage 12). Bars, 5 μm in (A) and (E); Bars, 2 μm in (B) to (D), and (F) to (H).
Figure 5
Figure 5. The expression pattern of homologous genes in pollen development.
(A) and (B) The primexine formation genes. (C) and (D) The tapetum development genes. (E) to (I) The sporopollenin synthesis-related genes. (J) The sexine formation genes. (K) The nexine formation gene. (L) The intine synthesis gene. The white and black columns refer to the 1355A male sterile line and 1355B male fertile line, respectively. The error bars represent SD (student's t test, ** p < 0.01 and absolute value of log2 Ratio ≥ 1, p = 8.06E-07 in (E), p = 8.16E-09 in (F), p = 1.73E-05 in (G), p = 3.34E-04 in (J) and p = 5.64E-04 in (K)). Three biological replicates were performed.

References

    1. Tang W. Study on morphological, cytological and biochemical characteristics in anthers of recessive genetic sterile line of upland cotton (Gossypium hirsutum L.). Master degree thesis, Sichuan Agricultural University, Ya an, (2008).
    1. Wang G., Guo X. & Zhang X. Sterile stability of four genetic male sterile lines and genetic male sterile gene localization in 1355A. Journal of Huazhong Agricultural University 25, 351–354 (2006).
    1. Wei M., Song M., Fan S. & Yu S. Transcriptomic analysis of differentially expressed genes during anther development in genetic male sterile and wild type cotton by digital gene-expression profiling. BMC Genomics 14, 97 (2013). - PMC - PubMed
    1. Wiermann R., Ahlers F. & Schmitz-Thom I. [Sporopollenin]. Biopolymers Vol. 1 [Stenbuchel A., & Hofrichter M., eds. (eds.)] [209–227] (Wiley-VCH Verlag, Weinheim, 2001).
    1. Ahlers F., Thom I., Lambert J., Kuckuk R. & Rolf W. 1H NMR analysis of sporopollenin from Typha Angustifolia. Phytochemistry 50, 1095–1098 (1999).

Publication types