. 2015 Jun 26;348(6242):1488-92.
doi: 10.1126/science.aab3021. Epub 2015 Jun 4.

GENE REGULATION. Discrete functions of nuclear receptor Rev-erbα couple metabolism to the clock

Affiliations

GENE REGULATION. Discrete functions of nuclear receptor Rev-erbα couple metabolism to the clock

Yuxiang Zhang et al. Science. .

Abstract

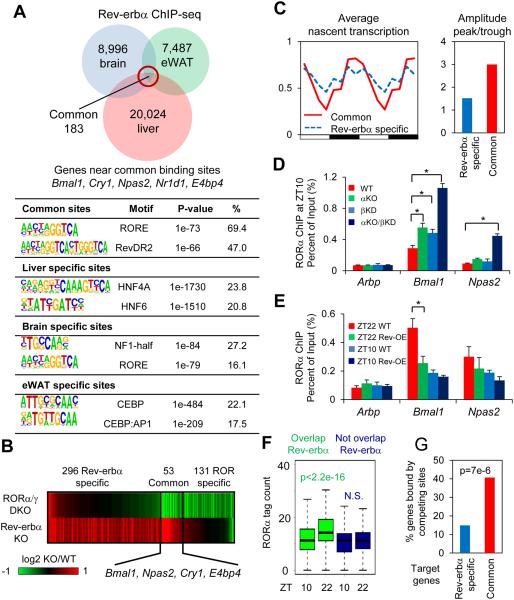
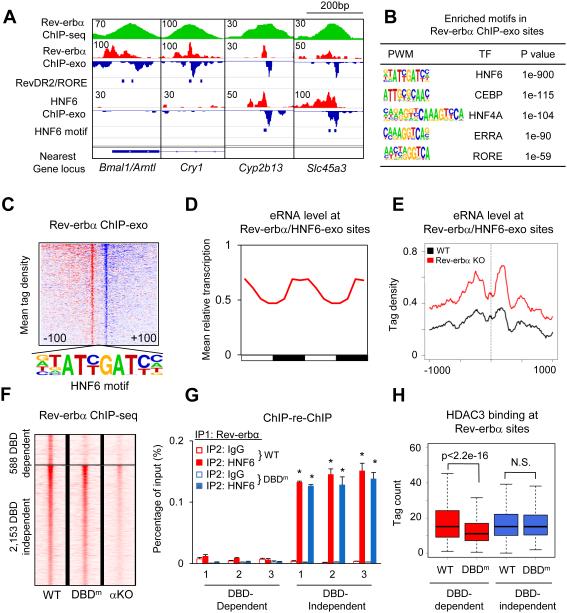
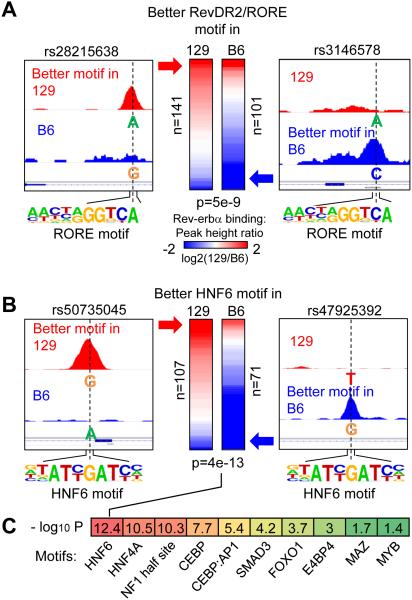
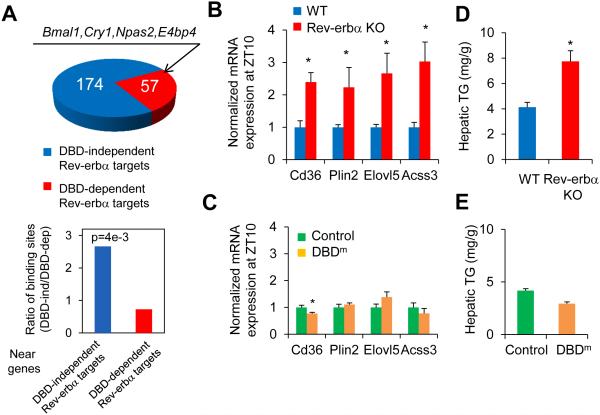
Circadian and metabolic physiology are intricately intertwined, as illustrated by Rev-erbα, a transcription factor (TF) that functions both as a core repressive component of the cell-autonomous clock and as a regulator of metabolic genes. Here, we show that Rev-erbα modulates the clock and metabolism by different genomic mechanisms. Clock control requires Rev-erbα to bind directly to the genome at its cognate sites, where it competes with activating ROR TFs. By contrast, Rev-erbα regulates metabolic genes primarily by recruiting the HDAC3 co-repressor to sites to which it is tethered by cell type-specific transcription factors. Thus, direct competition between Rev-erbα and ROR TFs provides a universal mechanism for self-sustained control of the molecular clock across all tissues, whereas Rev-erbα uses lineage-determining factors to convey a tissue-specific epigenomic rhythm that regulates metabolism tailored to the specific need of that tissue.


Figures

Figure 1
Figure 1. Rev-erbα represses clock genes by competing with RORα at its cognate sites
(A) Overlap of Rev-erbα cistromes in liver (), brain and epididymal adipose tissue (eWAT). Most significantly enriched known motifs (abundance>10%) in common and tissue specific cistromes are shown. (B) Heat map showing expression fold changes of genes deactivated by RORα/γ double KO (DKO/WT< −1.3, p<0.01) and derepressed by Rev-erbα KO (αKO/WT>1.3, p<0.01). (C) Mean relative GRO-seq transcription (left) throughout 24-hour light dark cycle, as well as oscillation amplitudes (right) of RORs/Rev-erbα common targets (red) and Rev-erbα specific targets (blue). Time points were duplicated for clearer visualization. (D) RORα binding at clock and control genes promoters at ZT10, in wild type (WT), Rev-erbα KO (αKO), Rev-erbβ knockdown (βKD), and αKO/βKD mice liver, interrogated by ChIP-PCR. Data are expressed as mean± SEM (* Student’s t-test, p<0.05, n=4). (E) RORα binding at clock and control genes promoters at ZT10 or ZT22 in Rev-erbα overexpression (OE) mouse liver, interrogated by ChIP-PCR. Data are expressed as mean± SEM (* Student’s t-test, p<0.05, n=6 or 7). (F) Circadian binding of RORα at sites overlapped or not overlapped with Rev-erbα cistrome (N.S. Student’s t-test, p>0.05). (G) Percentage of common or Rev-erbα specific target genes containing high confidence oscillating RORα binding sites (ZT22>2 reads per million (rpm), ZT22/ZT10>1.5) within 50kb of TSSs (P value from hypergeometric test).
Figure 2
Figure 2. Rev-erbα binds to the genome using both DBD-dependent and DBD-independent mechanism
(A) Genome browser view of Rev-erbα and HNF6 ChIP-exo signals under Rev-erbα ChIP-seq peaks near clock and metabolic genes. Blue bars indicate locations of RevDR2/RORE and HNF6 motif. (B) Highly enriched known motifs found in Rev-erbα ChIP-exo peak pairs 22-26bp apart. (C) Heat map showing 5’-end tag densities of Rev-erbα ChIP-exo centered at HNF6 motifs within 1,108 peak pairs. Red and blue indicate tag density on the plus and minus strand, respectively. (D) Mean relative eRNA transcription () at Rev-erbα/HNF6-exo sites throughout 24-hour light dark cycles. Data were double plotted for clearer visualization. (E) eRNA tag density () centered at Rev-erbα/HNF6-exo sites near Rev-erbα target genes, in Rev-erbα KO and wild type liver. (F) Heat map showing Rev-erbα ChIP-seq tag densities (at ZT10) in wild type, DBD mutant (DBDm), and Rev-erbα KO (αKO) mice, at DBD-dependent and -independent sites identified among 5,792 high confidence Rev-erbα peaks (peak height >1rpm, WT/Rev-erbα KO>3). (G) Sequential ChIP of Rev-erbα followed by either HNF6 or IgG ChIP in wild type and DBDm mouse liver at ZT10. Data are expressed as mean± SEM (* Student’s t-test, p<0.05, n=3 or 4 per group). (H) Binding of HDAC3 at DBD-dependent and -independent sites in WT and DBDm liver (N.S. Student’s t-test, p>0.05).
Figure 3
Figure 3. SNP associated strain-specific occupancy suggests HNF6-mediated binding of Rev-erbα
(A) Heat map showing log2 fold changes of Rev-erbα binding in 129 and B6 mice. The left column in the heat map contains 141 Rev-erbα peaks where RevDR2/RORE motif scores are higher in 129 mice and lower in B6 mice, due to the SNPs (illustrated in the left panel). Similarly, the right column contains 101 SNP-bearing Rev-erbα peaks with better RevDR2/RORE in the B6 genome. P value was calculated using Student’s t-test. (B) Same analysis as in A, focusing on SNPs disrupting HNF6 motif under Rev-erbα peaks. (C) Heat map showing −log10 p values for other motifs that are enriched in DBD-independent Rev-erbα peaks.
Figure 4
Figure 4. DBD-independent Rev-erbα sites regulate metabolic genes in liver
(A) Top panel shows the number of DBD-dependent and -independent Rev-erbα target genes identified using microarrays in Rev-erbα KO () and DBDm mice (). Bar graph shows ratios of DBD-independent and -dependent Rev-erbα/HDAC3 binding sites () located near two groups of Rev-erbα target genes (P value from hypergeometric test). (B) mRNA expression of lipid metabolic genes normalized to Arpp, measured by RT-qPCR, in livers of Rev-erba KO mice and wild type mice at ZT10. (C) mRNA expression of lipid metabolic genes normalized to Arpp, measured by RT-qPCR, in livers of Rev-erbα DBDm (Rev-erbα/β double floxed mice injected with AAV-Tbg-Cre) or control mice (floxed mice injected with AAV-Tbg-GFP) at ZT10. Data are expressed as mean± SEM (* Student’s t-test, p<0.05, n=4 per group). (D) Hepatic triglyceride (TG) levels in the same mice as in B. (E) Hepatic TG levels in mice as in C (* Student’s t-test, p<0.05, n=4 per group).

Comment in

References

    1. Feng D, Lazar MA. Clocks, metabolism, and the epigenome. Mol. Cell. 2012;47:158–167. - PMC - PubMed
    1. Asher G, Sassone-Corsi P. Time for food: The intimate interplay between nutrition, metabolism, and the circadian clock. Cell. 2015;161:84–92. - PubMed
    1. Takahashi JS, Hong HK, Ko CH, McDearmon EL. The genetics of mammalian circadian order and disorder: Implications for physiology and disease. Nat. Rev. Genet. 2008;9:764–775. - PMC - PubMed
    1. Bass J, Takahashi JS. Circadian integration of metabolism and energetics. Science. 2010;330:1349–1354. - PMC - PubMed
    1. Hardin PE, Panda S. Circadian timekeeping and output mechanisms in animals. Curr. Opin. Neurobiol. 2013;23:724–731. - PMC - PubMed

Publication types

MeSH terms

Substances

Associated data