. 2015 May 18;106(20):203701.
doi: 10.1063/1.4921474.

Nonlinear photoacoustic spectroscopy of hemoglobin

Affiliations

Nonlinear photoacoustic spectroscopy of hemoglobin

Amos Danielli et al. Appl Phys Lett. .

Abstract

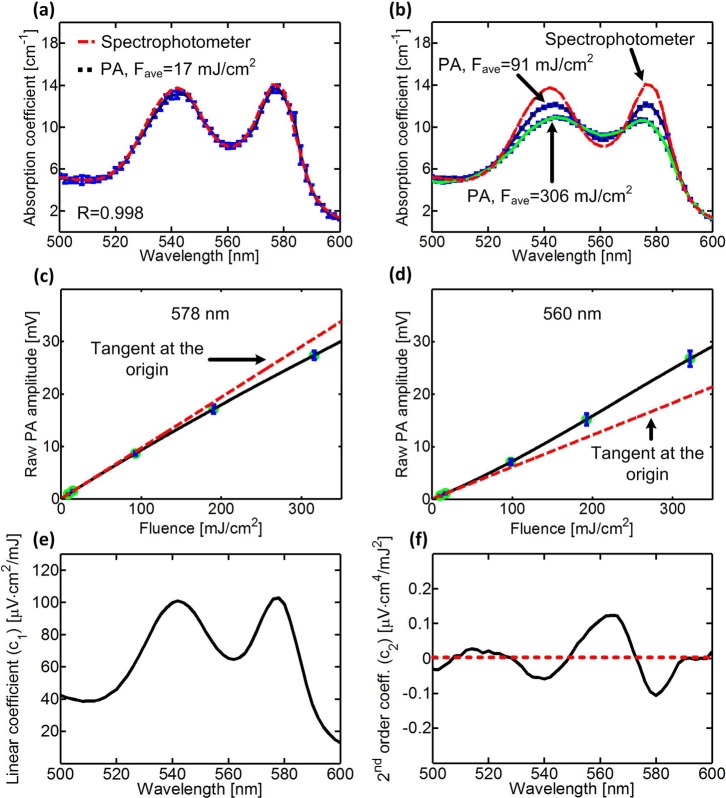
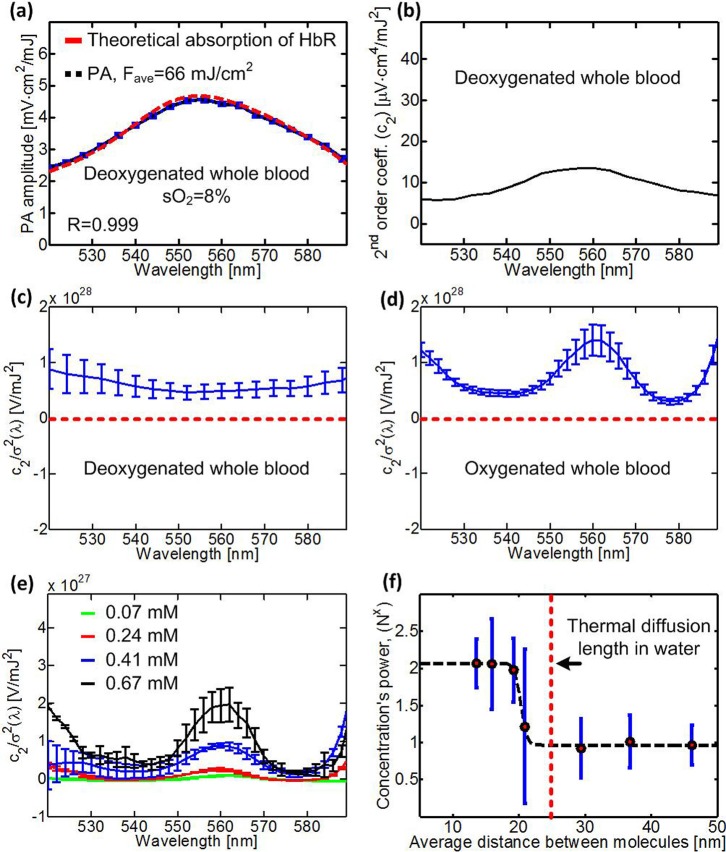
As light intensity increases in photoacoustic imaging, the saturation of optical absorption and the temperature dependence of the thermal expansion coefficient result in a measurable nonlinear dependence of the photoacoustic (PA) signal on the excitation pulse fluence. Here, under controlled conditions, we investigate the intensity-dependent photoacoustic signals from oxygenated and deoxygenated hemoglobin at varied optical wavelengths and molecular concentrations. The wavelength and concentration dependencies of the nonlinear PA spectrum are found to be significantly greater in oxygenated hemoglobin than in deoxygenated hemoglobin. These effects are further influenced by the hemoglobin concentration. These nonlinear phenomena provide insights into applications of photoacoustics, such as measurements of average inter-molecular distances on a nm scale or with a tuned selection of wavelengths, a more accurate quantitative PA tomography.


Figures

FIG. 1.
FIG. 1.
(a) Densely and loosely packed absorbers within the acoustic voxel. (b) A photoacoustic spectrometer with flat-top beam illumination. (c) 2D beam profile.
FIG. 2.
FIG. 2.
(a) and (b) PA amplitude versus laser wavelength in fully oxygenated lysed blood (0.07 mM) at (a) low incident fluence and (b) high incident fluence. The red dashed line is the absorption spectrum, which fits the theoretical absorption of 98% oxygenated hemoglobin, measured by a spectrophotometer (Cary-50, Agilent). (c) and (d) PA amplitude as a function of the incident fluence at (c) 578 nm and (d) 560 nm. Each red dashed line is the tangent of the nonlinear curve at the origin. Error bars represent the standard deviations of ten measurements. (e) and (f) A typical (e) linear coefficient, c1, and (f) 2nd order coefficient, c2, as a function of the laser wavelength. The red dashed line represents c2=0.
FIG. 3.
FIG. 3.
(a) Photoacoustic amplitude versus laser wavelength in deoxygenated whole blood. (b) 2nd order coefficient, c2, versus laser wavelength for deoxygenated whole blood. (c)–(e) c2/σ2(λ) versus laser wavelength for (c) deoxygenated whole blood, (d) oxygenated whole blood, and (e) different concentrations of oxygenated lysed blood. The red dashed line represents c2=0. (f) The concentration's power dependence of c2 at 560 nm as a function of average distance between molecules. The red dashed line represents the thermal diffusion length (26 nm) in water for a 4.9 ns laser pulse width. Error bars in (a) represent the standard deviations of ten measurements. Error bars in (c)–(f) represent the standard errors of 3–4 experiments.

References

    1. Oraevsky A. A., Jacques S. L., and Tittel F. K., “ Measurement of tissue optical properties by time-resolved detection of laser-induced transient stress,” Appl. Opt. 36(1), 402–415 (1997).10.1364/AO.36.000402 - DOI - PubMed
    1. Wang L. V. and Hu S., “ Photoacoustic tomography: In vivo imaging from organelles to organs,” Science 335(6075), 1458–1462 (2012).10.1126/science.1216210 - DOI - PMC - PubMed
    1. Wang X. D., Xie X. Y., Ku G. N., and Wang L. H. V., “ Noninvasive imaging of hemoglobin concentration and oxygenation in the rat brain using high-resolution photoacoustic tomography,” J. Biomed. Opt. 11(2), 024015 (2006). - PubMed
    1. Laufer J., Delpy D., Elwell C., and Beard P., “ Quantitative spatially resolved measurement of tissue chromophore concentrations using photoacoustic spectroscopy: Application to the measurement of blood oxygenation and haemoglobin concentration,” Phys. Med. Biol. 52(1), 141–168 (2007).10.1088/0031-9155/52/1/010 - DOI - PubMed
    1. Zhang H. F., Maslov K., Stoica G., and Wang L. H. V., “ Functional photoacoustic microscopy for high-resolution and noninvasive in vivo imaging,” Nat. Biotechnol. 24(7), 848–851 (2006).10.1038/nbt1220 - DOI - PubMed