. 2015 Jun 4;161(6):1334-44.
doi: 10.1016/j.cell.2015.04.052.

Cyclic Regulation of Sensory Perception by a Female Hormone Alters Behavior

Affiliations

Cyclic Regulation of Sensory Perception by a Female Hormone Alters Behavior

Sandeepa Dey et al. Cell. .

Abstract

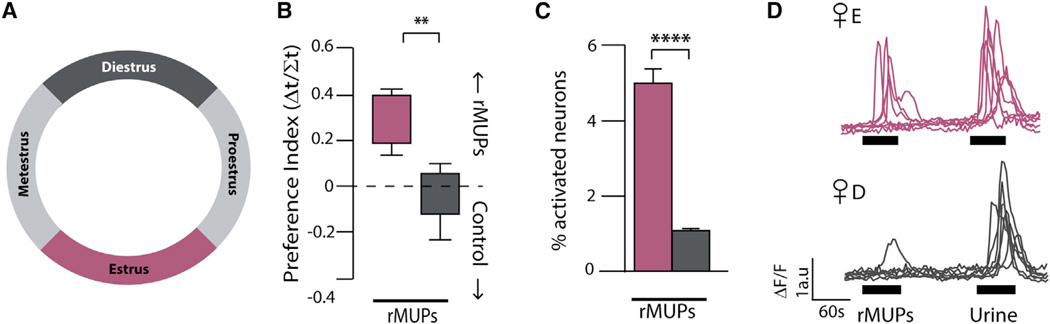
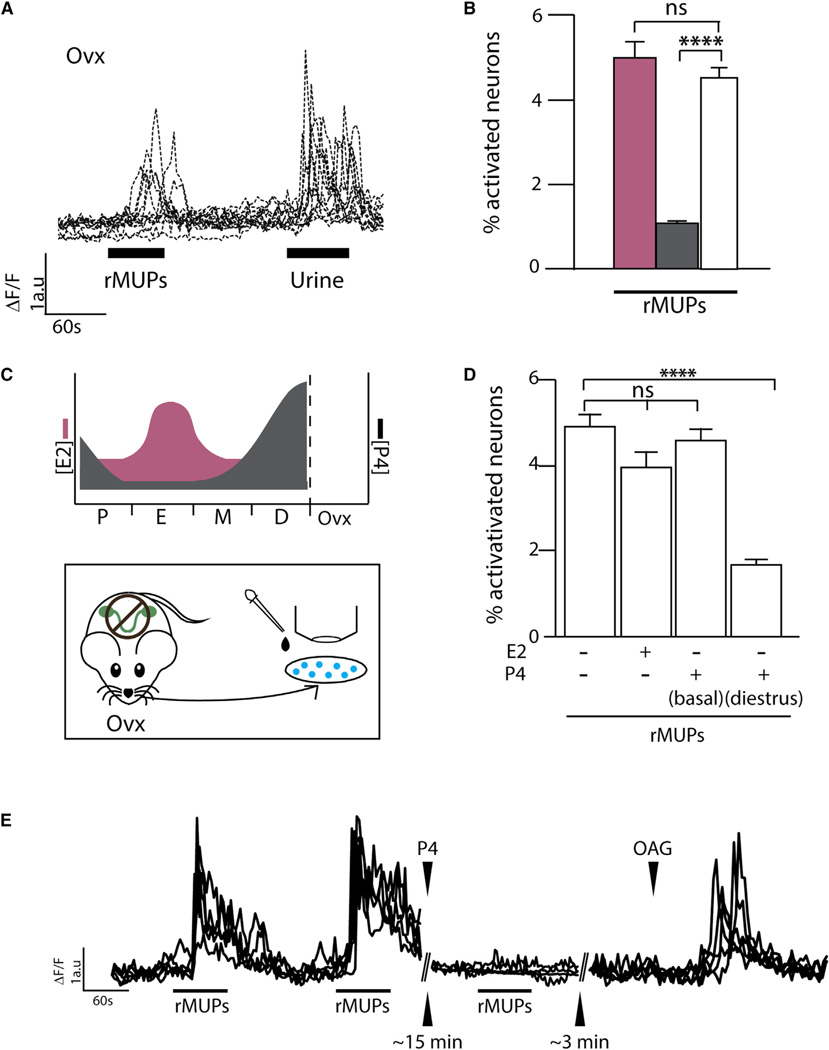
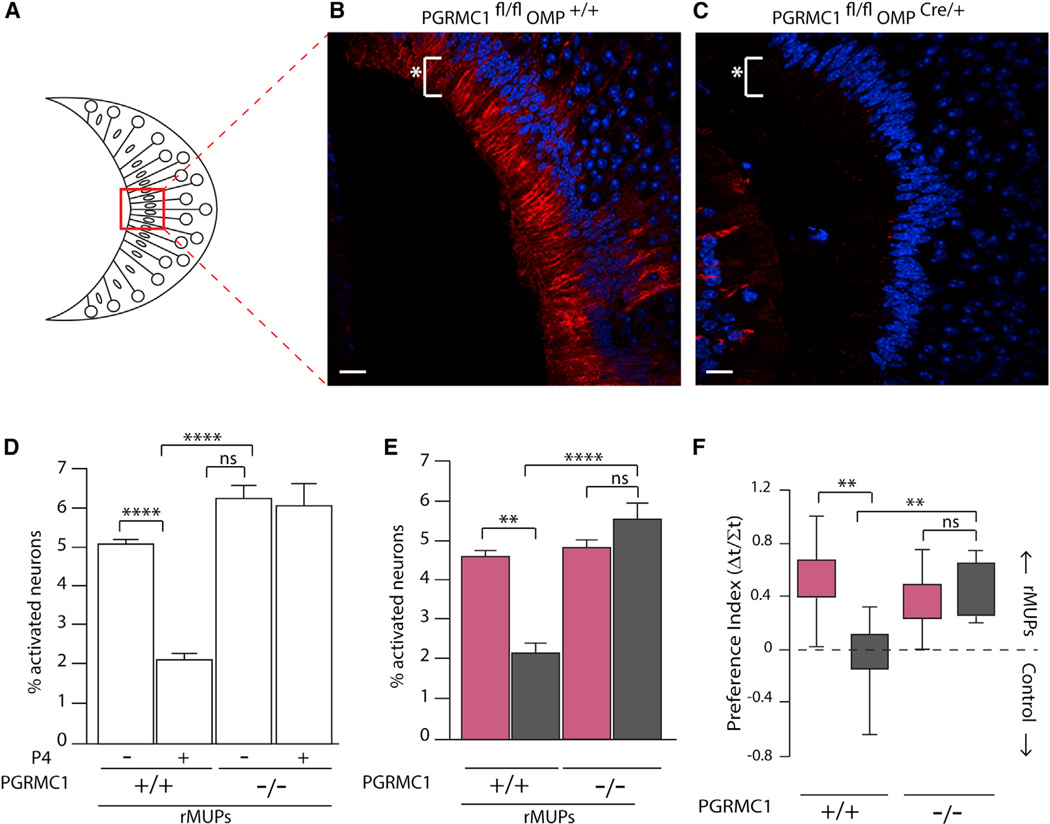
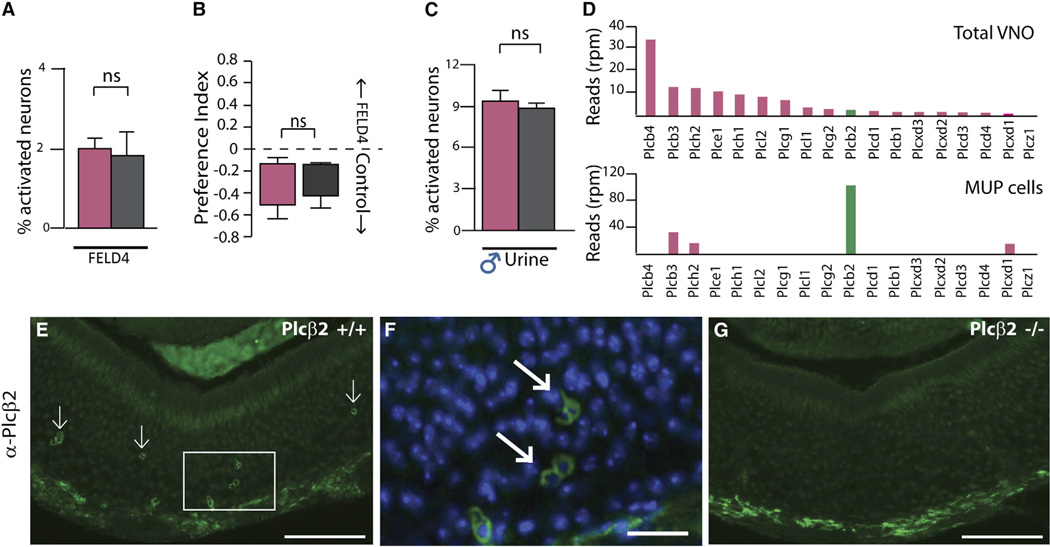
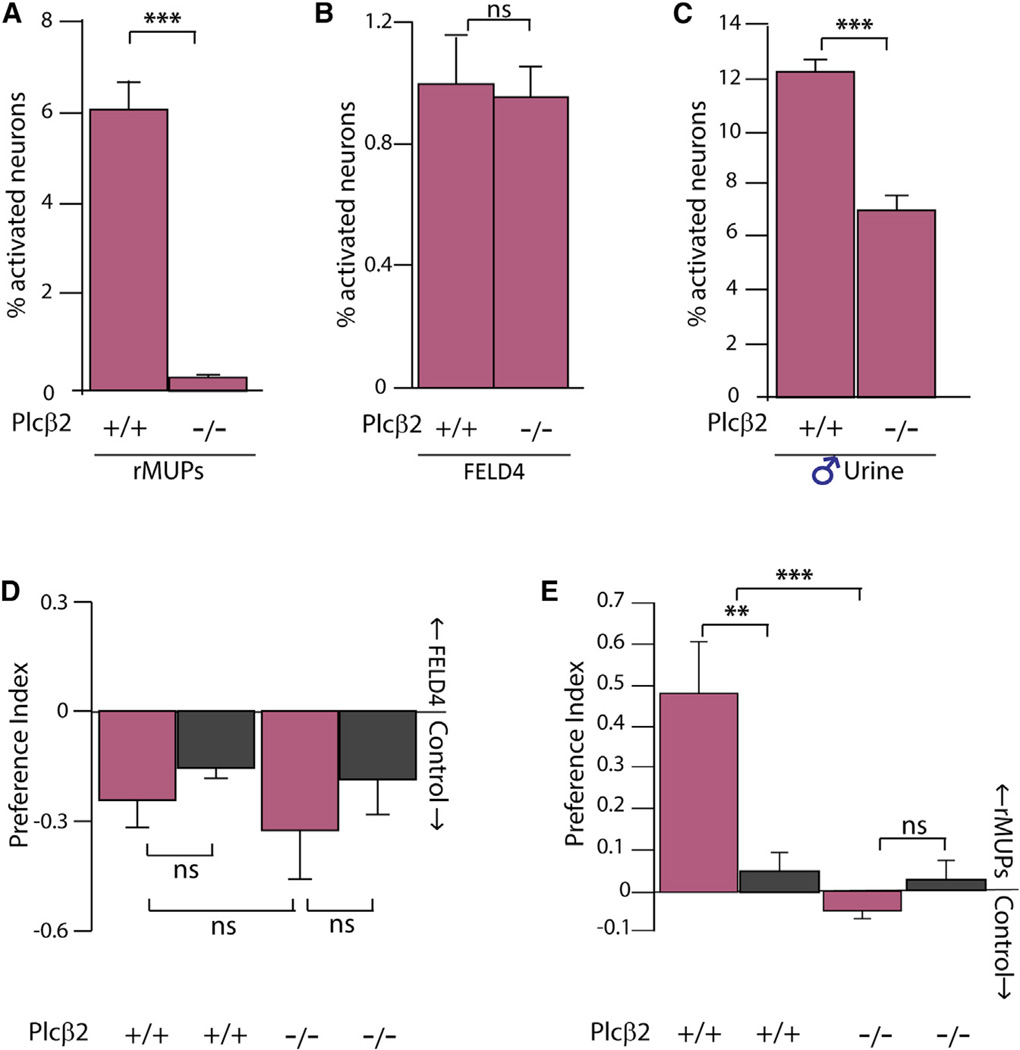
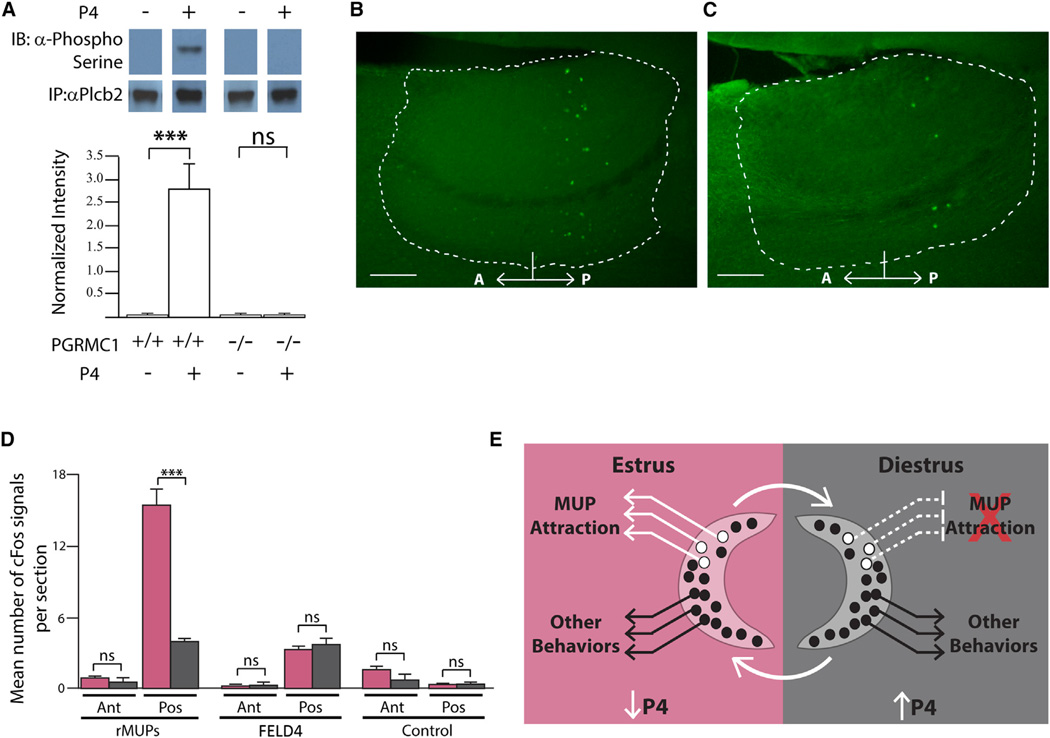
Females may display dramatically different behavior depending on their state of ovulation. This is thought to occur through sex-specific hormones acting on behavioral centers in the brain. Whether incoming sensory activity also differs across the ovulation cycle to alter behavior has not been investigated. Here, we show that female mouse vomeronasal sensory neurons (VSNs) are temporarily and specifically rendered "blind" to a subset of male-emitted pheromone ligands during diestrus yet fully detect and respond to the same ligands during estrus. VSN silencing occurs through the action of the female sex-steroid progesterone. Not all VSNs are targeted for silencing; those detecting cat ligands remain continuously active irrespective of the estrous state. We identify the signaling components that account for the capacity of progesterone to target specific subsets of male-pheromone responsive neurons for inactivation. These findings indicate that internal physiology can selectively and directly modulate sensory input to produce state-specific behavior. PAPERCLIP.


Figures

Figure 1
Figure 1. Female Sensory Response Varies with Estrous State
(A) Schematic representation of estrous cycle, indicating proestrus (light gray), estrus (pink), metestrus (light gray), and diestrus (dark gray). (B) Preference index from two choice behavior assay conducted on estrous- and diestrous-staged females with rMUP stimuli versus biologically non-relevant control odor (p = 0.002; estrus n = 12, diestrus n = 10). (C) Percentage of VSNs from estrous and diestrous females showing calcium influx to rMUPs (p = 2.57 × 10⁻⁵; 2,811 and 2,726 cells imaged, respectively). (D) Overlaid representative calcium influx traces of individual VSNs from estrous and diestrous females in response to stimulation with rMUPs and male urine. (B and C) Two-tailed t test. All values in mean ± SEM. p < 0.05, **p < 0.01, ***p < 0.001, ****p < 0.0001; ns, not significant. Pink bars, estrus; dark gray bars, diestrus. See also Figure S1.
Figure 2
Figure 2. Progesterone Silences Sensory Activity
(A) Overlaid representative calcium influx traces of individual VSNs from ovariectomized (ovx) females in response to stimulation with rMUPs and male urine. (B) Percentage of VSNs from ovx females showing calcium influx to rMUPs compared to estrous- and diestrous-staged females (1,939; 2,811; and 2,726 cells imaged, respectively). (C) Upper panel: representation of estrogen (pink, E2) and progesterone (black, P4) surges in cycling and ovariectomized females (Joshi et al., 2010). Lower panel: experimental design of calcium imaging; acute culture of VSNs from ovx females with the addition of hormones/drugs prior to perfusion of ligand stimuli. (D) Percentage of VSNs from ovx females showing calcium influx to rMUPs alone or with addition of E2 (200 pM) or P4 at basal (5 nM) or diestrus (40 nM) concentrations (3,292; 2,545; 3,286; 2,712 cells imaged, respectively). (E) Overlaid calcium influx traces of VSNs responding to consecutive pulses of rMUPs, followed by P4 incubation and third pulse of rMUPs, followed by a pulse of DAG analog, 1-Oleoyl-2-acetyl-sn-glycerol (OAG). (B and D) One-way ANOVA followed by Bonferroni correction. All values in mean ± SEM. *p < 0.05, **p < 0.01, ***p < 0.001, ****p < 0.0001; ns, not significant. White bars, ovx; pink bars, estrus; dark gray bars, diestrus. See also Figure S2.
Figure 3
Figure 3. Silencing of VSN Activity by Progesterone Requires PGRMC1
(A–C) Schematic of coronal VNO epithelium to orient (B) and (C). Immunohistochemical staining for PGRMC1 in (B) Pgrmc1fl/flOmp+/+ and (C) Pgrmc1fl/flOmpCre/+ mice. Scale bar, 20 µm, white asterisk indicates VSN dendrites. (D)Percentage of VSNs showing calcium influx to rMUPs from ovx Pgrmc1fl/flOmp+/+ and Pgrmc1fl/flOmpCre/+ females treated with or without 40 nM P4 (2,112; 2,041; 2,077; and 2,085 cells imaged, respectively). (E) Percentage of VSNs showing calcium influx to rMUPs from estrous and diestrous Pgrmc1fl/flOmp+/+ and Pgrmc1fl/fl OmpCre/+ females (2,543; 2,039; 2,549; and 2,223 cells imaged, respectively). (F) Preference index from two choice behavior assay conducted on estrous and diestrous Pgrmc1fl/flOmp+/+ and Pgrmc1mlOmpCre/+ females (n = 8, 9, 8, and 8, respectively). (D–F) One-way ANOVA followed by Bonferroni correction. All values in mean ±SEM. *p <0.05, **p< 0.01, ***p< 0.001, ****p< 0.0001; ns, not significant. White bars, ovx; pink bars, estrous; dark gray bars, diestrus. See also Figure S3.
Figure 4
Figure 4. VSNs that Detect the Cat Ligand FELD4 Are Not Silenced in Diestrus
(A) Percentage of VSNs from estrous and diestrous females showing calcium influx to FELD4 (p = 0.615, 2,506 and 4,231 cells imaged). (B) Preference index from two choice behavior assay conducted on estrous and diestrous females comparing FELD4 against biologically non-relevant control odor(p = 0.225, estrus n = 9, diestrus n = 10). (C) Percentage of VSNs from estrous and diestrous females showing calcium influx to male urine (p = 0.371, 3,396 and 3,188 cells imaged, respectively). (D and E) RNA deep sequencing reads (reads per million [rpm]) for PLC family in total unstimulated VNO (top panel) and MUP responsive neurons (bottom panel). Anti-PLCβ2 staining in VNO epithelium from (E) Plcβ2+/+. Scale bar, 70 µm. (F and G) Inset from (E) with nuclear staining (scale bar, 10 µm) and (G) Plcβ2−/−(scale bar, 70 µm). (A–C) Two-tailed t test. All values in mean ± SEM. p < 0.05, **p < 0.01, ***p < 0.001, ****p < 0.0001; ns, not significant. White bars, ovx; pink bars, estrus; dark gray bars, diestrus. See also Figure S4.
Figure 5
Figure 5. PLCβ2 Is a Primary Signaling Component in rMUP Detecting VSNs but Not in FELD4 Detecting VSNs
(A–E) Percentage of VSNs from Plcβ2+/+ (1,842 cells imaged) and Plcβ2−/− (2,023 cells imaged) estrous staged females showing calcium influx to (A) rMUPs (p = 0.00014), (B) FELD4 (p = 0.9305), and (C) male urine (p = 0.0004). Preference index from two choice behavior assay conducted on Plcβ2+/+ (estrus n = 8; diestrus n = 4) and Plcβ2−/− (estrus n = 7, diestrus n = 3) female mice with (D) FELD4 and (E) rMUPs. (A–C) Two-tailed t test. (D and E) One-way ANOVA followed by Bonferroni correction. All values in mean ± SEM. *p < 0.05, **p < 0.01, ***p < 0.001, ****p < 0.0001; ns, not significant. Pink bars, estrus; dark gray bars, diestrus.
Figure 6
Figure 6. VSN Sensory Silencing Changes Neural Circuit Activity in Accessory Olfactory Bulb
(A–C) Immunoprecipitation followed by anti-phosphoserine immunoblot for PLCβ2 from VNOs of Pgrmc1fl/flOmpCre/+ and Pgrmc1fl/fl Omp+/+ treated with or without 40 nM P4 (top panel); phosphoserine density normalized to total PLCβ2 density (bottom panel). Sagittal section of accessory olfactory bulb (AOB, dashed white outline) from (B) estrous and (C) diestrous mice showing cFOS expression after two-choice test with rMUPs (A, anterior; P, posterior; scale bars, 100 µm). (D) Average number of cFOS positive cells in glomerular and mitral layers per section from three animals in each state, following two-choice assay against either rMUPs, FELD4, or no odor control (Ant, anterior; Pos, posterior). (E) Schematic representation of differences in MUP responsive VSNs in the presence of high P4 during diestrus compared to low P4 during estrus, which results in specific changes in sensory attraction behavior. (A) Two-tailed t test. (D) One-way ANOVA followed by Bonferroni correction. All values in mean ± SEM. *p < 0.05, **p < 0.01, ***p < 0.001, ****p < 0.0001; ns, not significant. Pink bars, estrus; dark gray bars, diestrus; white bars, ovx. See also Figure S5.

References

    1. Bashour NM, Wray S. Progesterone directly and rapidly inhibits GnRH neuronal activity via progesterone receptor membrane component 1. Endocrinology. 2012;153:4457–4469. - PMC - PubMed
    1. Chamero P, Marton TF, Logan DW, Flanagan K, Cruz JR, Saghatelian A, Cravatt BF, Stowers L. Identification of protein pheromones that promote aggressive behaviour. Nature. 2007;450:899–902. - PubMed
    1. Chamero P, Leinders-Zufall T, Zufall F. From genes to social communication: molecular sensing by the vomeronasal organ. Trends Neurosci. 2012;35:597–606. - PubMed
    1. Dulac O, Torello AT. Molecular detection of pheromone signals in mammals: from genes to behaviour. Nat. Rev. Neurosci. 2003;4:551–562. - PubMed
    1. Eggan K, Baldwin K, Tackett M, Osborne J, Gogos J, Chess A, Axel R, Jaenisch R. Mice cloned from olfactory sensory neurons. Nature. 2004;428:44–49. - PubMed

Publication types