. 2015 Jun 6;16(1):119.
doi: 10.1186/s13059-015-0682-5.

Differential connectivity of splicing activators and repressors to the human spliceosome

Affiliations

Differential connectivity of splicing activators and repressors to the human spliceosome

Martin Akerman et al. Genome Biol. .

Abstract

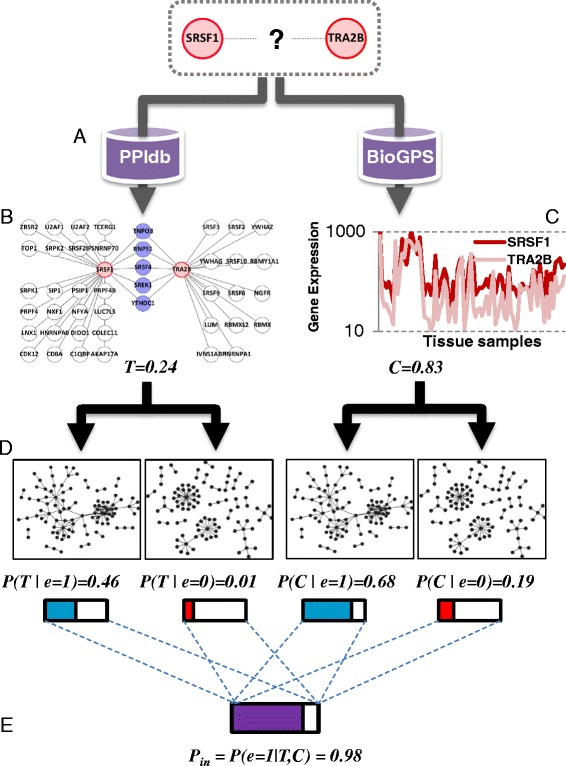
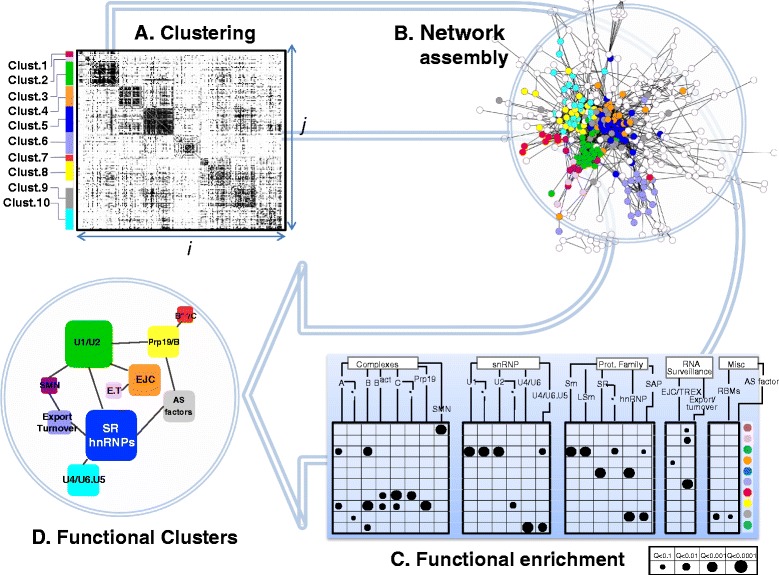
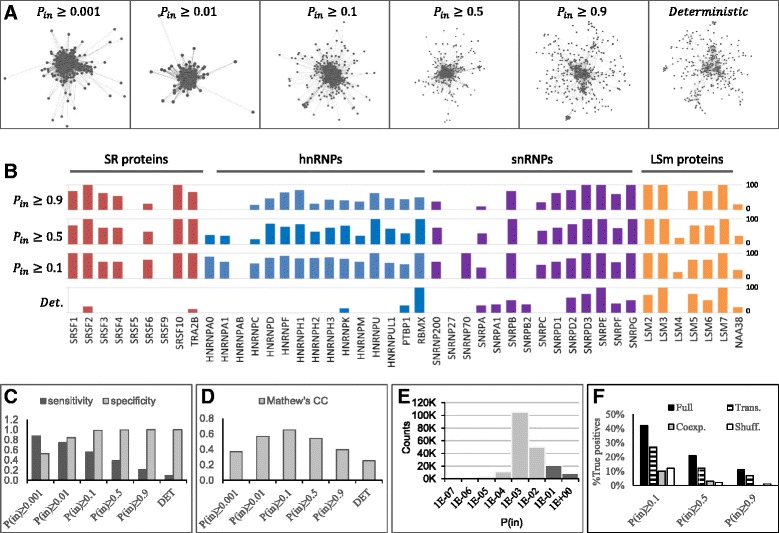
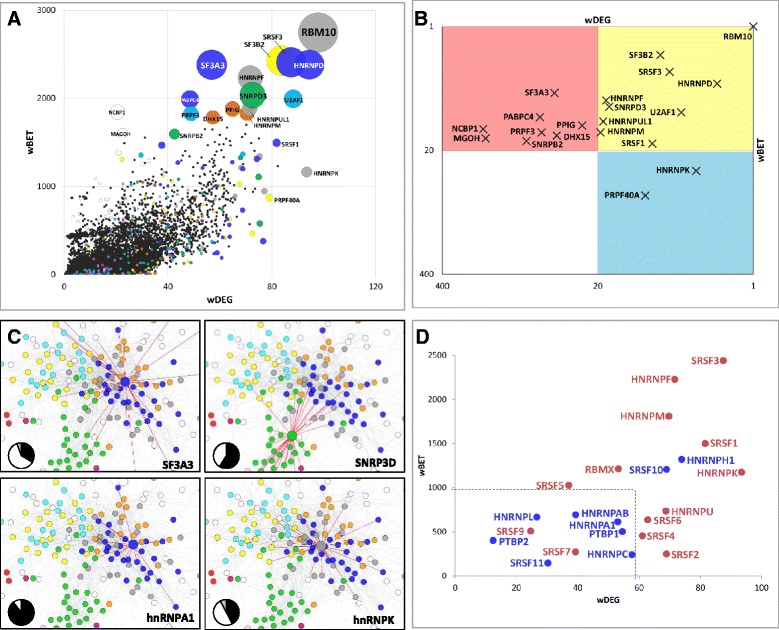
Background: During spliceosome assembly, protein-protein interactions (PPI) are sequentially formed and disrupted to accommodate the spatial requirements of pre-mRNA substrate recognition and catalysis. Splicing activators and repressors, such as SR proteins and hnRNPs, modulate spliceosome assembly and regulate alternative splicing. However, it remains unclear how they differentially interact with the core spliceosome to perform their functions.

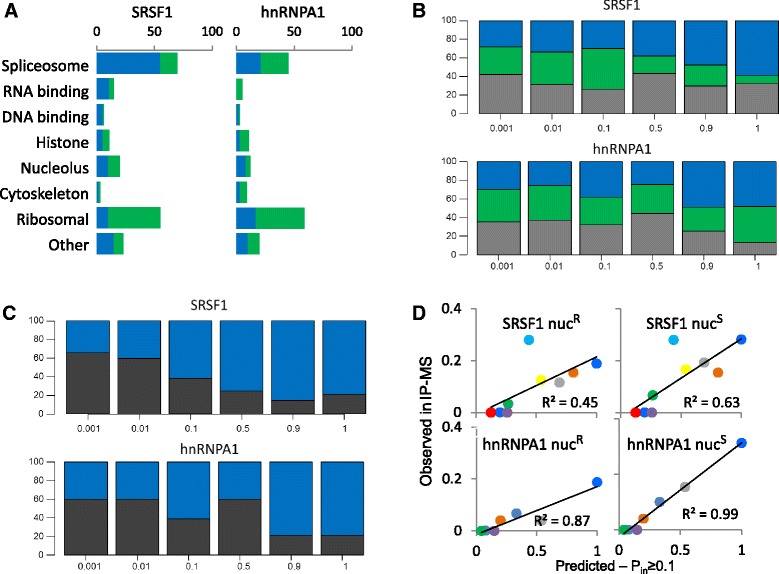
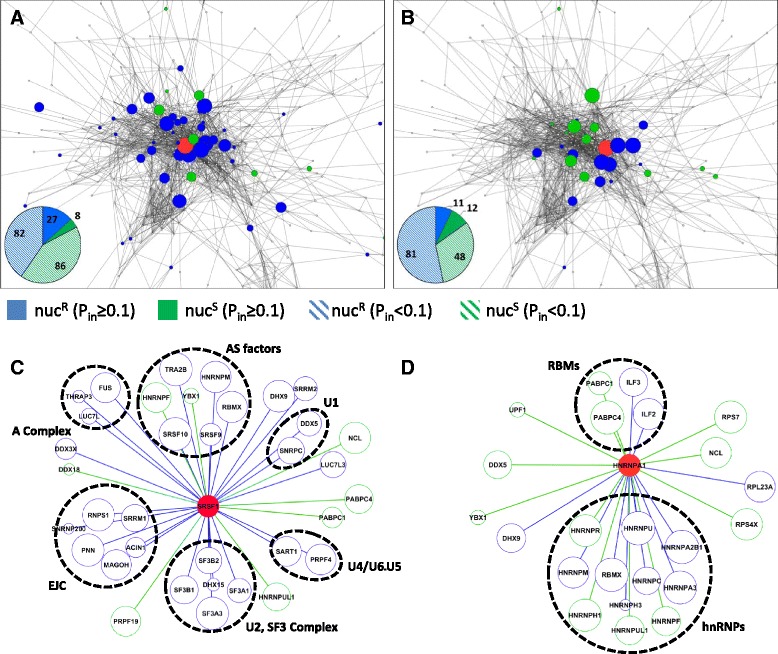
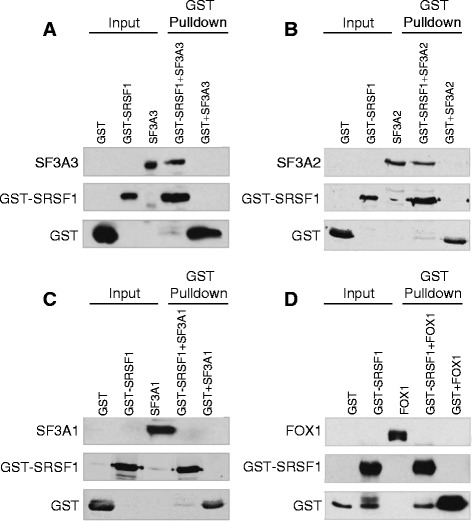
Results: Here, we investigate the protein connectivity of SR and hnRNP proteins to the core spliceosome using probabilistic network reconstruction based on the integration of interactome and gene expression data. We validate our model by immunoprecipitation and mass spectrometry of the prototypical splicing factors SRSF1 and hnRNPA1. Network analysis reveals that a factor's properties as an activator or repressor can be predicted from its overall connectivity to the rest of the spliceosome. In addition, we discover and experimentally validate PPIs between the oncoprotein SRSF1 and members of the anti-tumor drug target SF3 complex. Our findings suggest that activators promote the formation of PPIs between spliceosomal sub-complexes, whereas repressors mostly operate through protein-RNA interactions.

Conclusions: This study demonstrates that combining in-silico modeling with biochemistry can significantly advance the understanding of structure and function relationships in the human spliceosome.


Figures

Fig. 1
Fig. 1
Workflow of the Bayesian probability model to predict protein-protein interactions. Example of how the probability of direct interaction (Pin) between SRSF1 and TRA2B was calculated. a We first extracted all known PPIs formed by SRSF1 or TRA2B from a PPI database. b We used the number of shared PPIs between both proteins (blue nodes) and exclusive PPIs (white nodes) to calculate the Transitivity (T). c We then extracted their co-expression profile from the BioGPS microarray database and computed the Pearson correlation coefficient (C). d By transforming the calculated values of T and C through conditional-probability models, we estimated the probability that both T and C may occur in a true PPI network (e = 1, left network) and a false (that is, shuffled) interactome (e = 0, right network). e Finally, the probability Pin was calculated using the Bayes rule, as the posterior probability that SRSF1 and TRA2B directly bind each other, given T and C as evidence
Fig. 2
Fig. 2
Assembly of the PS network. The flowchart illustrates the identification of functional clusters (FC) of physically/functionally related proteins within the PS network. a The adjacency matrix of P in values for all possible protein pairs was processed with the Hierarchical Clustering algorithm, using Pearson correlation as a distance metric. Clusters were automatically assigned using the Genesis program (every cluster is represented by a different color). b Assembly of the PPI network, showing in this example PPIs with cutoff P in ≥ 0.9. c q-values resulting from the hypergeometric test to assess the relationship between every cluster and each functional category. Only q <0.1 are shown. The size of the bubble is inversely proportional to the q-value (bottom right). Functional terms were divided into four categories, and represented as a tree structure. The asterisks indicate groups of proteins that are exclusive to a particular category (for example, C-complex-specific proteins). The colored circles on the right correspond to the clusters identified in A. d A network of FCs. FCs are represented as squares labeled with the most significantly enriched functional categories. The square size is proportional to the number of proteins in the FC. Edges are shown for connections with CIJ score >0.2. E.T. = Export and Turnover
Fig. 3
Fig. 3
Predictability of the probabilistic spliceosome. a PS-networks visualized at different cutoffs: P in ≥0.001, P in ≥0.01, P in ≥0.1, P in ≥0.5, and P in ≥0.9 along with a deterministic network of PPIs detected by Y2H. b-d Cross-validation results. b Predictability by protein family. The height of the column indicates the percent of correctly predicted PPIs for SR proteins (red), hnRNPs (blue), snRNPs (purple), and LSm proteins (yellow). c Sensitivity (dark gray) and specificity (light gray). d Mathew’s correlation coefficient. e Distribution of P in values in the PS-network. Dark gray indicates values above the threshold P in ≥0.1. f Independent contribution of transitivity and co-expression. The plot shows the percent of correctly predicted PPIs for the full model, using: a combination of transitivity and co-expression (black); transitivity only (dark gray); co-expression (light gray); and as predicted by chance (white)
Fig. 4
Fig. 4
Connectivity of splicing factors to the human spliceosome. a Relationship between the Weighted Degree (wDEG) and Betweenness (wBET) among spliceosomal proteins. Each spliceosomal protein is represented as a bubble. The bubble’s position indicates wDEG and wBET scores. The size of the bubble denotes wDEG or wBET statistical significance (−log10 of the minimum q-value). The color of the bubble specifies the FC to which it belongs (same color code as Fig. 2). White bubbles correspond to unclustered proteins. Black dots represent the wDEG and wBET scores of 1,000 randomized PS networks. Names of the top 20 statistically significant proteins are shown. For more information, see Additional file 8: Table S5. b High-connectivity spliceosomal proteins. Top 20 proteins for wDEG and/or wBET, based on rankings from Additional file 8: Table S5. The yellow square contains proteins in the top 20 for both wDEG and wBET; the blue and red squares contain top scorers for wDEG or wBET, respectively. Both X and Y axes show ranks in logarithmic scale. c PPIs at P in ≥0.9 formed by the designated proteins are shown as red edges (node colors as in Fig. 2). The pie charts indicate the proportion of interactions at P in ≥0.9 formed between each protein and members of its own cluster (black), other clusters (white), and unclustered proteins (gray). For additional information, see Additional file 10: Figure S3. d wDEG and wBET for splicing activators (red) and repressors (blue) of the SR and hnRNP families, according to annotations in the RegRNA database ([26], Additional file 5: Table S3). The traced square indicates a speculative boundary separating activators from repressors
Fig. 5
Fig. 5
High-probability PPIs enriched by IP-MS. Two splicing factors, SRSF1 and hnRNPA1, were used as baits for IP-MS. The identified proteins were overlaid with the PS-network to identify meaningful patterns of enrichment. a The most frequent categories of ligands identified by IP-MS with (blue) or without (green) nuclease treatment. b P in distribution of bait-ligand interactions for SRSF1 and hnRNPA1. The stacked bars illustrate for every Pin interval, the proportion of IP-MS ligands recovered with (blue) or without (green) nuclease versus the remaining spliceosomal proteins not identified by IP-MS (gray). The values were normalized by the total number of proteins in every group. c Similar to B, comparing Pin values from nuclease resistant bait-ligand interactions (blue) to those of ligand-ligand interactions (black). d Linear regression between the proportions of observed and expected PPIs (P in ≥0.1) from each FC. Each dot represents an FC, according to the Fig. 2 color code. Complementary information about this figure is presented in Additional file 13: Figure S5
Fig. 6
Fig. 6
The SRSF1 and hnRNPA1 interactomes. Visualization of the SRSF1 (a, c) and hnRNPA1 (b, d) interactomes. (a) SRSF1 and (b) hnRNPA1 interactomes in the context of the PS network. Nodes representing ligands that form nucR PPIs with the bait are in blue; nucS proteins are colored green; IP-MS baits are colored red, and the node sizes are proportional to the P in scores between each ligand and the bait. Pie charts show the number of nucR (blue) and nucS (green) bait-to-ligand interactions with P in ≥0.1 (dark) and all co-purified proteins (light). (c,d) High-probability interactions (P in ≥0.1) detected by IP-MS for (c) SRSF1 and (d) hnRNPA1. Blue nodes and edges show nucR PPIs; green nodes and edges show nucS PPIs; the baits are colored red; functionally related groups of ligands are labeled and indicated with dashed circles
Fig. 7
Fig. 7
Experimental validation of SRSF1-SF3A PPIs. Purified GST-SRSF1 recombinant protein was incubated with (a) His-SF3A3, (b) His-SF3A2, (c) His-SF3A1, or (d) His-FOX1, in the presence of nuclease. GST-SRSF1 was pulled down using glutathione-Sepharose beads, resolved by SDS-PAGE, and interacting partners were detected by anti-His antibody. Purified GST protein was used as a pulldown control

Comment in

References

    1. Chen YI, Moore RE, Ge HY, Young MK, Lee TD, Stevens SW. Proteomic analysis of in vivo-assembled pre-mRNA splicing complexes expands the catalog of participating factors. Nucleic Acids Res. 2007;35:3928–44. doi: 10.1093/nar/gkm347. - DOI - PMC - PubMed
    1. Wahl MC, Will CL, Luhrmann R. The spliceosome: design principles of a dynamic RNP machine. Cell. 2009;136:701–18. doi: 10.1016/j.cell.2009.02.009. - DOI - PubMed
    1. Will CL, Luhrmann R. Spliceosome structure and function. Cold Spring Harb Perspect Biol. 2011;3:pii: a003707. - PMC - PubMed
    1. Pan Q, Shai O, Lee LJ, Frey BJ, Blencowe BJ. Deep surveying of alternative splicing complexity in the human transcriptome by high-throughput sequencing. Nat Genet. 2008;40:1413–5. doi: 10.1038/ng.259. - DOI - PubMed
    1. Wang ET, Sandberg R, Luo S, Khrebtukova I, Zhang L, Mayr C, et al. Alternative isoform regulation in human tissue transcriptomes. Nature. 2008;456:470–6. doi: 10.1038/nature07509. - DOI - PMC - PubMed

Publication types

MeSH terms

Substances

LinkOut - more resources