Clinical Trial
. 2015 Jun 6:10:70.
doi: 10.1186/s13023-015-0286-x.

Alpha-mannosidosis: correlation between phenotype, genotype and mutant MAN2B1 subcellular localisation

Affiliations
Clinical Trial

Alpha-mannosidosis: correlation between phenotype, genotype and mutant MAN2B1 subcellular localisation

Line Borgwardt et al. Orphanet J Rare Dis. .

Abstract

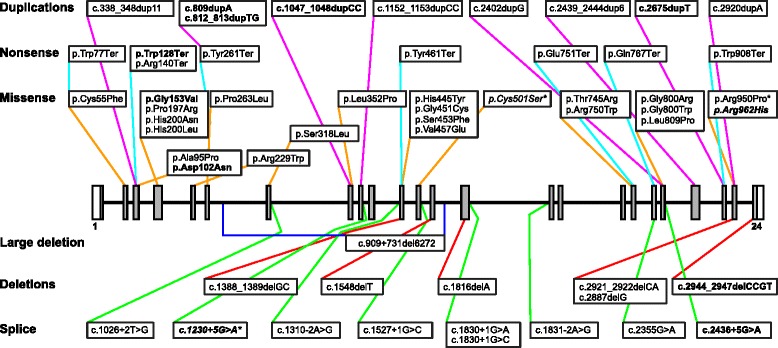
Background: Alpha-mannosidosis is caused by mutations in MAN2B1, leading to loss of lysosomal alpha-mannosidase activity. Symptoms include intellectual disabilities, hearing impairment, motor function disturbances, facial coarsening and musculoskeletal abnormalities.

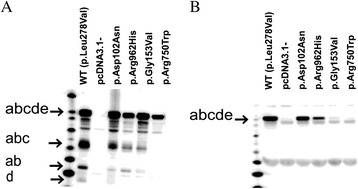
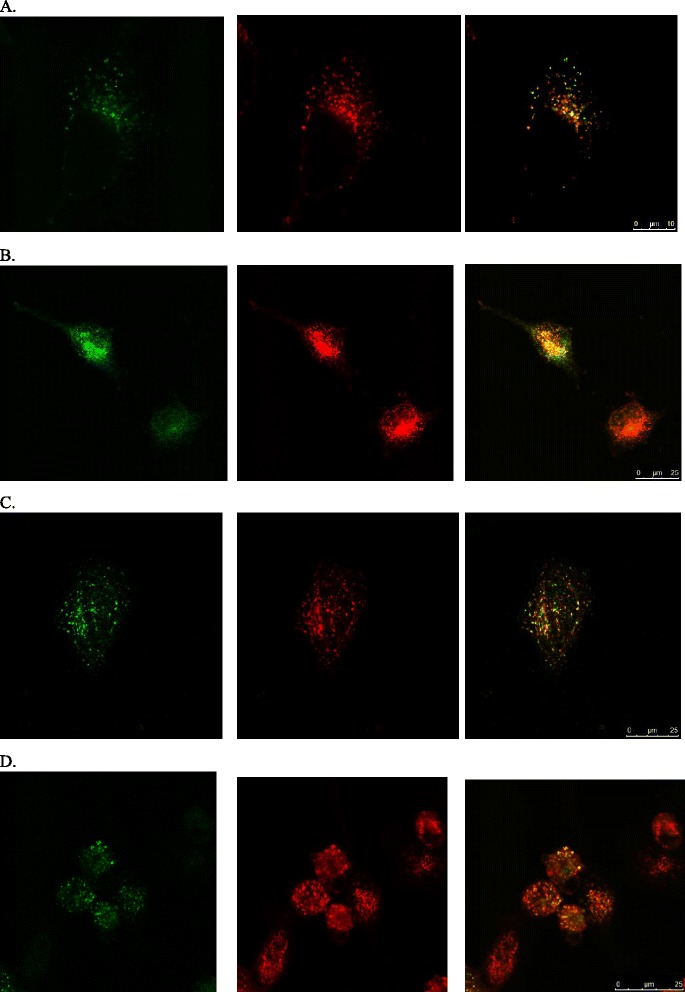
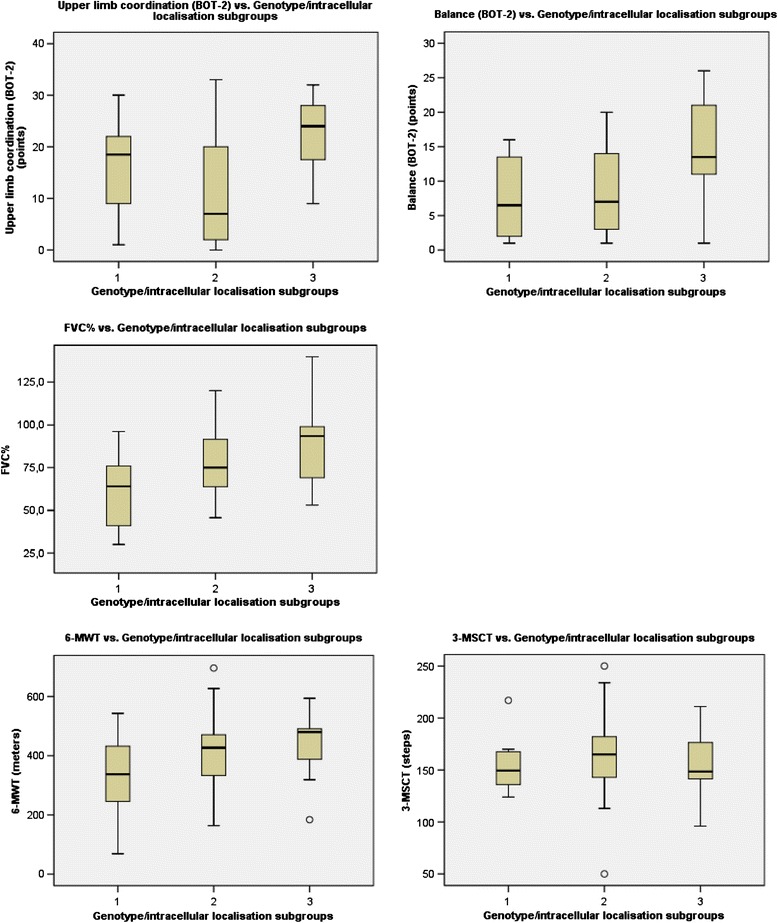
Methods: To study the genotype-phenotype relationship for alpha-mannosidosis 66 patients were included. Based on the predicted effect of the mutations and the subcellular localisation of mutant MAN2B1 in cultured cells, the patients were divided into three subgroups. Clinical and biochemical data were collected. Correlation analyses between each of the three subgroups of genotype/subcellular localisation and the clinical and biochemical data were done to investigate the potential relationship between genotype and phenotype in alpha-mannosidosis. Statistical analyses were performed using the SPSS software. Analyses of covariance were performed to describe the genotype-phenotype correlations. The phenotype parameters were modelled by the mutation group and age as a covariate. P values of <0.05 were considered as statistically significant.

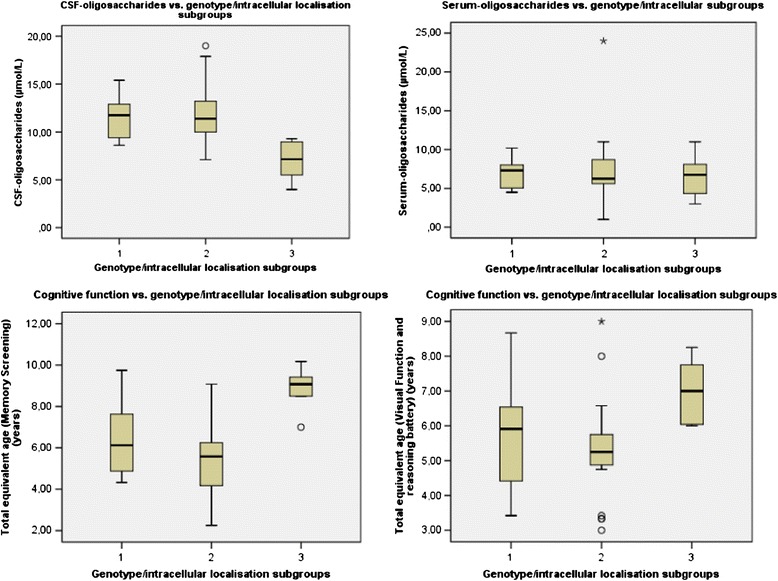
Results: Complete MAN2B1 genotypes were established for all patients. We found significantly higher scores in the Leiter-R test, lower concentrations of CSF-oligosaccharides, higher point scores in the Bruininks-Oseretsky Test of Motor Proficiency subtests (BOT-2); Upper limb coordination and Balance, and a higher FVC% in patients in subgroup 3, harbouring at least one variant that allows localisation of the mutant MAN2B1 protein to the lysosomes compared to subgrou 2 and/or subgroup 1 with no lysosomal localization of the mutant MAN2B1 protein.

Conclusion: Our results indicate a correlation between the MAN2B1 genotypes and the cognitive function, upper limb coordination, balance, FVC% and the storage of oligosaccharides in CSF. This correlation depends on the subcellular localisation of the mutant MAN2B1 protein.

Trial registration: ClinicalTrials.gov NCT00498420 NCT01681953.


Figures

Fig. 1
Fig. 1
Schematic view of the localisation and type of mutations in the study cohort. Boxes represent exons (coding region in grey), lines represent introns. Mutations are labelled according to HGVS recommendations (http://www.hgvs.org/mutnomen/). Deletions, duplications and splice variants are described using the MAN2B1 coding DNA reference sequence NM_000528.3, where position +1 corresponds to A in the first ATG translation initiation codon. Novel mutations are in bold. Variants of uncertain clinical significance are in italics. *Variant c.1230+5G>A was detected in two siblings where it was in cis with c.2248C>T p.Arg750Trp; variants c.1501T>A p.Cys501Ser and c.2849G>C p.Arg950Pro were in cis in one patient
Fig. 2
Fig. 2
Western blot showing the intracellular processing and secretion of the novel MAN2B1 missense variants in transfected COS-7 cells. The relative intensity of the different peptides is different for the wild-type enzyme and the missense variants. a. Overexpressed and transported MAN2B1 proteins are also secreted into the cell media in the full-length form. b. The WT was included as a positive control of MAN2B1 processing/secretion, pcDNA3.1 was included as a negative control of MAN2B1 expression (cells transfected with an empty vector) and MAN2B1 p.Arg750Trp was included as a negative control of MAN2B1 processing/secretion (accumulates in the ER)
Fig. 3
Fig. 3
Confocal fluorescent microscopy images showing the intracellular localisation of the novel MAN2B1 missense variants in transfected HeLa-cells. The first column of images shows methanol-fixed transfected HeLa-cells stained for MAN2B1 (green), the second column shows the same cells stained for the lysosomal marker LAMP1 (red) and the third column shows merged images with colocalized MAN2B1 and LAMP1 (yellow). a: MAN2B1 p.Asp102Asn; b: MAN2B1 p.Gly153Val; c: MAN2B1 p.Arg962His; d: WT. The WT was included as a positive control of lysosomal localization
Fig. 4
Fig. 4
The correlation between the three genotype/subcellular localisation subgroups and CNS related clinical and biochemical data. The correlation between the three genotype/subcellular localisation subgroups and serum-oligosaccharides, CSF-oligosaccharides, total equivalent age for Visual Function and Reasoning battery and Total equivalent age for Memory and Attention battery. (CSF-oligosaccharides: H0 3 = 2: p = 0.001, H0 3 = 1: p = 0.011, H0 2 = 1: p = 1.000, Serum-oligosaccharides: p = 0.76 (age p = 0.86) (Because of the non-significant results, pairwise comparisons are not reported), Total equivalent age for Visual Function and Reasoning battery (H0 3 = 2: p = 0.02, H0 3 = 1: p = 0.215, H0 2 = 1: p = 0.836), Total equivalent age for Memory and Attention battery (H0 3 = 2: p = 0.296, H0 3 = 1: p = 0.003, H0 2 = 1: p = 0.042)
Fig. 5
Fig. 5
Correlation between the three genotype/subcellular localisation subgroups and the motor function test and FVC%. BOT-2 subtest: Balance: H0 3 = 2: p = 0.033, H0 3 = 1: p = 0.06, H0 2 = 1: p = 1.000, BOT-2 subtest: Upper limb and coordination: H0 3 = 2: p = 0.047, H0 3 = 1: p = 0.713, H0 2 = 1: p = 0.773, FVC%: H0 3 = 2: p = 0.296, H0 3 = 1: p = 0.003, H0 2 = 1: p:0.042. 6-MWT (six-minutes-walk-test): p = 0.102 (age: p = 0.01), 3-MSCT (three-minutes-stair-climb-test): p=0.82 (age p=0.60). Because of the non-significant results, pairwise comparisons are not reported

References

    1. Malm D, Nilssen Ø. Alpha-mannosidosis. GeneReviews: NCBI Bookshelf; 2012.
    1. Borgwardt L, Dali C, Lund A. Alpha-mannosidosis – a review of genetic, clinical findings and options of treatment. Pediatr Endocrinol Rev. 2014;12(Suppl 1):185–91. - PubMed
    1. H.H.Freeze: Degradation and Turnover of Glycans. In Essentials of Glycobiology. 2nd edition edition. Edited by Ajit Varki. Cold Spring Harbor Perspectives in Biology; 1999.
    1. Thomas GH. Disorder of Glycoprotein Degradation. The Metabolic &Molecular Bases of Inherited Disease; McGraw-Hill, Medical Publishing Division, 2001.
    1. HUGO Gene Nomenclature Committee. [http://www.genenames.org/]

Publication types

LinkOut - more resources