Comparative Study
. 2015 Aug;25(8):1081-90.
doi: 10.1101/gr.184135.114. Epub 2015 Jun 5.

The sea lamprey meiotic map improves resolution of ancient vertebrate genome duplications

Affiliations
Comparative Study

The sea lamprey meiotic map improves resolution of ancient vertebrate genome duplications

Jeramiah J Smith et al. Genome Res. 2015 Aug.

Abstract

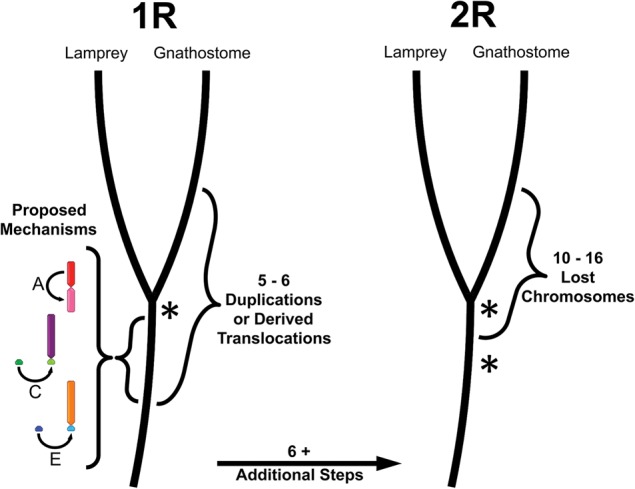
It is generally accepted that many genes present in vertebrate genomes owe their origin to two whole-genome duplications that occurred deep in the ancestry of the vertebrate lineage. However, details regarding the timing and outcome of these duplications are not well resolved. We present high-density meiotic and comparative genomic maps for the sea lamprey (Petromyzon marinus), a representative of an ancient lineage that diverged from all other vertebrates ∼550 million years ago. Linkage analyses yielded a total of 95 linkage groups, similar to the estimated number of germline chromosomes (1n ∼ 99), spanning a total of 5570.25 cM. Comparative mapping data yield strong support for the hypothesis that a single whole-genome duplication occurred in the basal vertebrate lineage, but do not strongly support a hypothetical second event. Rather, these comparative maps reveal several evolutionarily independent segmental duplications occurring over the last 600+ million years of chordate evolution. This refined history of vertebrate genome duplication should permit more precise investigations of vertebrate evolution.


Figures

Figure 1.
Figure 1.
An abridged phylogeny of the vertebrate lineage. Labels denote taxa for which comparative analyses were performed. The approximate timing of key radiation events is shown to the left. Extinct lineages and some extant lineages (e.g., Ascidians, hagfish, coelacanth, lungfish) have been omitted for simplicity. Lancelets, lampreys, sharks, reptiles, and mammals are, respectively, represented by Branchiostoma floridae (Florida lancelet), Petromyzon marinus (sea lamprey), Callorhinchus milii (elephant shark), Gallus gallus (chicken), and Homo sapiens (human). (CZ) Cenozoic.
Figure 2.
Figure 2.
The chromosomal distribution of lamprey/chicken orthologs reveals conserved syntenic segments and paralogous chromosomes that derive from individual ancestral chromosomes. Lamprey linkage groups are oriented along the y-axis, and chicken chromosomes are oriented along the x-axis. Circles reflect counts of syntenic orthologs on the corresponding lamprey LG and chicken chromosome, with the size of each circle being proportional to the number of orthologous genes. The color of each circle represents the degree to which the number of observed orthologs deviates from null expectations under a uniform distribution across an identical number of LGs, chromosomes, and genes per LG and chromosome. Shaded regions of the plot designate homology groups that correspond to presumptive ancestral chromosomes, marked A–M (Supplemental Table S1). The ordering of lamprey LGs along the y-axis is provided in Supplemental Table S4.
Figure 3.
Figure 3.
Distribution of individual orthologous genes across paralogous chicken and lamprey chromosomes. (A) Orthologs from chicken chromosomes GG14 and GG18 are distributed across five lamprey LGs (the complete set of lamprey linkage groups with significant enrichment for orthologs on these two chicken chromosomes). (B) Orthologs from these LGs are distributed across GG14 and GG18 (the complete set of chicken chromosomes with significant enrichment for orthologs on these lamprey linkage groups). (C) Orthologies plotted in A, with retained chicken paralogs denoted by bold lines. (D) Orthologies plotted in B, with retained lamprey paralogs denoted by bold lines. Roman numerals designate lamprey LGs. Asterisks mark the location of four conserved paralogs that are derived from a single gene located on ancI. Brackets denote presumptive ancestral linkages that are supported by the distribution of paralogous genes.
Figure 4.
Figure 4.
Comparative mapping with amphioxus and elephant shark reveals conserved syntenic segments that provide additional support for the proposed set of ancestral (pre-duplication) chromosomes. (A) The distribution of orthologs across lamprey linkage groups and elephant shark scaffolds. (B) The distribution of orthologs across lamprey linkage groups and amphioxus scaffolds. Lamprey linkage groups are oriented along the y-axis and reference scaffolds are oriented along the x-axis. Circles reflect counts of syntenic orthologs on the corresponding linkage group and scaffold, with the size of each circle being proportional to the number of orthologous genes. The color of each circle represents the degree to which the number of observed orthologs deviates from null expectations under a uniform distribution across an identical number of LGs, chromosomes, and genes per LG and chromosome. Shaded regions of the plot designate homology groups that correspond to presumptive ancestral chromosomes, marked A–M (Supplemental Table S1). The ordering of lamprey LGs along the y-axis is identical to Figure 2 and is provided in Supplemental Table S4. Brackets in B denote discreet sets of orthologous segments that lend support to post-WGD rearrangements.
Figure 5.
Figure 5.
A summary of statistical tests aimed at assessing the feasibility of several evolutionary models that have been proposed to explain the distribution of paralogous regions in gnathostome genomes: (A) A liberal test of a simple model invoking two rounds of whole-genome duplication (WGD). (BD) Tests of alternate scenarios wherein chromosome losses or segmental duplications occur in the context of a specified number of WGD events. (B) Two rounds of WGD followed by extensive loss of large duplicated segments/chromosomes. (C) A model invoking only segmental duplication. (D) A model invoking segmental duplications pre- or post-dating a single WGD. Asterisks denote whole-genome duplication events.
Figure 6.
Figure 6.
A summary of alternate evolutionary models explaining the distribution of paralogous segments in gnathostome genomes. Asterisks denote whole-genome duplication events proposed under two alternate sets of evolutionary models. Mechanisms underlying three pre-R1 duplications are depicted under the “1R” model.

References

    1. Abi-Rached L, Gilles A, Shiina T, Pontarotti P, Inoko H. 2002. Evidence of en bloc duplication in vertebrate genomes. Nat Genet 31: 100–105. - PubMed
    1. Alfoldi J, Di Palma F, Grabherr M, Williams C, Kong L, Mauceli E, Russell P, Lowe CB, Glor RE, Jaffe JD, et al. 2011. The genome of the green anole lizard and a comparative analysis with birds and mammals. Nature 477: 587–591. - PMC - PubMed
    1. Altschul SF, Gish W, Miller W, Myers EW, Lipman DJ. 1990. Basic local alignment search tool. J Mol Biol 215: 403–410. - PubMed
    1. Amemiya CT, Alfoldi J, Lee AP, Fan S, Philippe H, Maccallum I, Braasch I, Manousaki T, Schneider I, Rohner N, et al. 2013. The African coelacanth genome provides insights into tetrapod evolution. Nature 496: 311–316. - PMC - PubMed
    1. Amores A, Catchen J, Ferrara A, Fontenot Q, Postlethwait JH. 2011. Genome evolution and meiotic maps by massively parallel DNA sequencing: spotted gar, an outgroup for the teleost genome duplication. Genetics 188: 799–808. - PMC - PubMed

Publication types

LinkOut - more resources