

Mendelian randomization with invalid instruments: effect estimation and bias detection through Egger regression
- PMID: 26050253
- PMCID: PMC4469799
- DOI: 10.1093/ije/dyv080
Mendelian randomization with invalid instruments: effect estimation and bias detection through Egger regression
Abstract
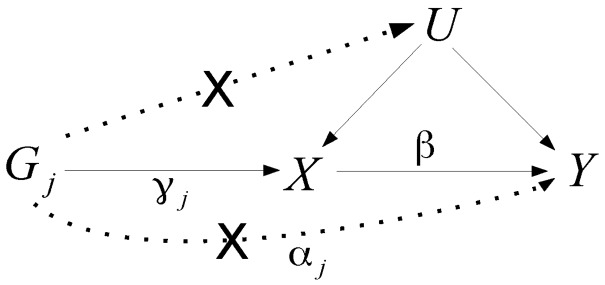
Background: The number of Mendelian randomization analyses including large numbers of genetic variants is rapidly increasing. This is due to the proliferation of genome-wide association studies, and the desire to obtain more precise estimates of causal effects. However, some genetic variants may not be valid instrumental variables, in particular due to them having more than one proximal phenotypic correlate (pleiotropy).
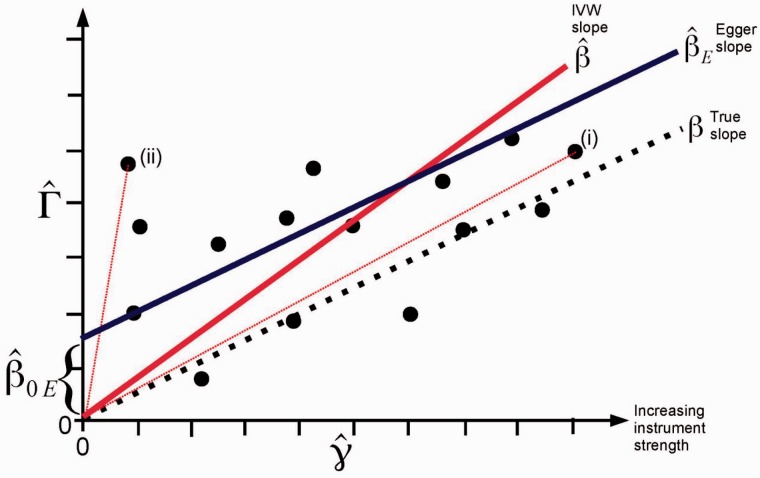
Methods: We view Mendelian randomization with multiple instruments as a meta-analysis, and show that bias caused by pleiotropy can be regarded as analogous to small study bias. Causal estimates using each instrument can be displayed visually by a funnel plot to assess potential asymmetry. Egger regression, a tool to detect small study bias in meta-analysis, can be adapted to test for bias from pleiotropy, and the slope coefficient from Egger regression provides an estimate of the causal effect. Under the assumption that the association of each genetic variant with the exposure is independent of the pleiotropic effect of the variant (not via the exposure), Egger's test gives a valid test of the null causal hypothesis and a consistent causal effect estimate even when all the genetic variants are invalid instrumental variables.
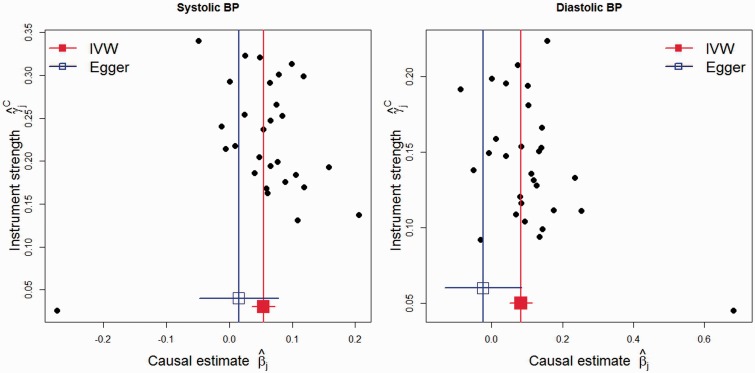
Results: We illustrate the use of this approach by re-analysing two published Mendelian randomization studies of the causal effect of height on lung function, and the causal effect of blood pressure on coronary artery disease risk. The conservative nature of this approach is illustrated with these examples.
Conclusions: An adaption of Egger regression (which we call MR-Egger) can detect some violations of the standard instrumental variable assumptions, and provide an effect estimate which is not subject to these violations. The approach provides a sensitivity analysis for the robustness of the findings from a Mendelian randomization investigation.
Keywords: MR-Egger test; Mendelian randomization; invalid instruments; meta-analysis; pleiotropy; small study bias.
© The Author 2015; Published by Oxford University Press on behalf of the International Epidemiological Association.
Figures
Comment in
-
Why internal weights should be avoided (not only) in MR-Egger regression.Int J Epidemiol. 2016 Oct;45(5):1676-1678. doi: 10.1093/ije/dyw240. Epub 2016 Sep 20. Int J Epidemiol. 2016. PMID: 27649799 No abstract available.
-
Response to Hartwig and Davies.Int J Epidemiol. 2016 Oct;45(5):1679-1680. doi: 10.1093/ije/dyw252. Epub 2016 Sep 20. Int J Epidemiol. 2016. PMID: 27649802 Free PMC article. No abstract available.
-
Misconceptions on the use of MR-Egger regression and the evaluation of the InSIDE assumption.Int J Epidemiol. 2017 Dec 1;46(6):2097-2099. doi: 10.1093/ije/dyx192. Int J Epidemiol. 2017. PMID: 29025021 Free PMC article. No abstract available.
-
A note on the use of Egger regression in Mendelian randomization studies.Int J Epidemiol. 2017 Dec 1;46(6):2094-2097. doi: 10.1093/ije/dyx191. Int J Epidemiol. 2017. PMID: 29025040 No abstract available.
References
-
- Davey Smith G, Ebrahim S. ‘Mendelian randomization’: can genetic epidemiology contribute to understanding environmental determinants of disease? Int J Epidemiol 2003;32:1–22. - PubMed
-
- Burgess S, Butterworth A, Malarstig A, Thompson S. Use of Mendelian randomisation to assess potential benefit of clinical intervention. BMJ 2012;345:e7325. - PubMed
-
- Sleiman P, Grant S. Mendelian randomization in the era of genomewide association studies. Clin Chem 2010;56:723–28. - PubMed
-
- Boef A, Dekkers O, Le Cessie S. Mendelian randomization studies: a review of the approaches used and the quality of reporting. Int J Epidemiol 2015;44:496–511. - PubMed
Publication types
MeSH terms
Grants and funding
- SP/08/007/23628/BHF_/British Heart Foundation/United Kingdom
- MR/L012286/1/MRC_/Medical Research Council/United Kingdom
- MC_UU_12013_2/MRC_/Medical Research Council/United Kingdom
- MR/L003120/1/MRC_/Medical Research Council/United Kingdom
- MC_UU_12013/1/MRC_/Medical Research Council/United Kingdom
- MC_UU_12013_8/MRC_/Medical Research Council/United Kingdom
- 100114/WT_/Wellcome Trust/United Kingdom
- MC_UU_12013_5/MRC_/Medical Research Council/United Kingdom
- RG/08/014/24067/BHF_/British Heart Foundation/United Kingdom
- MC_UU_12013/9/MRC_/Medical Research Council/United Kingdom
- MR/N501906/1/MRC_/Medical Research Council/United Kingdom
LinkOut - more resources
Full Text Sources
Other Literature Sources
Miscellaneous
