. 2015 Oct;23(10):1695-703.
doi: 10.1016/j.joca.2015.05.027. Epub 2015 Jun 5.

Three-dimensional MRI-based statistical shape model and application to a cohort of knees with acute ACL injury

Affiliations

Three-dimensional MRI-based statistical shape model and application to a cohort of knees with acute ACL injury

V Pedoia et al. Osteoarthritis Cartilage. 2015 Oct.

Abstract

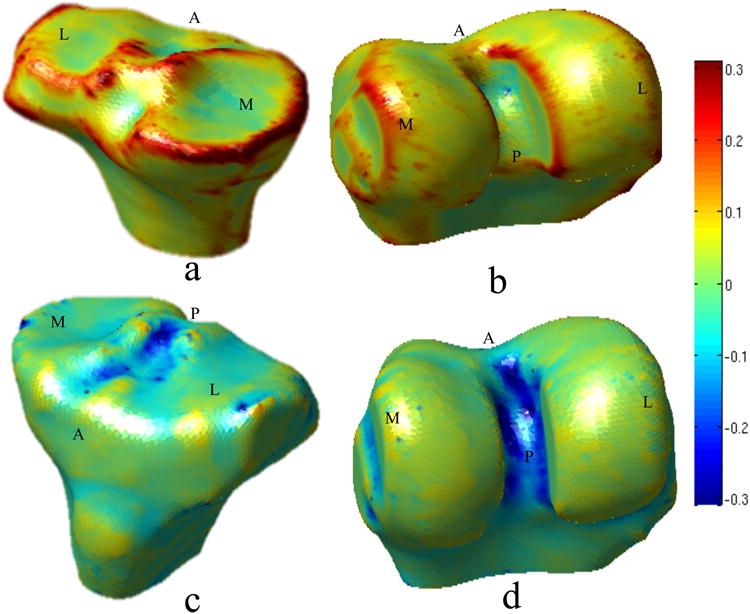
Objective: The aim of this study is to develop a novel 3D magnetic resonance imaging (MRI)-based Statistical Shape Modeling (SSM) and apply it in knee MRIs in order to extract and compare relevant shapes of the tibia and femur in patients with and without acute Anterior cruciate ligament (ACL) injuries.

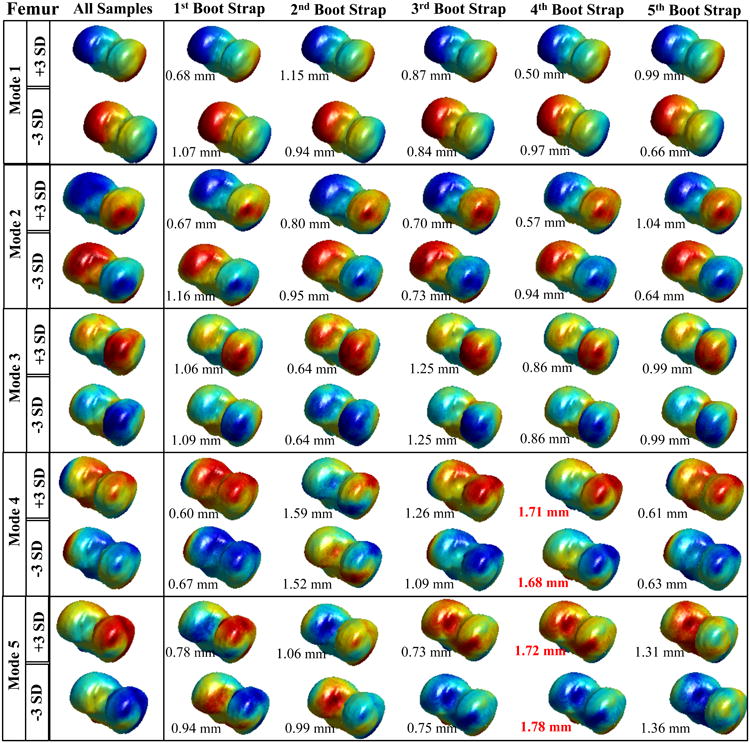
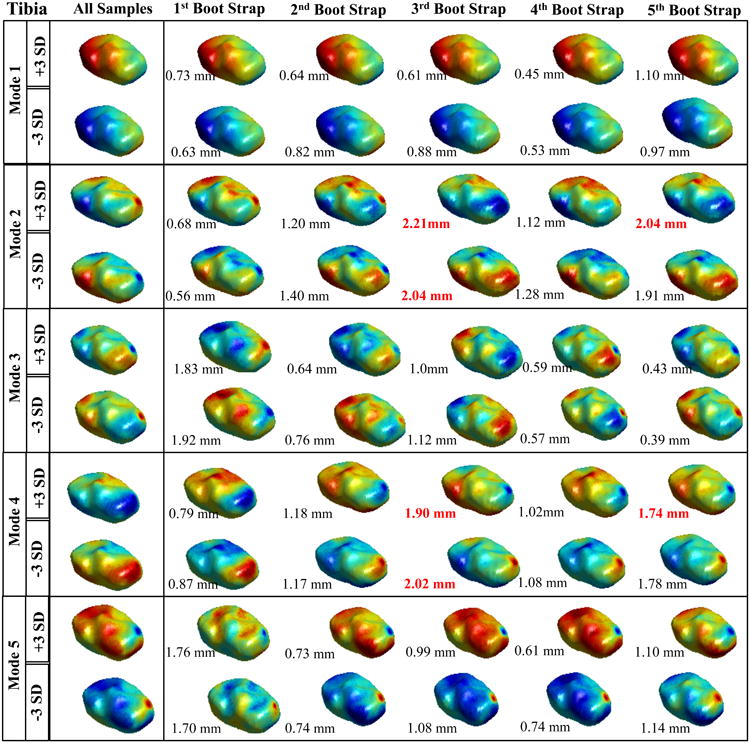
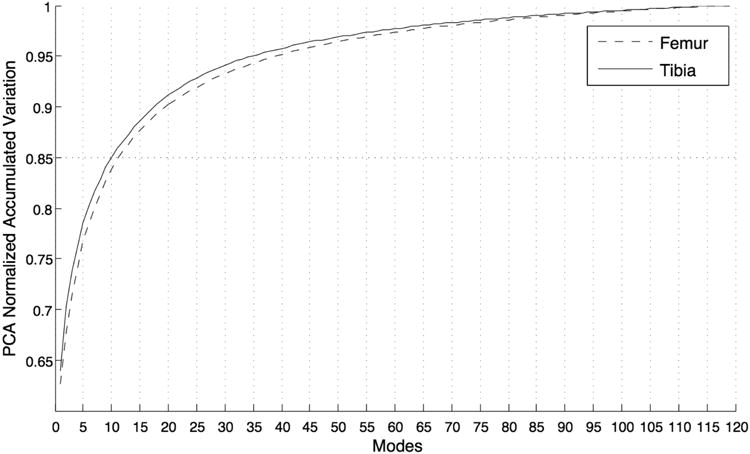
Methods: Bilateral MR images were acquired and analyzed for 50 patients with acute ACL injuries and for 19 control subjects. A shape model was extracted for the tibia and femur using an SSM algorithm based on a set of matched landmarks that are computed in a fully automatic manner.

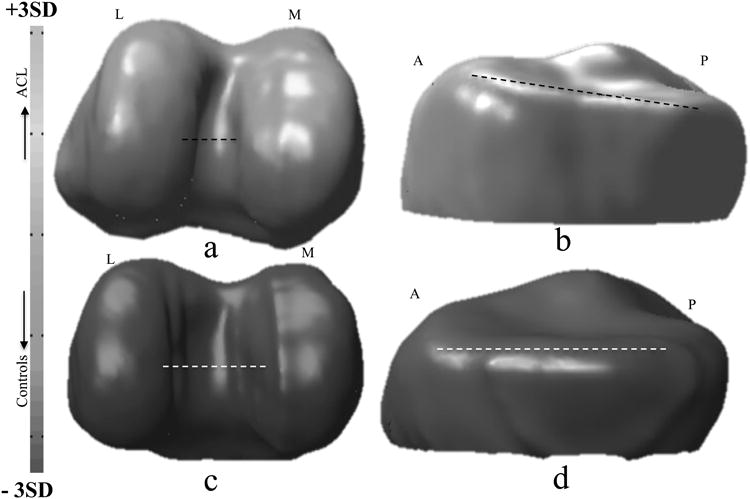
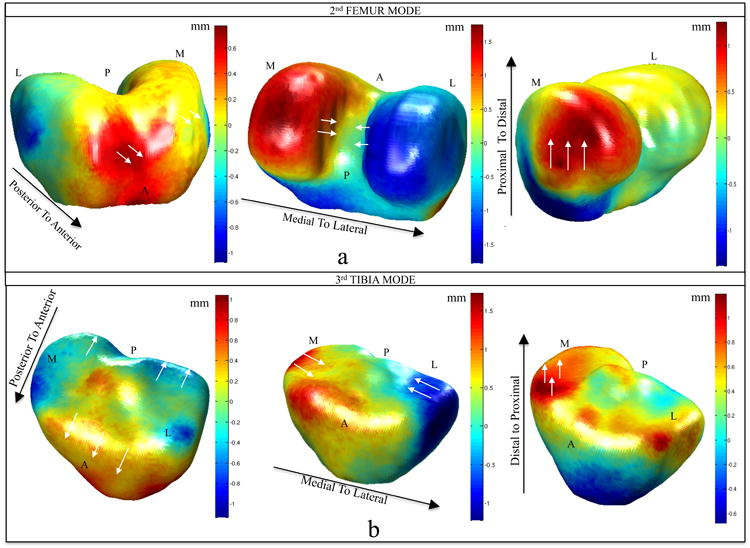
Results: Shape differences were detected between the knees in the ACL-injury group and control group, suggesting a common shape feature that may predispose these knees to injury. Some of the detected shape features that discriminate between injured and control knees are related to intercondylar width and posterior tibia slope, features that have been suggested in previous studies as ACL morphological risk factors. However, shape modeling has the great potential to quantify these characteristics with a comprehensive description of the surfaces describing complex 3D deformation that cannot be represented with simple geometric indexes.

Conclusions: 3D MRI-based bone shape quantification has the ability to identify specific anatomic risk factors for ACL injury. A better understanding of the role in bony shape on ligamentous injuries could help in the identification of subjects with an increased risk for an ACL tear and to develop targeted prevention strategies, including education and training.

Keywords: Anterior cruciate ligament; Magnetic resonance imaging; Osteoarthritis; Statistical shape modeling.


Conflict of interest statement

: The authors have no conflicts of interests to disclose.

Figures

Figure 1
Figure 1
Spatial distribution of the principal curvatures on the reference surfaces of tibia and femur. a) Tibia maximum curvature k1. b) Femur maximum curvature k1. c) Tibia minimum curvature k2. d) Femur minimum curvature k2. Directions are labeled in the figure. M: medial, L: lateral, A: anterior P: posterior
Figure 2
Figure 2
Results of the Femur bootstrapping experiment. Spatial distribution of the vertex displacements assigned to mode values equal to: mean +3*standard deviation and mean – standard deviation. Each row represents a different modes form 1 to 5. The first column shows the model obtained with the whole cohort (119 knees). The rows 2-6 show the spatial distribution of the displacement for the different bootstrap together with the average distance between the fully sampled model.
Figure 3
Figure 3
Results of the Tibia bootstrapping experiment. Spatial distribution of the vertex displacements assigned to mode values equal to: mean +3*standard deviation and mean – standard deviation. Each row represents a different modes form 1 to 5. The first column shows the model obtained with the whole cohort (119 knees). The rows 2-6 show the spatial distribution of the displacement for the different bootstrap together with the average distance between the fully sampled model.
Figure 4
Figure 4
Representation of the model's compactness: cumulative % of the variability expressed in function of the number of modes considered in the model.
Figure 5
Figure 5
modeling of the principal component F2 (a,c) and T3 (b,d) of the scale-preserved model. In the first row Mean + 3STD. in the second row Mean − 3STD. Directions are labeled in the figure. M: medial, L: lateral, A: anterior P: posterior
Figure 6
Figure 6
Displacement of the vertices modeling the difference between injured and control knees in the modes F2 (a), T3 (b) of the scale-preserved model. The black arrows show the direction of the displacement represented in each mesh. Posterior to anterior: positive values (red) displacement towards anterior direction, negative values (blue) displacement towards posterior direction. Medial to lateral: positive values (red) displacement towards lateral direction, negative values (blue) displacement towards medial direction. Distal to proximal: positive values (red) displacement towards proximal direction, negative values (blue) displacement towards distal direction. The white arrows show locally on the mesh the directions of the vertexes displacement. Directions are labeled in the figure. M: medial, L: lateral, A: anterior P: posterior

References

    1. Hunter DJ, Lohmander LS, Makovey J, Tamez-Peña J, Totterman S, Schreyer E, et al. The effect of anterior cruciate ligament injury on bone curvature: exploratory analysis in the KANON trial. Osteoarthritis Cartilage. 2014;22:959–68. - PubMed
    1. Myer GD, Ford KR, Hewett TE. New method to identify athletes at high risk of ACL injury using clinic-based measurements and freeware computer analysis. Br J Sports Med. 2011;45:238–44. - PMC - PubMed
    1. Myer GD, Ford KR, Khoury J, Succop P, Hewett TE. Clinical correlates to laboratory measures for use in non-contact anterior cruciate ligament injury risk prediction algorithm. Clin Biomech. 2010;25:693–99. - PMC - PubMed
    1. Beynnon BD. Risk factors for anterior cruciate ligament injury: a review of the literature - part 1: neuromuscular and anatomic risk. Sports Health. 2012;4:69–78. - PMC - PubMed
    1. Hashemi J, Chandrashekar N, Beynnon BD, Slauterbeck JR, Schutt RC. The geometry of the tibial plateau and its influence on the biomechanics of the tibiofemoral joint. J Bone Joint Surg Am. 2008;90:2724–34. - PMC - PubMed

Publication types