. 2015 Jul;36(7):791-9.
doi: 10.1038/aps.2015.26. Epub 2015 Jun 8.

Inhibition of Nav1.7 channels by methyl eugenol as a mechanism underlying its antinociceptive and anesthetic actions

Affiliations

Inhibition of Nav1.7 channels by methyl eugenol as a mechanism underlying its antinociceptive and anesthetic actions

Ze-Jun Wang et al. Acta Pharmacol Sin. 2015 Jul.

Abstract

Aim: Methyl eugenol is a major active component extracted from the Chinese herb Asari Radix et Rhizoma, which has been used to treat toothache and other pain. Previous in vivo studies have shown that methyl eugenol has anesthetic and antinociceptive effects. The aim of this study was to determine the possible mechanism underlying its effect on nervous system disorders.

Methods: The direct interaction of methyl eugenol with Na(+) channels was explored and characterized using electrophysiological recordings from Nav1.7-transfected CHO cells.

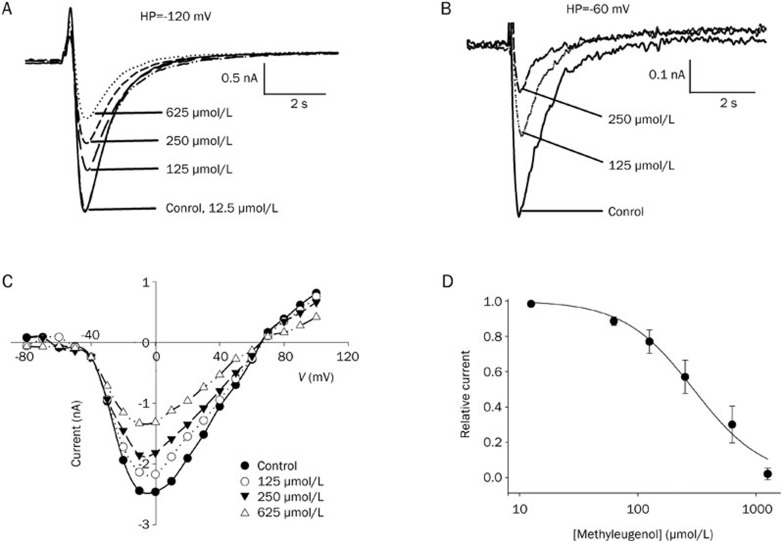
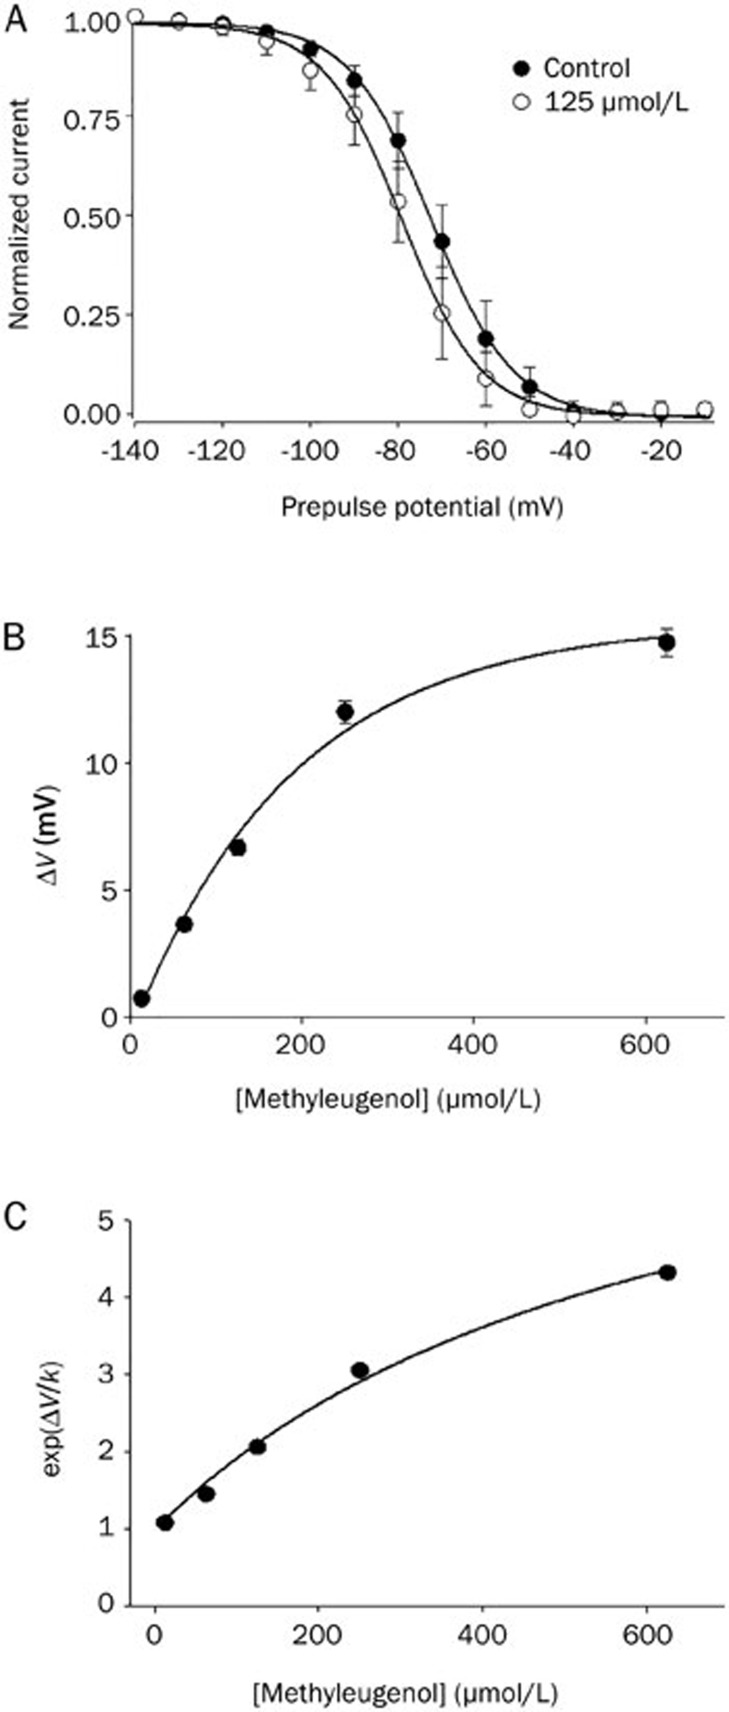
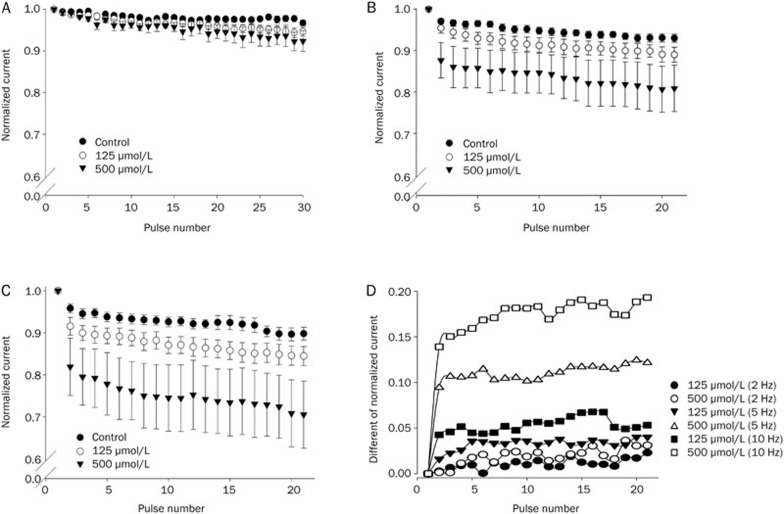
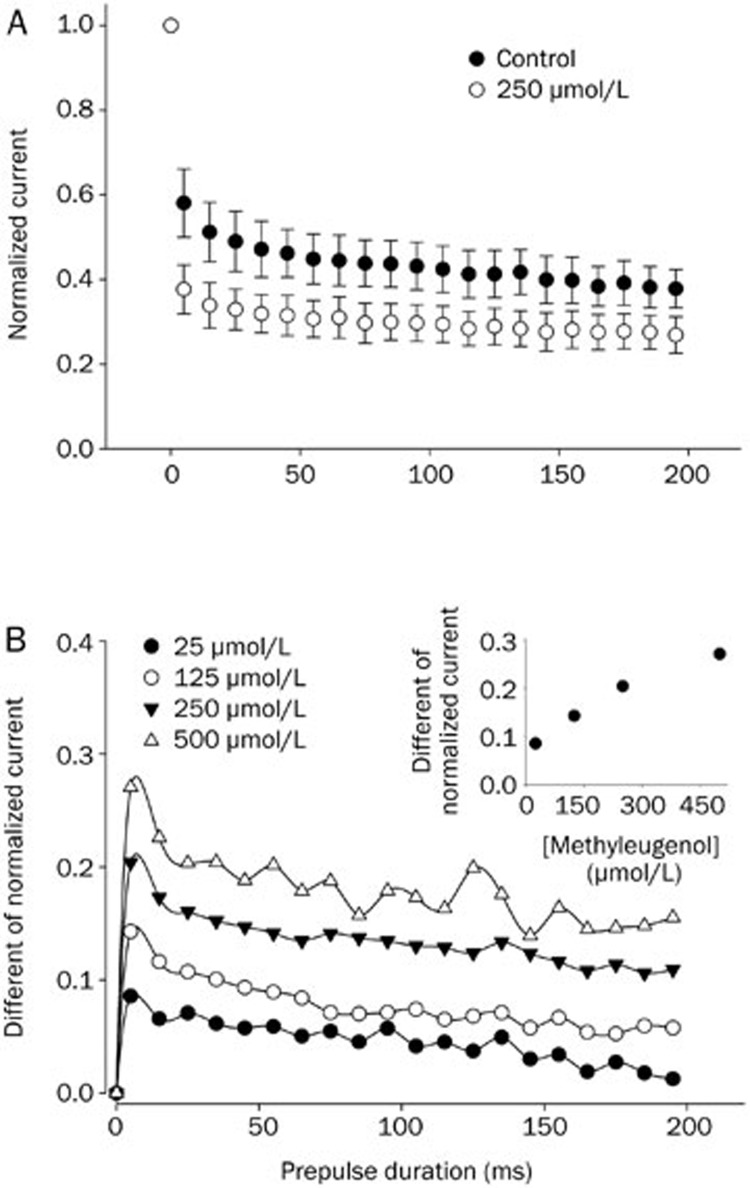
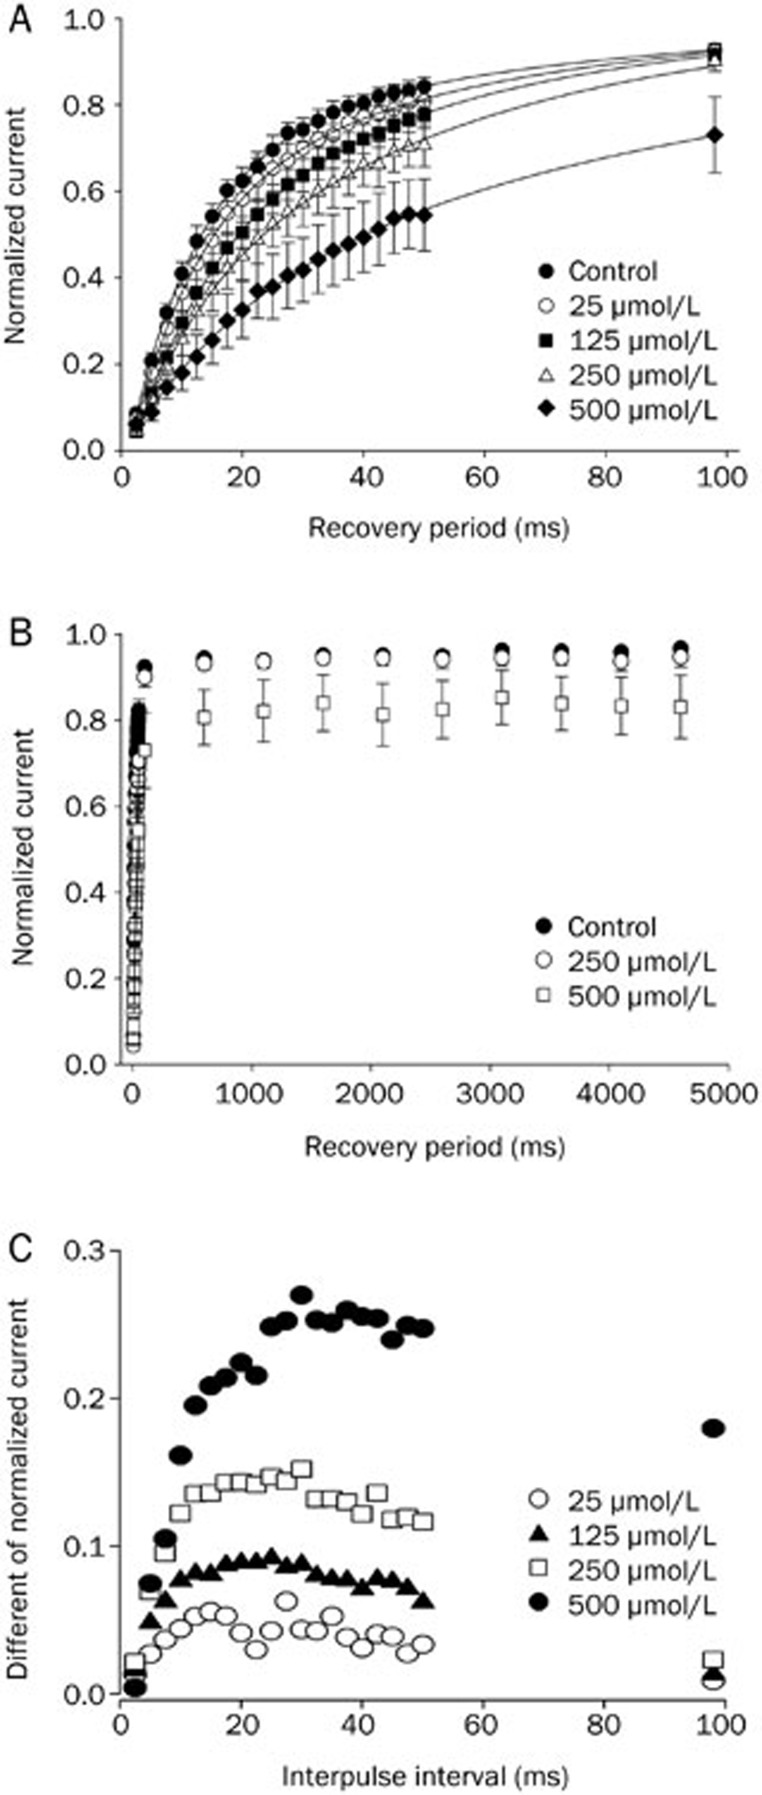
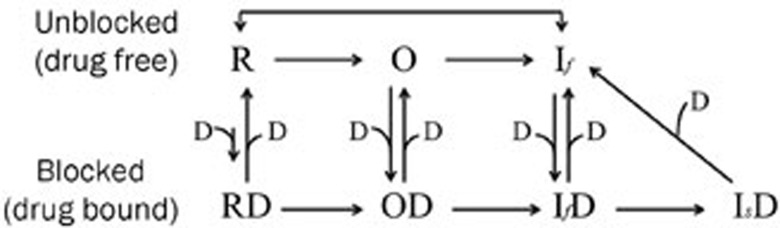
Results: In whole-cell patch clamp mode, methyl eugenol tonically inhibited peripheral nerve Nav1.7 currents in a concentration- and voltage-dependent manner, with an IC50 of 295 μmol/L at a -100 mV holding potential. Functionally, methyl eugenol preferentially bound to Nav1.7 channels in the inactivated and/or open state, with weaker binding to channels in the resting state. Thus, in the presence of methyl eugenol, Nav1.7 channels exhibited reduced availability for activation in a steady-state inactivation protocol, strong use-dependent inhibition, enhanced binding kinetics, and slow recovery from inactivation compared to untreated channels. An estimation of the affinity of methyl eugenol for the resting and inactivated states of the channel also demonstrated that methyl eugenol preferentially binds to inactivated channels, with a 6.4 times greater affinity compared to channels in the resting state. The failure of inactivated channels to completely recover to control levels at higher concentrations of methyl eugenol implies that the drug may drive more drug-bound, fast-inactivated channels into drug-bound, slow-inactivated channels.

Conclusion: Methyl eugenol is a potential candidate as an effective local anesthetic and analgesic. The antinociceptive and anesthetic effects of methyl eugenol result from the inhibitory action of methyl eugenol on peripheral Na(+) channels.


Figures

Figure 1
Figure 1
Tonic inhibition by methyl eugenol of Nav1.7 channels. (A, B) Concentration-dependent tonic inhibition by methyl eugenol of Nav1.7 channels in the resting state (holding potential at −120 mV) and inactivated state (holding potential at −60 mV). The current traces of Nav1.7 channels recorded in control conditions and in the presence of varying concentrations of methyl eugenol are superimposed for the resting and inactivated states, respectively. The data are from the same representative cell. The currents were elicited using a 30-ms pulse to 0 mV from a holding potential of −120 mV or −60 mV. (C) Current-voltage relationships in the absence or presence of various concentrations of methyl eugenol were determined by stepping to various depolarized potentials (ranging from −80 to +100 mV in 10 mV increments) for 9 ms from a holding potential of −100 mV. (D) Concentration-response curve for the inhibition of Na+ current by methyl eugenol. The cells were held at −100 mV and stepped to 0 mV for 10 ms. The peak current in the presence of methyl eugenol were normalized to the control peak current, and then averaged. Each point was the mean±SEM of 4–8 cells. The lines represent the best fit for the data to the equation: y=1−xn/(Kdn+xn), where y is the fractional current, Kd is the apparent dissociation constant for methyl eugenol, and n is the Hill coefficient. Kd and n were estimated using a Marquadt nonlinear least-squares procedure.
Figure 2
Figure 2
The effects of methyl eugenol on the voltage-dependent inactivation of Nav1.7 channels and the estimation of methyl eugenol affinities. (A) The shift in the inactivation curve of Nav1.7 by 125 μmol/L methyl eugenol (n=5) is shown. The voltage dependence of steady-state inactivation (h) was examined by applying 500-ms prepulse potentials from −140 mV to −10 mV in 10-mV increments from a holding potential of −100 mV before stepping to the test potential (0 mV) for 35 ms. The peak current (I) for each cell was normalized with respect to the first value measured at the test potential (0 mV). The line through the data conforms to the equation: y=1−1/{1−exp[(V−Vh)/k]}, where V is the membrane potential, Vh is the prepulse potential where the current is half-maximal, and k is the slope factor. (B) Concentration-dependent shift of the midpoint of inactivation (ΔV) caused by 12.5, 62.5, 125, 250, and 625 μmol/L methyl eugenol for Nav1.7 (n=4–9). The line fits to a monoexponential equation. The mean Vh at different concentrations of methyl eugenol was obtained by fitting a Boltzmann relationship as described above. (C) The data were fitted by: exp(ΔV/k)=[1+(D/KI)]/[1+(D/KR)], where ΔV and k are the shift in the midpoint of the inactivation curve and the slope factor, D is the concentration of methyl eugenol, and KI and KR are the dissociation constants for the inactivated and resting states.
Figure 3
Figure 3
Use-dependent inhibition of Nav1.7 by methyl eugenol. Cells were held at −100 mV and stimulated with a train of 5-ms pulses to 0 mV at a frequency of 2 Hz (A), 5 Hz (B), and 10 Hz (C) in the absence or presence of methyl eugenol. For each experiment, the current amplitudes were normalized with respect to the current evoked by the first pulse in the train [I(pulse n)/I(pulse 1)]. For all 3 stimulus frequencies (2, 5, and 10 Hz), n=8 (control), 8 (125 μmol/L) and 4 (500 μmol/L). (D) The differences between the normalized currents in methyl eugenol and control at 2, 5, and 10 Hz were calculated. The data are from (A, B, and C).
Figure 4
Figure 4
The binging of methyl eugenol on the development of inactivation in Nav1.7 channels. (A) A conditioning prepulse was applied to 0 mV from −100 mV for varying durations (5–195 ms) followed by a 10-ms gap to −100 mV, then followed by the application of a test pulse to 0 mV (5 ms). The current elicited by the test pulses was normalized with respect to the first test current elicited by a 5-ms prepulse. The normalized currents were averaged and plotted against the prepulse duration. The fraction of current decay was fitted to a double exponential function (control: n=5; in methyl eugenol: n=5). (B) The difference between the averaged normalized current for Nav1.7 channels in the absence and presence of methyl eugenol is shown. The insert illustrates the relationship between the various concentrations of methyl eugenol and the corresponding maximal response with a 5-ms prepulse.
Figure 5
Figure 5
The effects of various concentrations of methyl eugenol on the recovery from inactivation of Na+ channels. The recovery from inactivation was measured with a two-pulse protocol that consisted of a 100-ms conditioning pulse to 0 mV from a −100 mV holding potential, followed by an interpulse interval of varying duration at a −100 mV holding potential, then a test pulse to 0 mV for 10 ms. The amplitude of the current elicited by the test pulses was normalized with respect to the current elicited by the conditioning pulses in each series and were plotted as a function of the recovery interval. (A) Methyl eugenol slowed the recovery rate from inactivation. An interpulse interval of 2.5–100 ms was used to show more clearly the initial slowing effect. The data fit to a double exponential function according to the equation y=1−A exp(t1)−B exp(t2), where y is the normalized current, A, B are the amplitudes of the corresponding components, t is the interpulse interval, and τ1 and τ2 are time constants for recovery. (B) Methyl eugenol slowed the rate of recovery from inactivation with an interpulse interval of varying duration (2.5–5000 ms), while a higher concentration of methyl eugenol (500 μmol/L) produced an incomplete recovery of inactivated Nav1.7 channels. (C) The differences between the normalized currents in the presence of various concentrations of methyl eugenol and the corresponding normalized control currents are shown. Data are from (A).
Figure 6
Figure 6
The model of methyl eugenol action on peripheral Na+ channels. Drugs (D) can bind to Na+ channels in the resting (R), open (O) and fast-inactivated (If) states. The drug-bound fast-inactivated state can switch into a drug-bound slow-inactivated state (Is) under certain conditions.

Similar articles

Cited by

References

    1. Chinese Pharmacopoeia Committee. Pharmacopoeia of the People's Republic of China. Vol I. Beijing: Chemical Industry Press; 2005. p 159.
    1. Li YL, Tian M, Yu J, Shang MY, Cai SQ. Studies on morphology and aristolochic acid analogue constituents of Asarum campaniflorum and a comparison with two official species of Asari Radix et Rhizoma. J Nat Med 2010; 64: 442–51. - PubMed
    1. Wang D, Wang X, Xia X. Analysis of season variation of methyleugenol and safrole in Asarum heterotropoides by gas chromatography. Se Pu 1997; 15: 85–6. - PubMed
    1. De Vincenzi M, Silano M, Stacchini P, Scazzocchio B. Constituents of aromatic plants: I. Methyleugenol. Fitoterapia 2000; 71: 216–21. - PubMed
    1. Carlini EA, Dallmeier K, Zelger JL. Methyleugenol as a surgical anesthetic in rodents. Experientia 1981; 37: 588–9. - PubMed

Publication types

LinkOut - more resources