. 2015 Jul 2;59(1):75-88.
doi: 10.1016/j.molcel.2015.05.009. Epub 2015 Jun 4.

Histone Variant H2A.Z.2 Mediates Proliferation and Drug Sensitivity of Malignant Melanoma

Affiliations

Histone Variant H2A.Z.2 Mediates Proliferation and Drug Sensitivity of Malignant Melanoma

Chiara Vardabasso et al. Mol Cell. .

Abstract

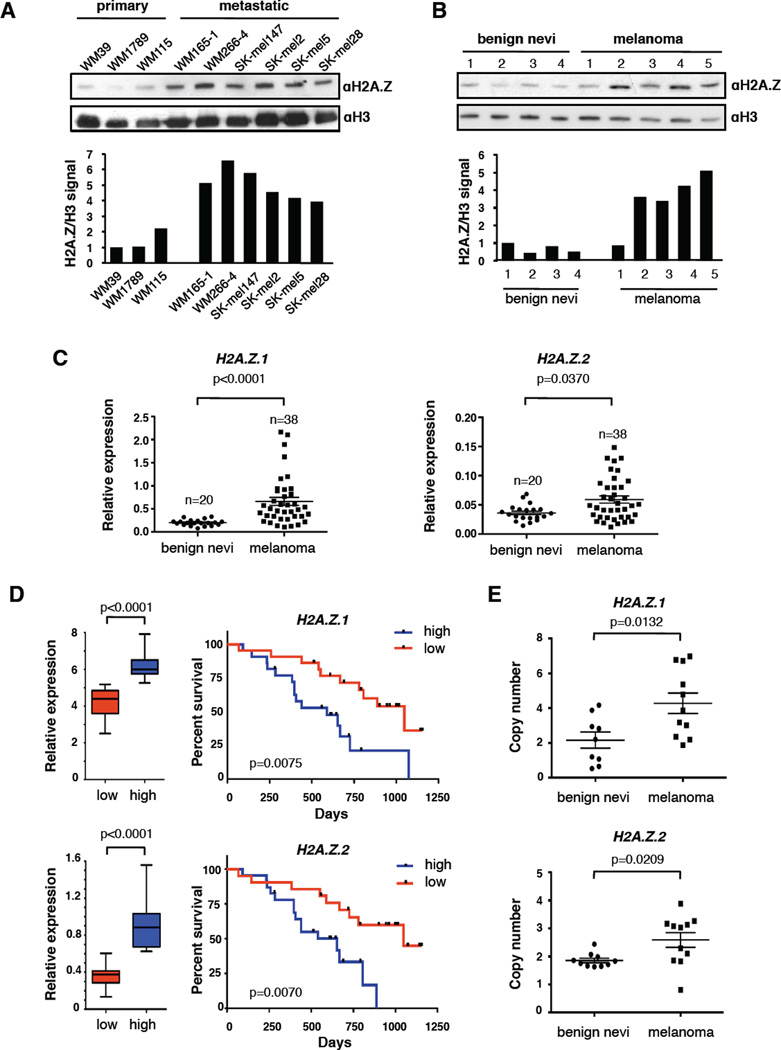
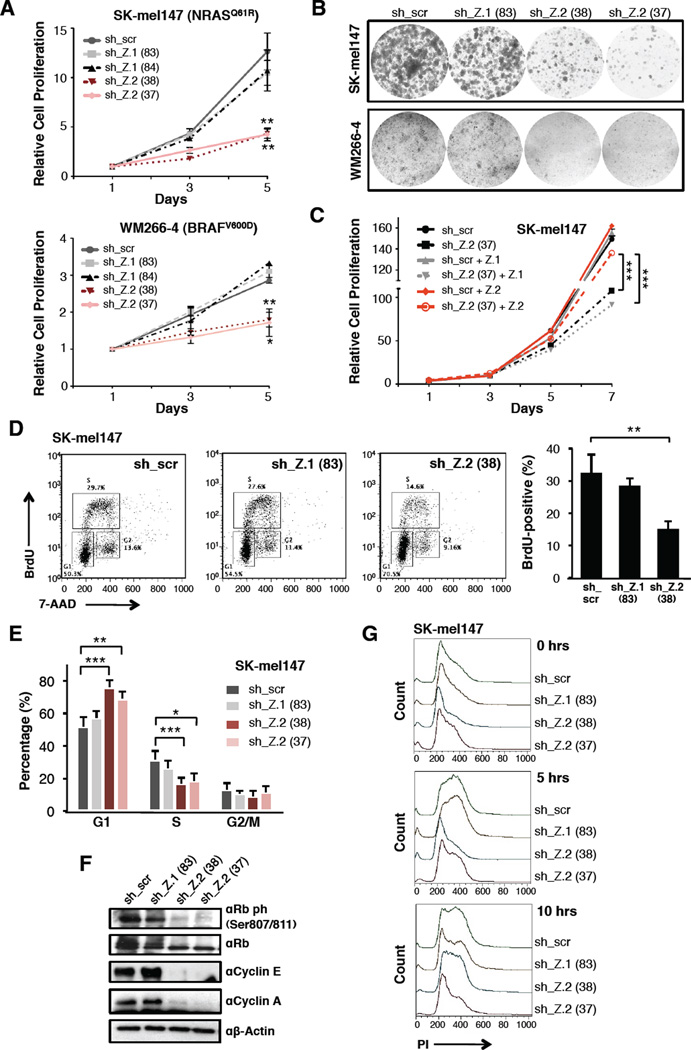
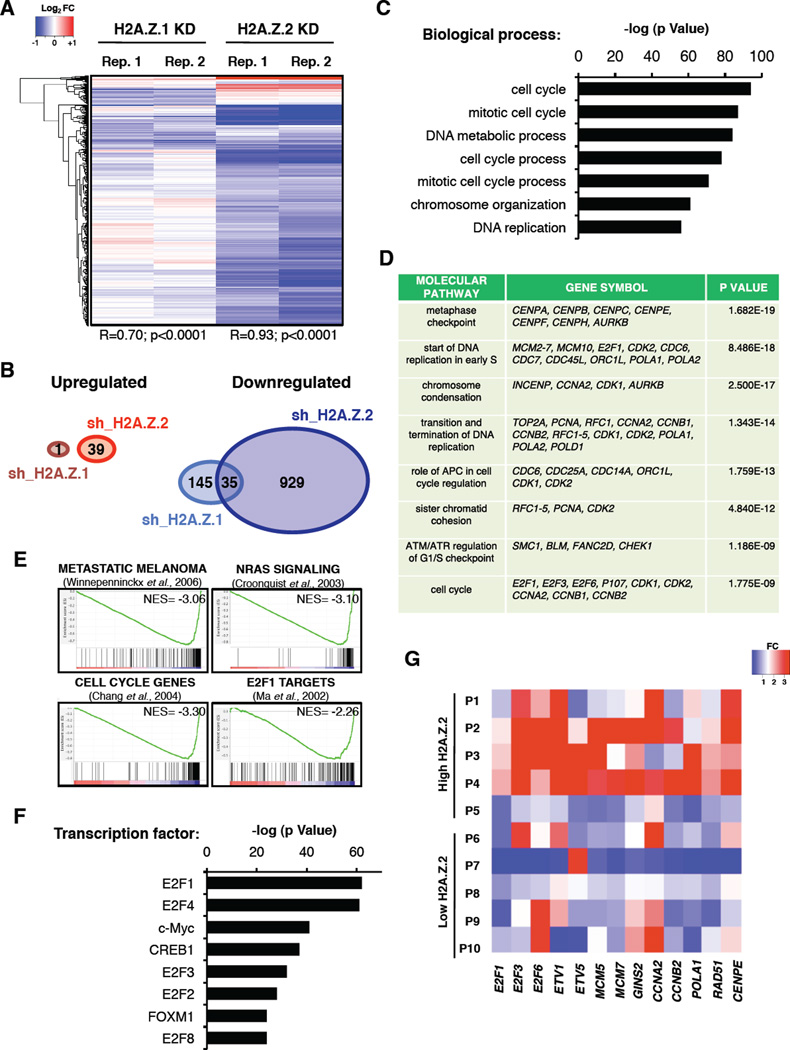
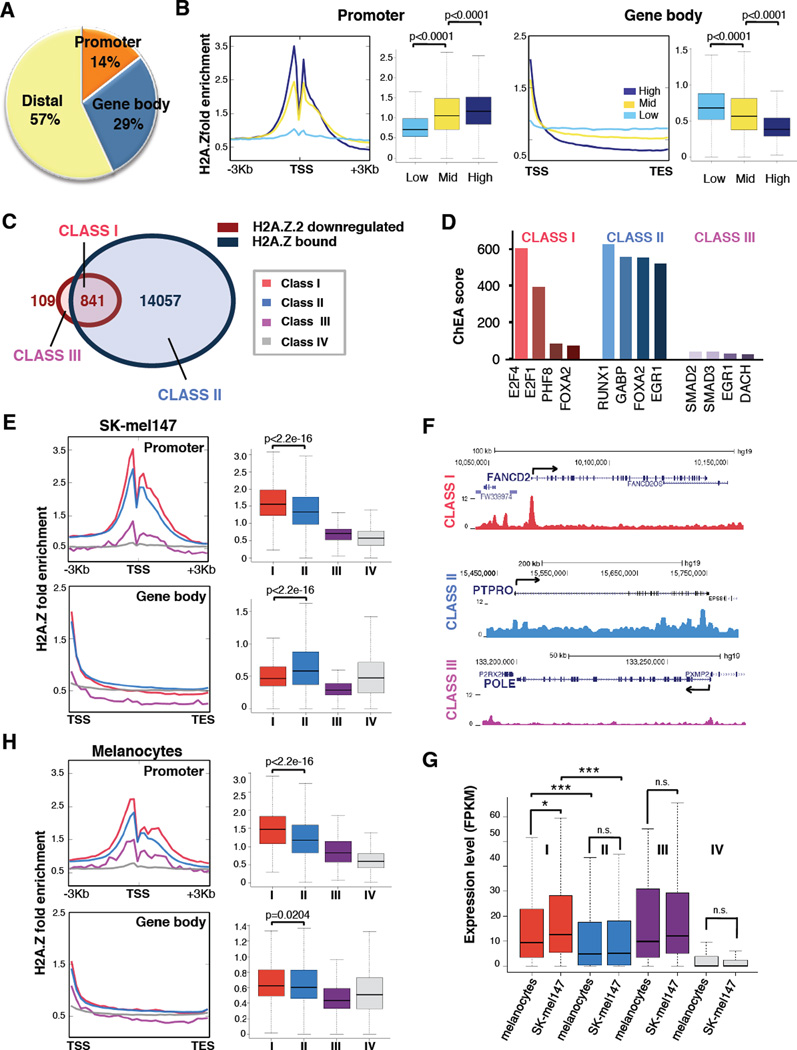
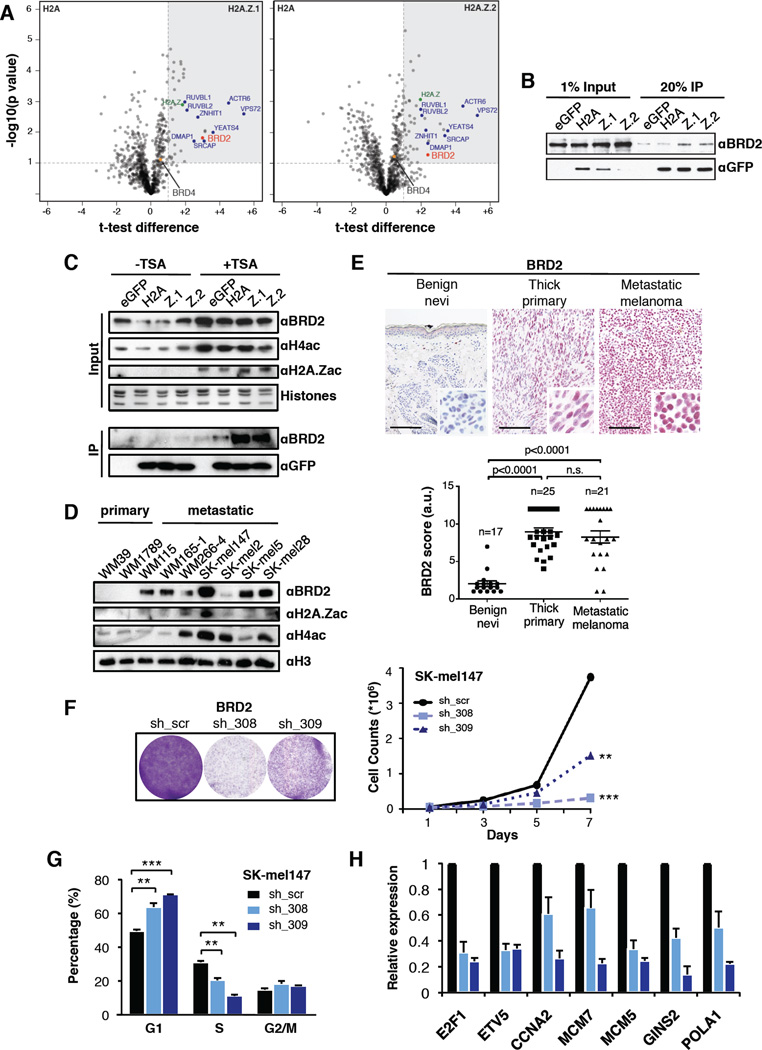
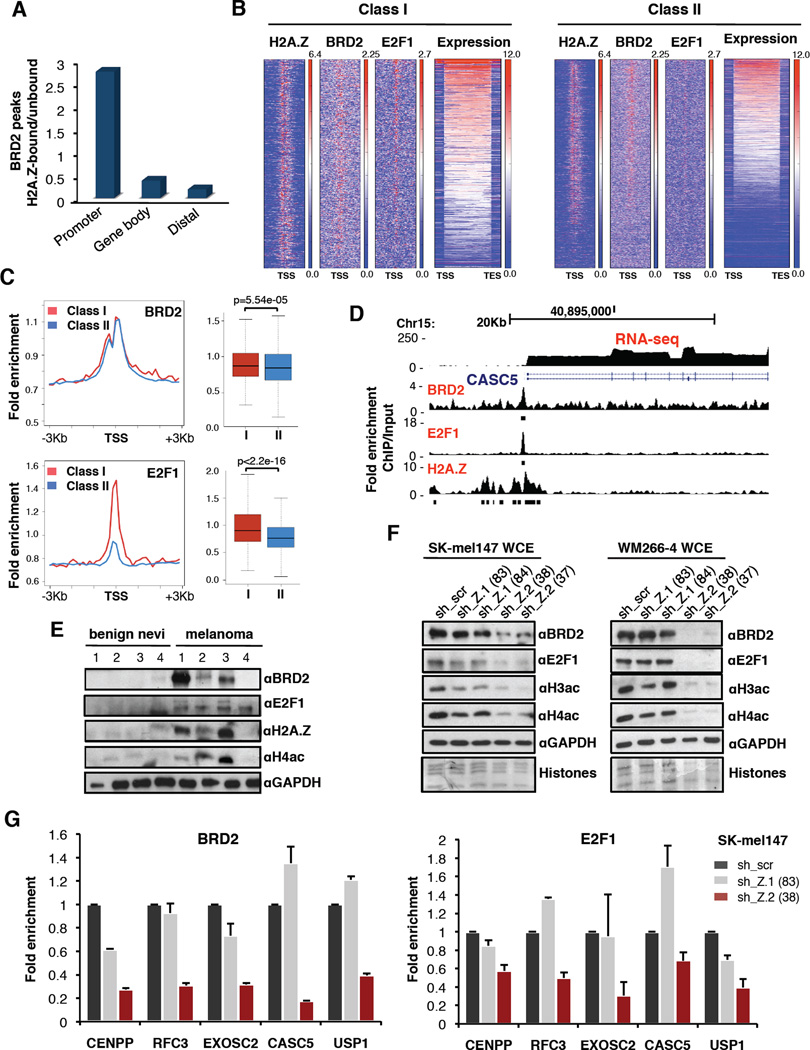
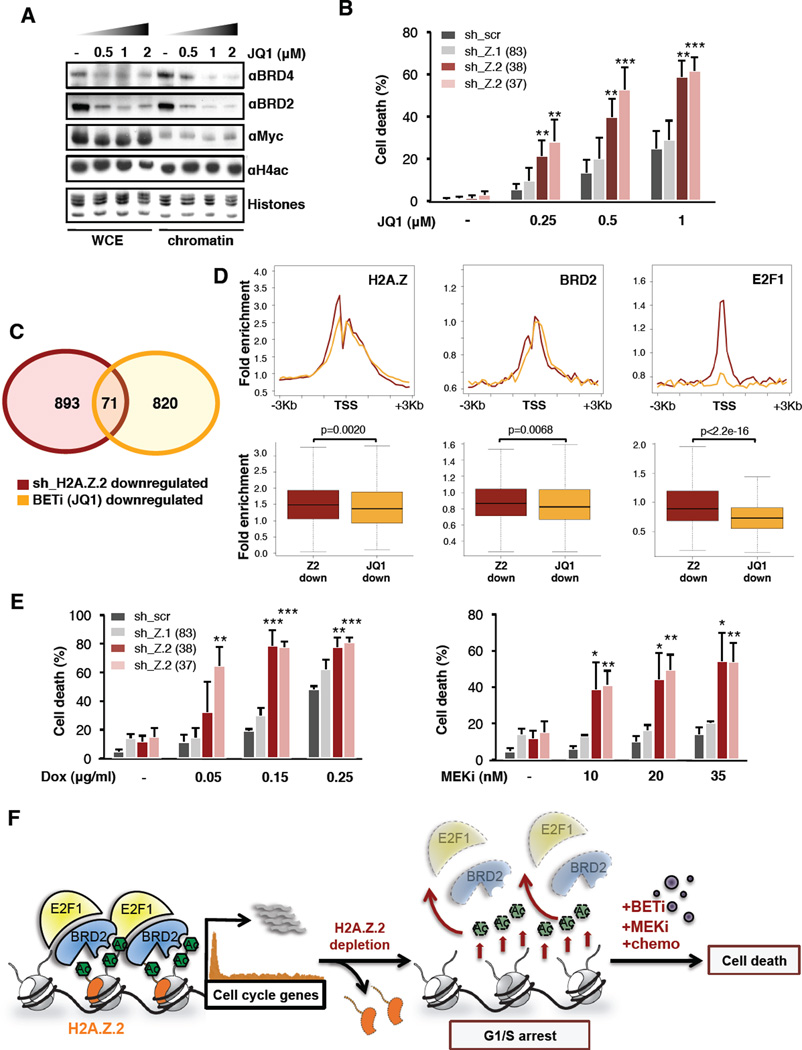
Histone variants are emerging as key regulatory molecules in cancer. We report a unique role for the H2A.Z isoform H2A.Z.2 as a driver of malignant melanoma. H2A.Z.2 is highly expressed in metastatic melanoma, correlates with decreased patient survival, and is required for cellular proliferation. Our integrated genomic analyses reveal that H2A.Z.2 controls the transcriptional output of E2F target genes in melanoma cells. These genes are highly expressed and display a distinct signature of H2A.Z occupancy. We identify BRD2 as an H2A.Z-interacting protein, levels of which are also elevated in melanoma. We further demonstrate that H2A.Z.2-regulated genes are bound by BRD2 and E2F1 in an H2A.Z.2-dependent manner. Importantly, H2A.Z.2 deficiency sensitizes melanoma cells to chemotherapy and targeted therapies. Collectively, our findings implicate H2A.Z.2 as a mediator of cell proliferation and drug sensitivity in malignant melanoma, holding translational potential for novel therapeutic strategies.


Figures

Figure 1
Figure 1. H2A.Z.1 and H2A.Z.2 are overexpressed in melanoma
(A) Chromatin extracted from primary and metastatic cell lines probed with H2A.Z antibody; H3 used for loading. Signals quantified by densitometry. See also Figure S1B for mRNA expression. (B) H2A.Z immunoblot of acid extracted histones from fresh frozen human benign nevi and melanoma specimens; H3 used for loading. Signals quantified as in (A). (C) Expression analysis by qRT-PCR of H2A.Z.1 and H2A.Z.2 in benign nevi (n=20) and melanoma (n=38). Values normalized to GAPDH; mean ± SEM. Mann-Whitney test (two-tailed). (D) Survival of melanoma patients with high and low (above or below the median, respectively) mRNA levels of H2A.Z.1 and H2A.Z.2. Gene expression data of 44 metastatic melanoma tissues (Bogunovic et al., 2009) were used to define high and low expressor groups (boxplots, Mann-Whitney test) and to generate Kaplan-Meier curves (log-rank test). (E) Analysis of H2A.Z.1 and H2A.Z.2 gene copy number by qPCR of a subset of benign nevi and melanoma in (C), relative to primary melanocytes. Data are mean ± SEM; unpaired Student’s test (two-tailed). See also Figure S1D, E.
Figure 2
Figure 2. H2A.Z.2 depletion induces G1/S arrest in melanoma cells
(A) Proliferation curves of SK-mel147 and WM266-4 cells expressing control and isoform-specific shRNAs as shown. Data are mean ± SEM (n≥3); two-way ANOVA. See also Figure S2D. (B) Colony formation assays of SK-mel147 and WM266-4 cells expressing shRNAs as in (A). (C) Proliferation assay of SK-mel147 cells expressing H2A.Z.1, shRNA-resistant H2A.Z.2, or empty vector control. Each line was infected with H2A.Z.2 shRNA (sh_37) and with sh_scr. Data are mean ± SEM (n=2); two-way ANOVA. (D) BrdU staining of SK-mel147 cells expressing shRNAs as in (A). Profiles from one representative experiment are displayed. BrdU-positive S phase cells are shown as mean values ± SD (n≥3) (right); unpaired Student’s test (two-tailed). See also Figure S2G. (E) Percentage of SK-mel147 in G1, S or G2/M phases, as revealed by PI incorporation. Values are mean ± SD (n≥3); unpaired Student’s test (two-tailed). Asterisks as follows, in all figures: *p<0.05, **p<0.01, ***p<0.001. See also Figure S2F. (F) Whole-cell extracts from shRNA-expressing SK-mel147 cells were immunoblotted for unmodified and phosphorylated Rb and cyclins. B-actin used as loading control. (G) shRNA-expressing SK-mel147 cells were synchronized at early S phase by a double thymidine block and cell synchrony monitored by flow cytometry of PI stained cells at 5 hour intervals. Flow cytometry profiles from a representative experiment are shown.
Figure 3
Figure 3. H2A.Z.2 regulates cell cycle promoting genes
(A) Gene expression profiles of SK-mel147 cells upon H2A.Z.1 and H2A.Z.2 knock down (day 8 post infection). Two biological replicates (with Pearson correlation), and genes displaying a significant (lfdr<0.2) change in each replicate are shown. (B) Venn diagrams exhibiting the numbers of genes that are significantly up- and downregulated upon H2A.Z.1 and H2A.Z.2 knock down in SK-mel147 cells. See also Figure S3A, B. (C) Functional annotation (biological process) of genes downregulated upon H2A.Z.2 knock down in SK-mel147 cells. Enriched groups are ranked by the most significant p value. (D) Functional annotation (molecular pathways) of genes as described in (C). Selected genes belonging to each pathway are shown. p value indicated. (E) GSEA plots of genes altered upon H2A.Z.2 knock down in SK-mel147 show negative correlation gene signatures as shown. FDR=0.0; NES (Normalized Enrichment Score) as indicated. (F) TF regulation analysis of genes as described in (C). Enriched groups are ranked by the most significant p value. Analyses for panels (C, D, F) were performed with MetaCore. See also Figure S3C–E. (G) Heatmap generated by qRT-PCR values of the indicated genes in a subset of melanoma specimens (P1-P10) from Figure 1C. P1–P5 = high H2A.Z.2 and P6–P10 = low H2A.Z.2 expression levels (above and below the median, respectively). Expression levels of each gene are shown as fold change (FC) relative to one patient (not shown).
Figure 4
Figure 4. A unique signature of H2A.Z occupancy at H2A.Z.2-regulated genes
(A) Pie chart displaying the percentages of H2A.Z peaks occupying promoters, gene bodies and distal regions. Promoters: −3Kb < TSS < +1Kb; Gene bodies: from +1Kb > TSS to TES; all other regions defined as distal. (TSS: Transcription Start Site; TES: Transcription End Site). (B) Correlation of H2A.Z signals at the promoter or gene body with mRNA expression levels. Genes were divided by expression level into high (top 25%), medium (middle 50%) and low (bottom 25%) from RNA-sequencing data. Fold enrichment profiles (sliding 100 bp window) and boxplots were calculated around the TSS (−3kb, +3Kb) and over the gene body (TSS to TES) for each group; Mann Whitney test (two-tailed). (C) Venn diagrams displaying H2A.Z.2 downregulated genes and H2A.Z bound genes by ChIP-seq in SK-mel147. Class I (downregulated in H2A.Z.2 knock down and bound by H2A.Z, red); Class II (bound by H2A.Z but unaffected by H2A.Z.2 knock down, light blue); Class III (downregulated by H2A.Z.2 knock down but not bound by H2A.Z, purple); Class IV (11,003 genes that are not downregulated by H2A.Z.2 knock down and not bound, grey). (D) ChIP Enrichment Analysis tool (ChEA2) analysis of Class I, Class II and Class III genes (as defined and color coded in panel A). The ChEA2 database contains ChIP-seq data of 200 transcription factors from 221 publications for a total of 458,471 TF-target interactions (Kou et al., 2013). Transcription factors are ranked by ChEA combined score. (E) H2A.Z occupancy at the promoter and gene body of the four classes of genes defined in (C), in SK-mel147 cells. Profiles and boxplots represent fold enrichment over input. Mann Whitney test (two-tailed). (F) Captures of the UCSC genome browser (GRCh37/hg19) showing the ChIP-seq profiles for H2A.Z for genes belonging to each of the classes defined in (C). RefSeq annotated genes are displayed on top. (G) Boxplot representing expression levels (FPKM) for each gene class as in (C), in primary melanocytes and in SK-mel147. Mann Whitney test (two-tailed). Two-way ANOVA. (H) H2A.Z occupancy at the promoter and gene body of the four classes of genes defined in (C) in primary melanocytes (as in (C)).
Figure 5
Figure 5. BRD2 interacts with H2A.Z-containing nucleosomes and is overexpressed in melanoma
(A) Volcano plots of label-free interactions of eGFP-H2A.Z.1- or eGFP-H2A.Z.2-containing nucleosomes. Significantly enriched proteins over eGFP-H2A containing nucleosomes are shown in the upper right box (grey shading). Members of the H2A.Z-specific chaperone/remodeling complex SRCAP are highlighted in blue, H2A.Z in green, BRD2 and BRD4 as red and orange dots, respectively. See also Figure S5A–C. (B) Immunoblots for BRD2 and GFP upon immunoprecipitation of mononucleosomes generated from SK-mel147 cells expressing eGFP, eGFP-H2A, -H2A.Z.1 or -H2A.Z.2. (C) SK-mel147 cells as in (B) were treated with DMSO or TSA (200nM for 2 hours), and chromatin was probed for BRD2, H4ac, and H2A.Zac (upper panels). Histones used for loading. (Bottom) Immunoblots for BRD2 and GFP upon immunoprecipitation are shown. (D) Chromatin extracted from primary and metastatic cell lines probed with BRD2, H2A.Zac and H4ac antibodies; H3 used for loading. See also Figure 1A. (E) IHC for BRD2 in representative intradermal nevi, thick primary, and metastatic melanoma tissue. Images at 20× magnification; insets at 40× magnification. Scale bar represents 100 µm. Scores derived by multplying the number of positively stained cells (1–4) by intensity of stain (1–3); Mann-Whitney (two-tailed). (F) Colony formation and proliferation assays of SK-mel147 cells expressing control or BRD2 shRNAs as shown. Data are mean ± SEM (n≥2); two-way ANOVA. (G) Percentage of SK-mel147 cells in G1, S or G2 phases, as shown by PI incorporation. Values are mean ± SD (n≥3); unpaired Student’s test (two-tailed). (H) Expression of a handful of Class I genes was analyzed by qRT-PCR upon BRD2 knock down. Expression is shown normalized to GAPDH and relative to scrambled shRNA. Mean ± SD is shown (n≥3).
Figure 6
Figure 6. An H2A.Z.2-BRD2-E2F1 axis in melanoma
(A) Histograms of the ratio between BRD2 peaks bound by H2A.Z and BRD2 peaks not bound by H2A.Z at promoters, gene bodies and distal regions as defined in Figure 4A. (B) Heatmaps of promoters (−3Kb, +3Kb) of Class I and Class II genes based on H2A.Z, BRD2 and E2F1 fold enrichment over input, and ranked by expression level. Expression is indicated as log2 RNA-seq signal. See also Figure S6B. (C) BRD2 and E2F1 occupancy at the promoter Class I and Class II genes in SK-mel147 cells. Profiles and boxplots represent fold enrichment over input. Mann-Whitney test (two-tailed). (D) UCSC genome browser (GRCh37/hg19) capture of 30Kb region of human chromosome 15 depicting a Class I gene. Read counts (normalized fold enrichment of ChIP over input DNA) for BRD2, E2F1 and H2A.Z and FPKM for RNA-seq are shown. RefSeq annotated genes are displayed above. (E) Whole-cell extracts from fresh frozen benign nevi and metastatic specimens probed with BRD2, E2F1, H2A.Z and H4ac antibodies; GAPDH used for loading. (F) Whole-cell extracts from control and isoform-depleted SK-mel147 and WM266-4 cells were immunoblotted for BRD2, E2F1, H3ac and H4ac. GAPDH served as loading control. See also Figure S6C, E. (G) ChIP-qPCR for BRD2 (left) and E2F1 (right) at Class I genes in SK-mel147 expressing control or isoform-specific shRNAs as indicated. Fold enrichment ChIP/input is plotted, relative to scrambled shRNA. One representative experiment shown; values are mean ± SD (n≥2).
Figure 7
Figure 7. H2A.Z.2 deficiency sensitizes melanoma cells to chemotherapy and targeted therapies

References

    1. Alla V, Engelmann D, Niemetz A, Pahnke J, Schmidt A, Kunz M, Emmrich S, Steder M, Koczan D, Putzer BM. E2F1 in melanoma progression and metastasis. J Natl Cancer Inst. 2009;102:127–133. - PubMed
    1. Barski A, Cuddapah S, Cui K, Roh TY, Schones DE, Wang Z, Wei G, Chepelev I, Zhao K. High-resolution profiling of histone methylations in the human genome. Cell. 2007;129:823–837. - PubMed
    1. Belkina AC, Denis GV. BET domain co-regulators in obesity, inflammation and cancer. Nat Rev Cancer. 2012;12:465–477. - PMC - PubMed
    1. Billon P, Cote J. Precise deposition of histone H2A.Z in chromatin for genome expression and maintenance. Biochim Biophys Acta. 2012;1819:290–302. - PubMed
    1. Bogunovic D, O'Neill DW, Belitskaya-Levy I, Vacic V, Yu YL, Adams S, Darvishian F, Berman R, Shapiro R, Pavlick AC, et al. Immune profile and mitotic index of metastatic melanoma lesions enhance clinical staging in predicting patient survival. Proc Natl Acad Sci U S A. 2009;106:20429–20434. - PMC - PubMed

Publication types

MeSH terms

Associated data