. 2015 Jun 17;86(6):1461-77.
doi: 10.1016/j.neuron.2015.05.023. Epub 2015 Jun 4.

Cortical Feedback Decorrelates Olfactory Bulb Output in Awake Mice

Affiliations

Cortical Feedback Decorrelates Olfactory Bulb Output in Awake Mice

Gonzalo H Otazu et al. Neuron. .

Abstract

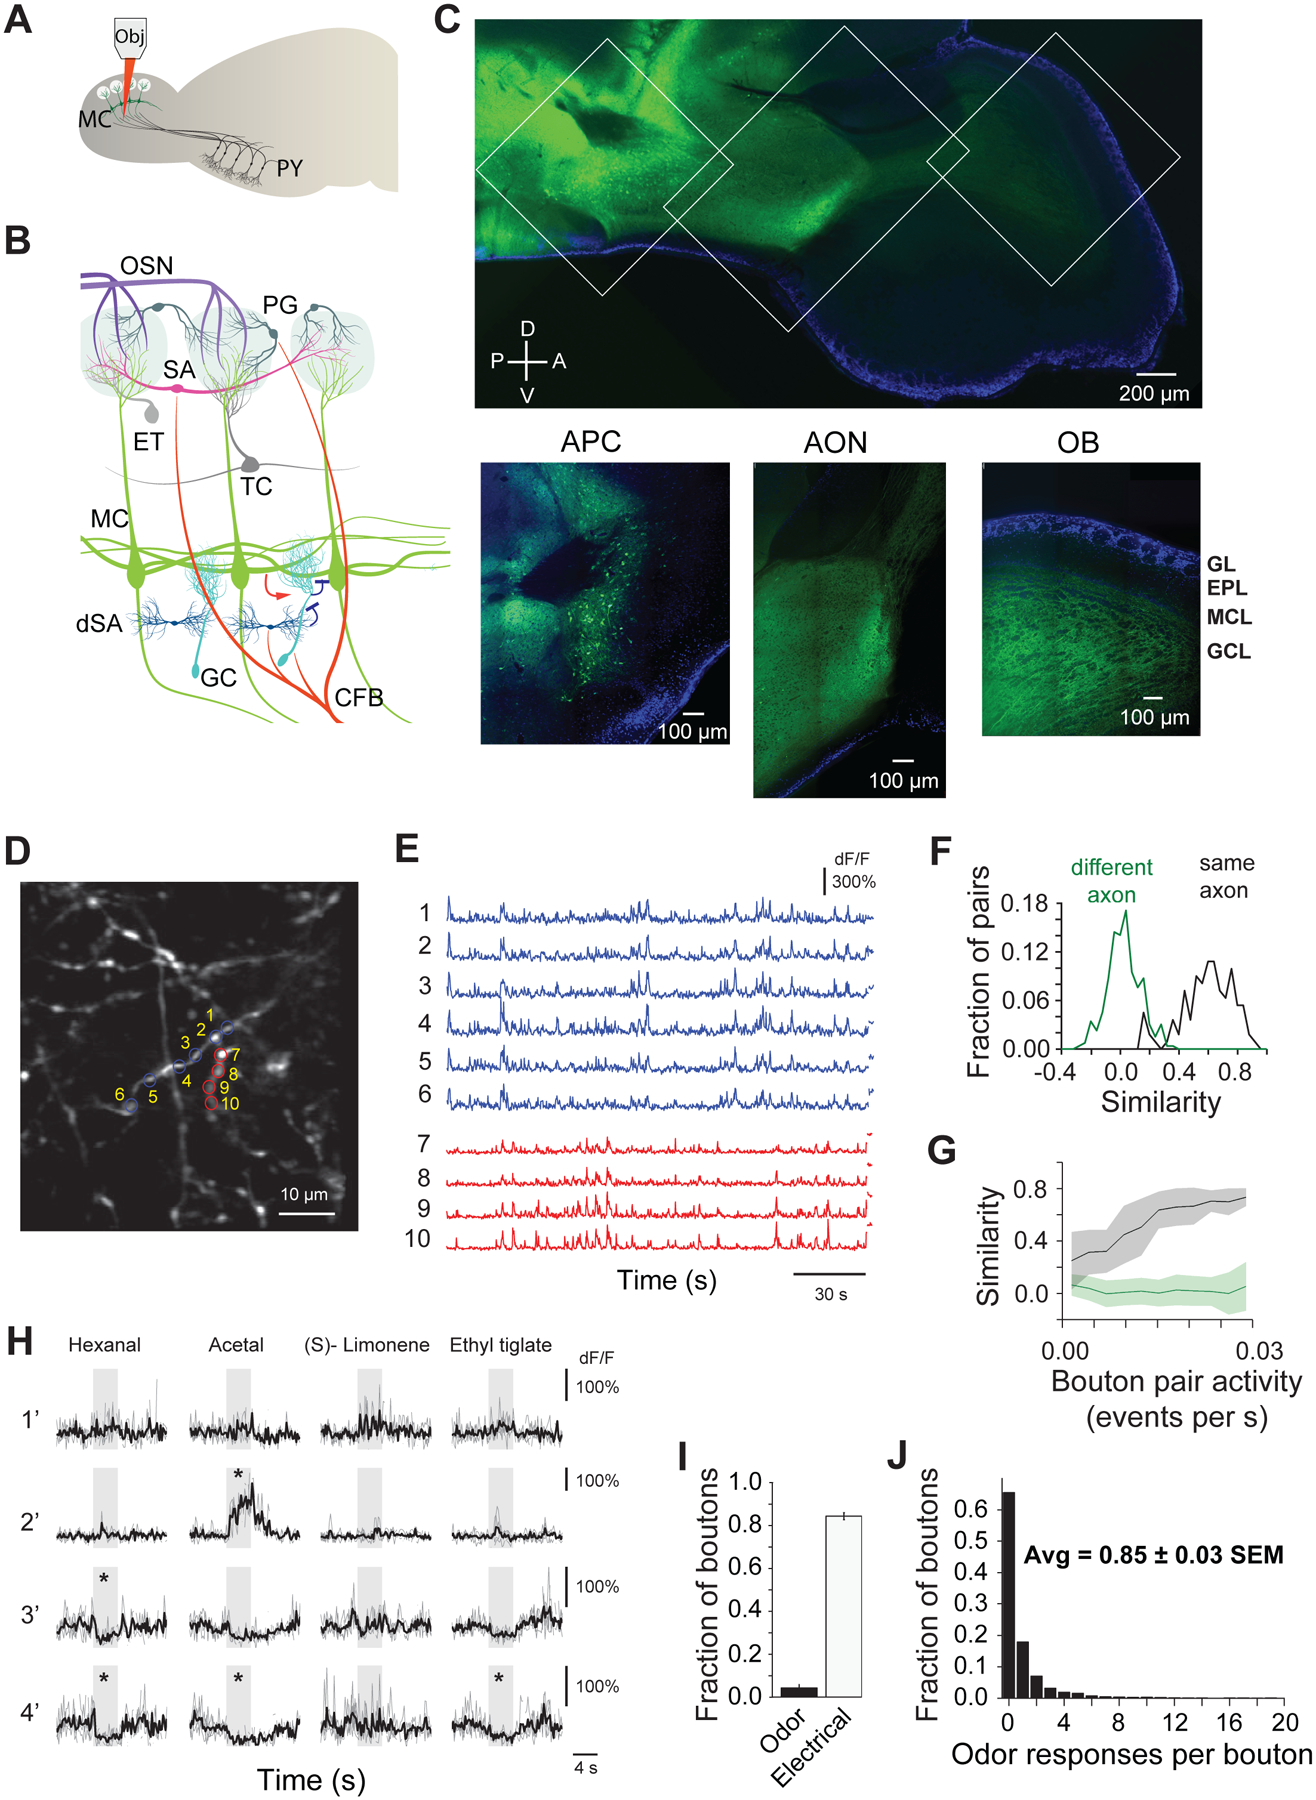
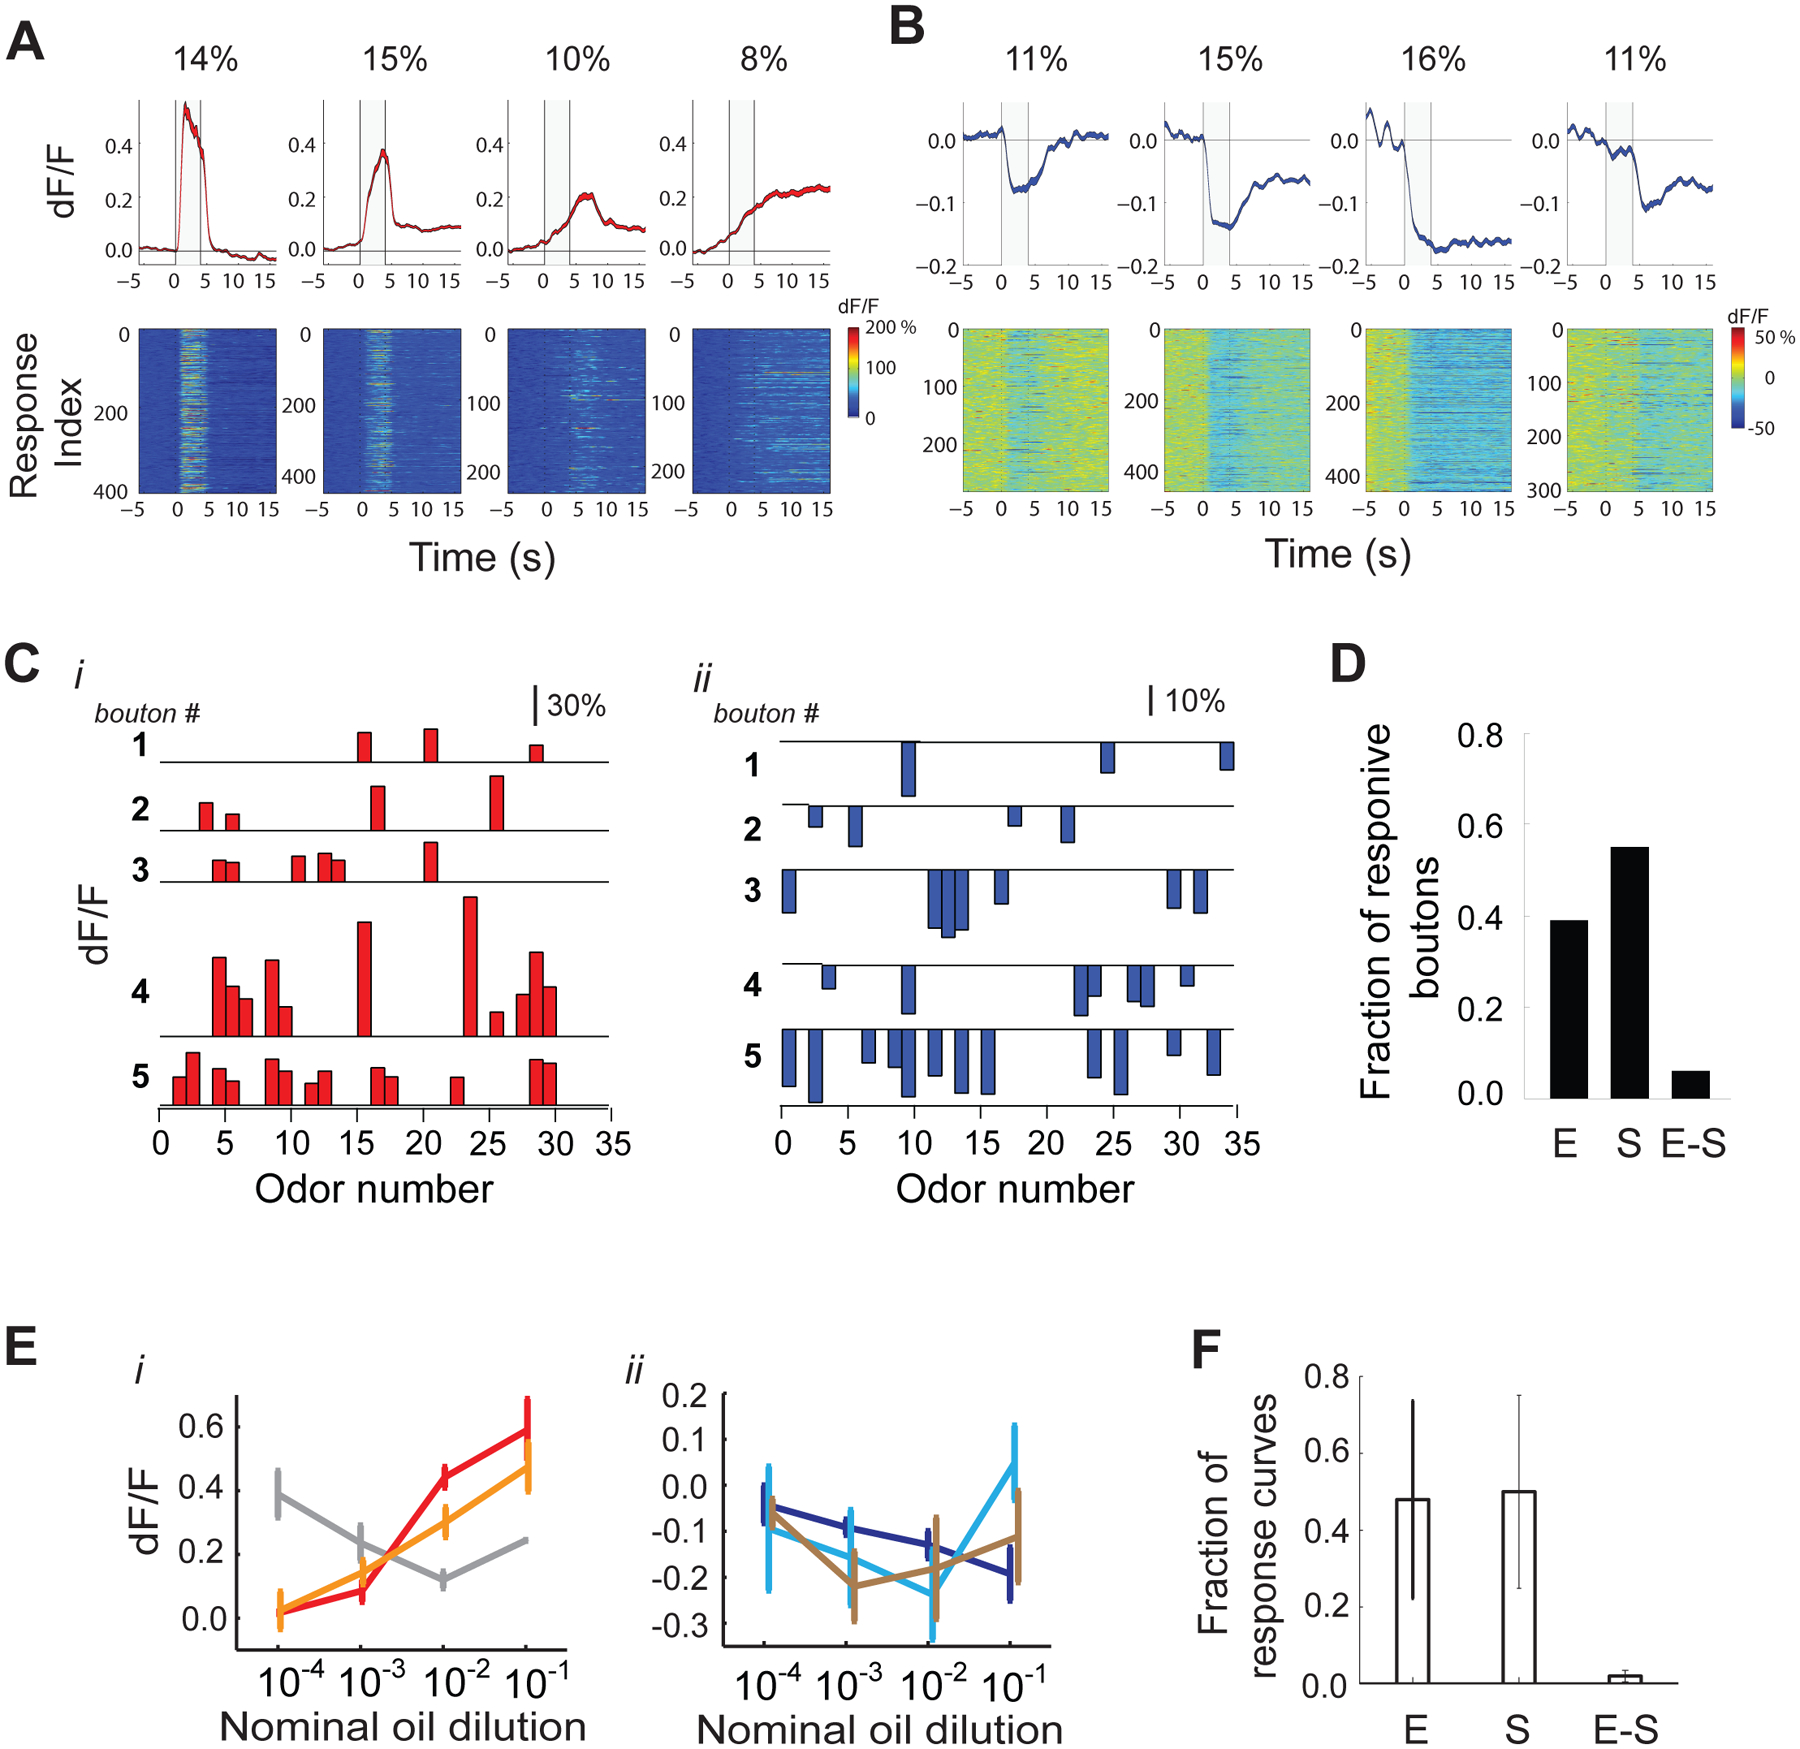
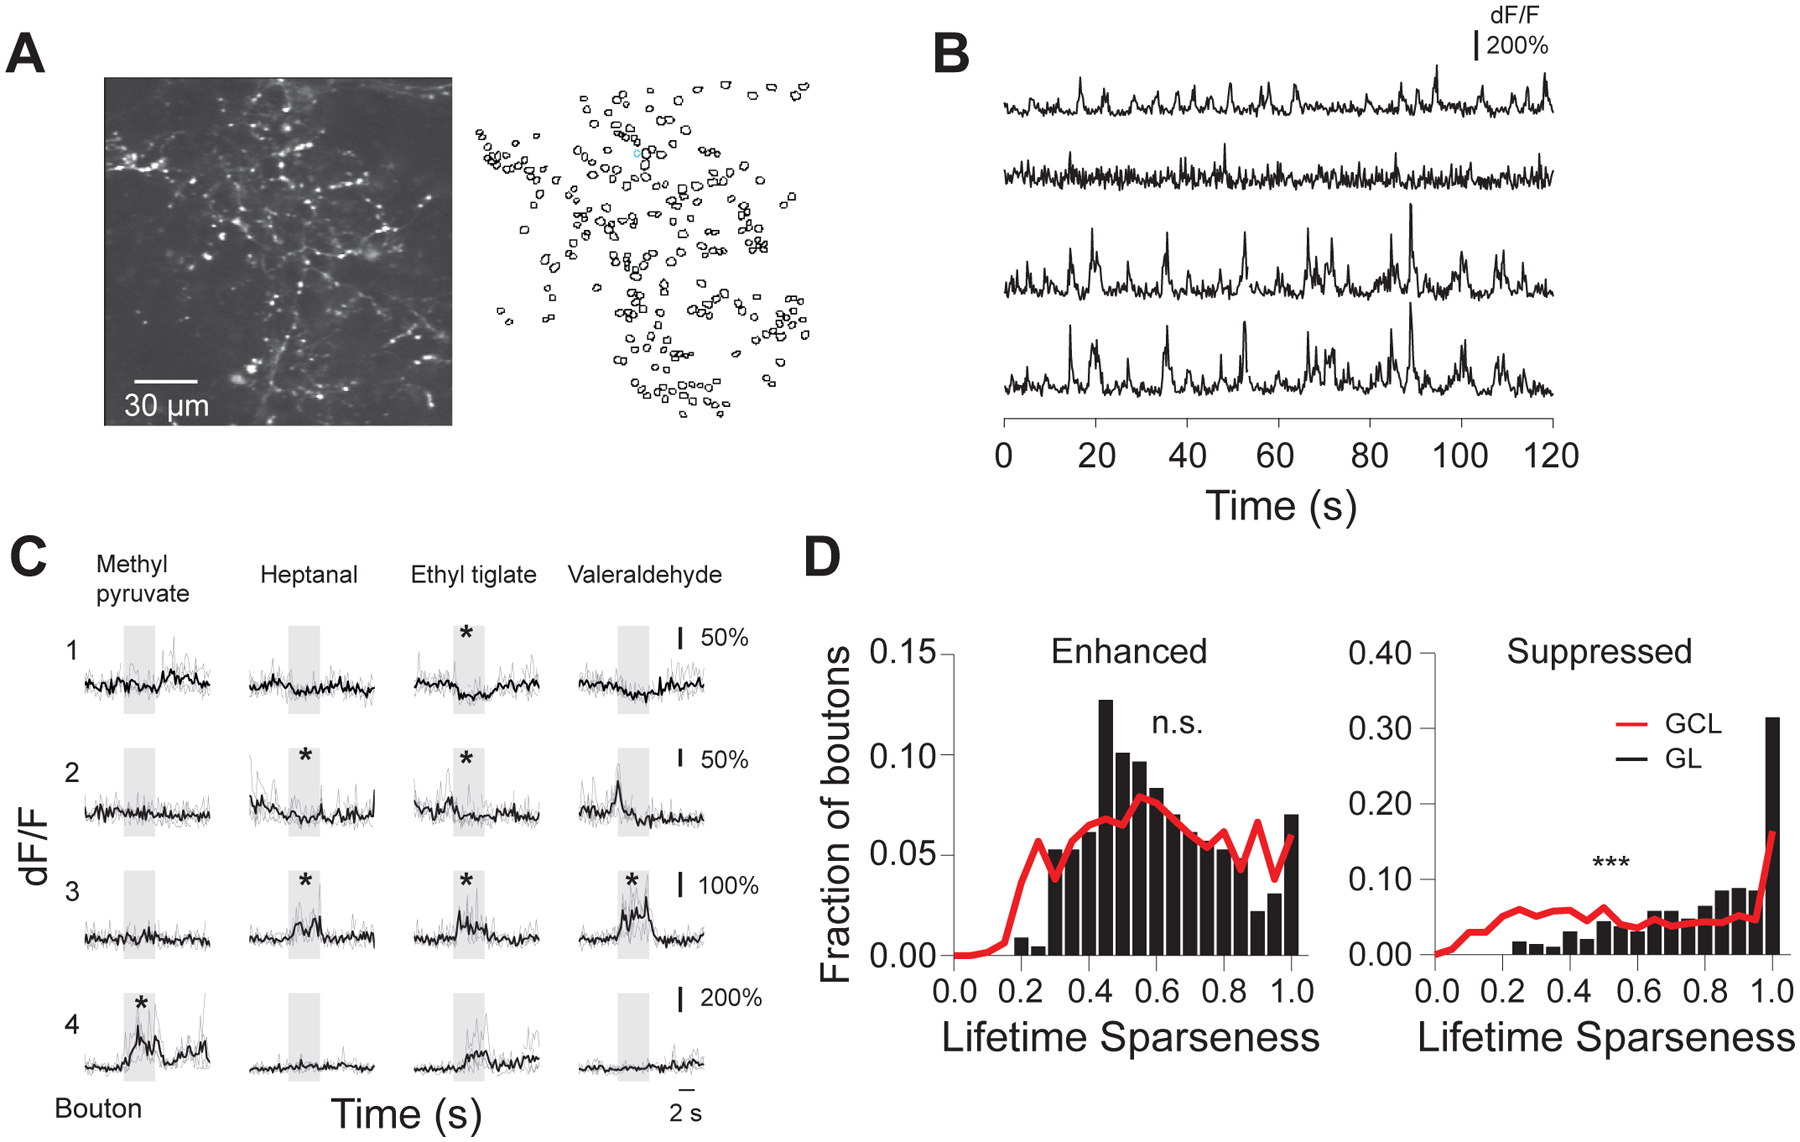
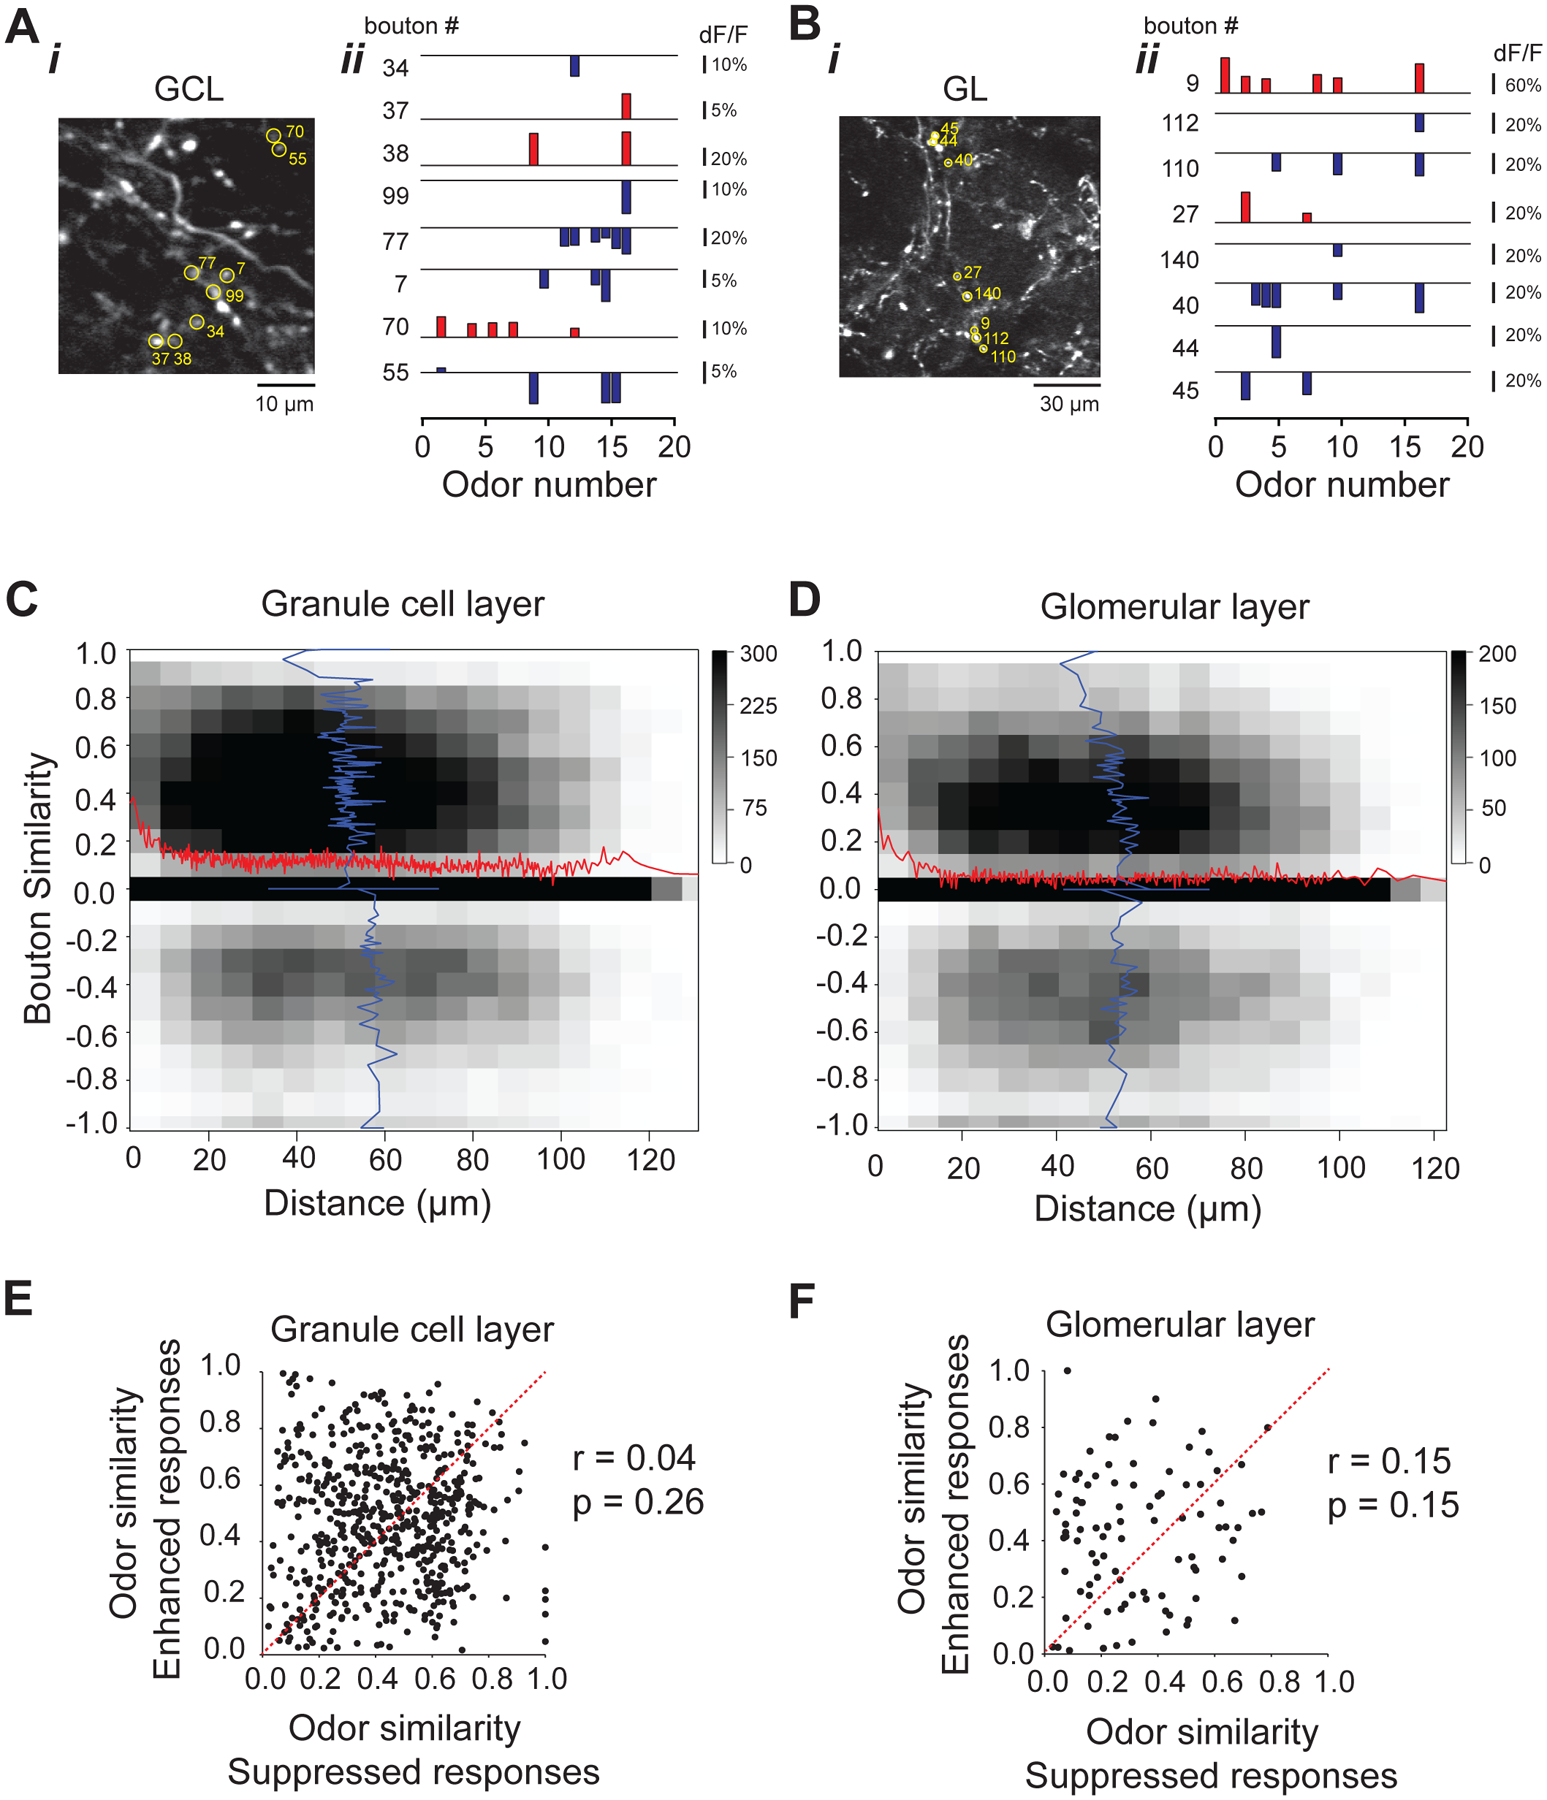
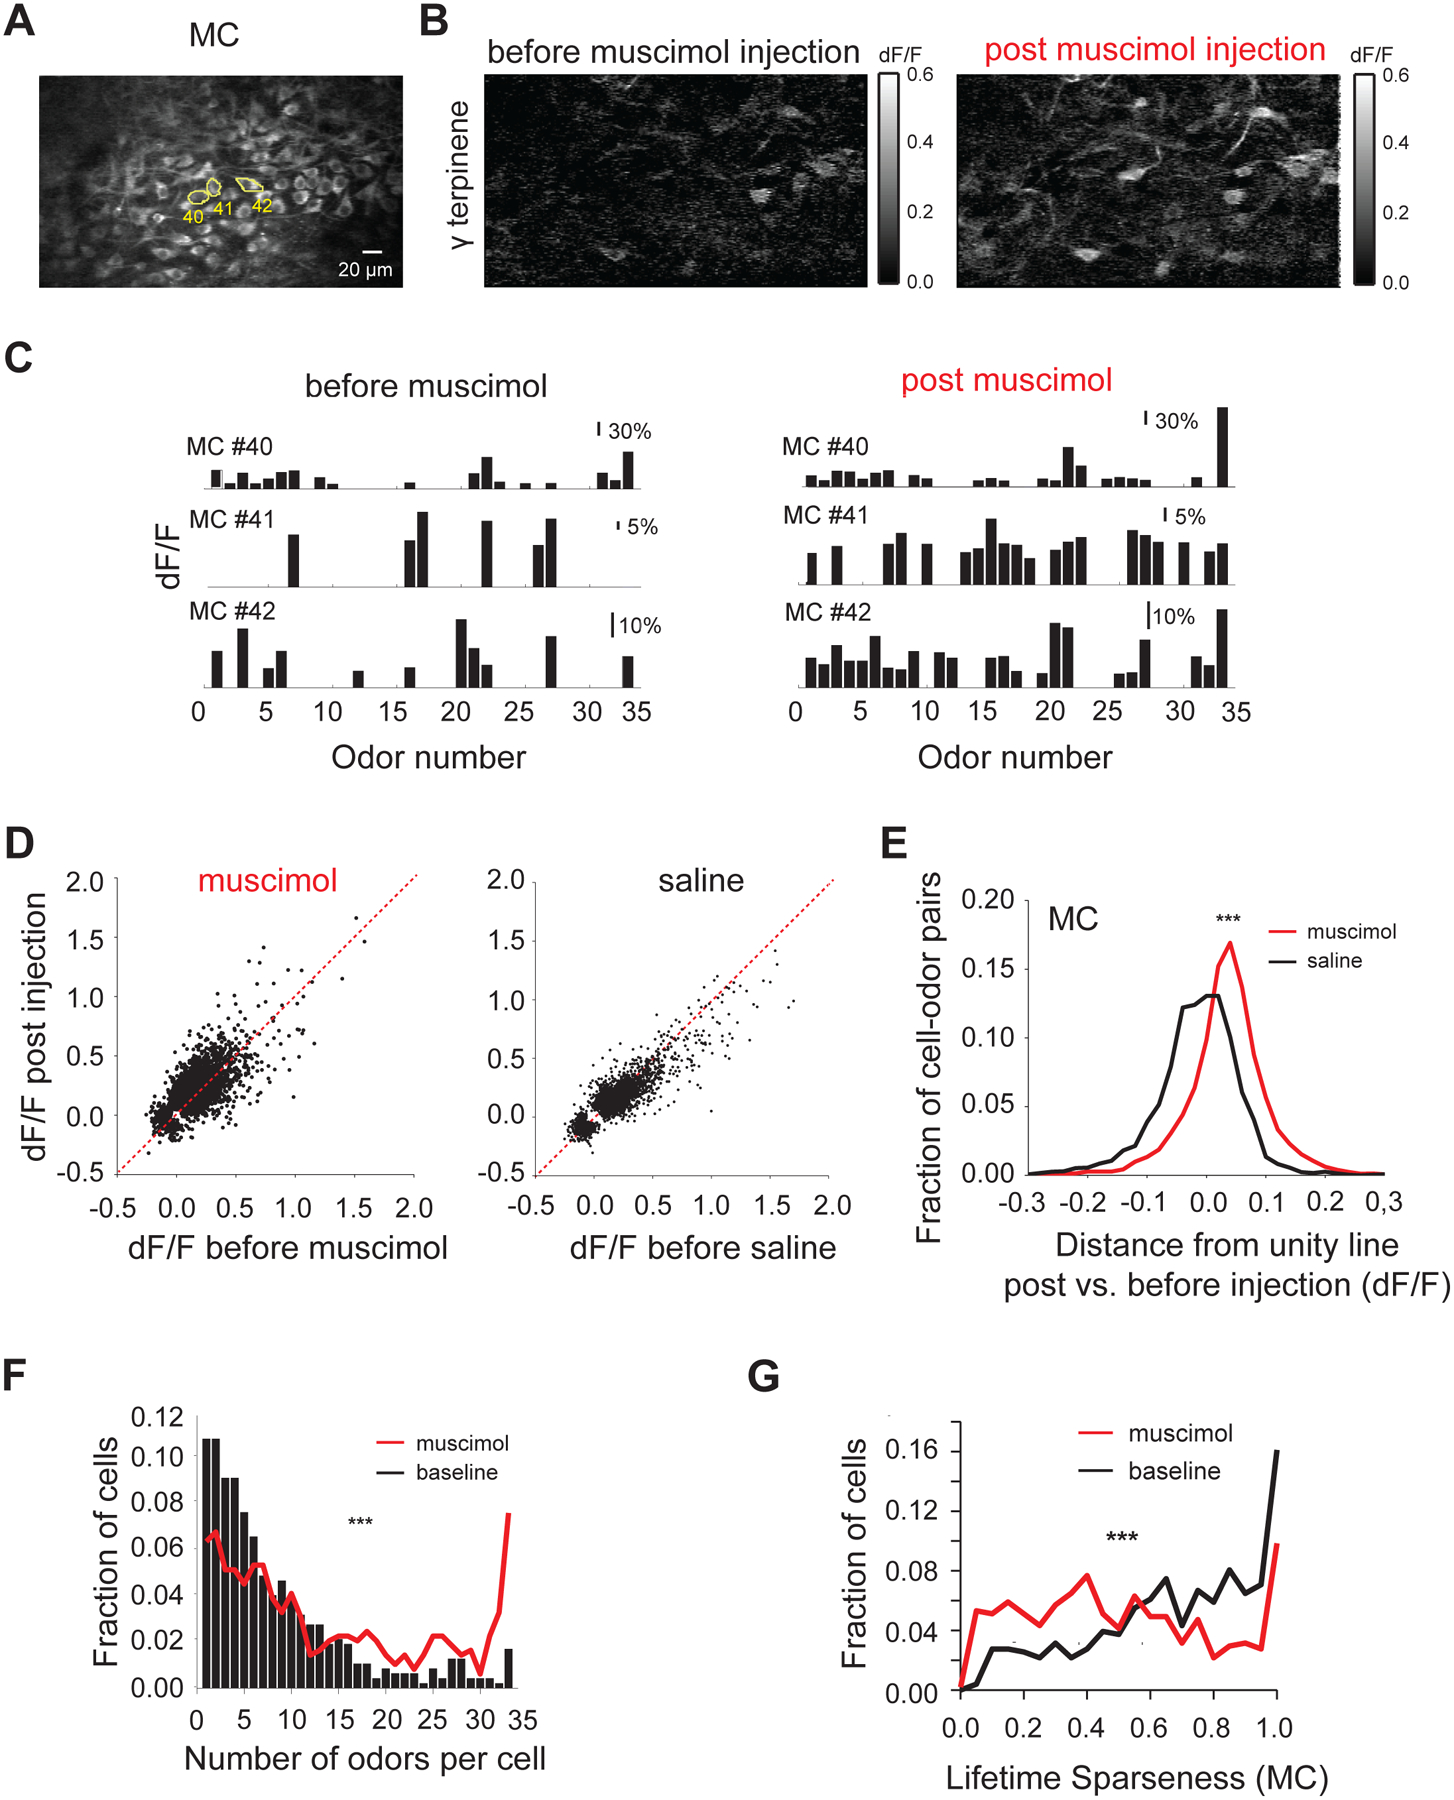
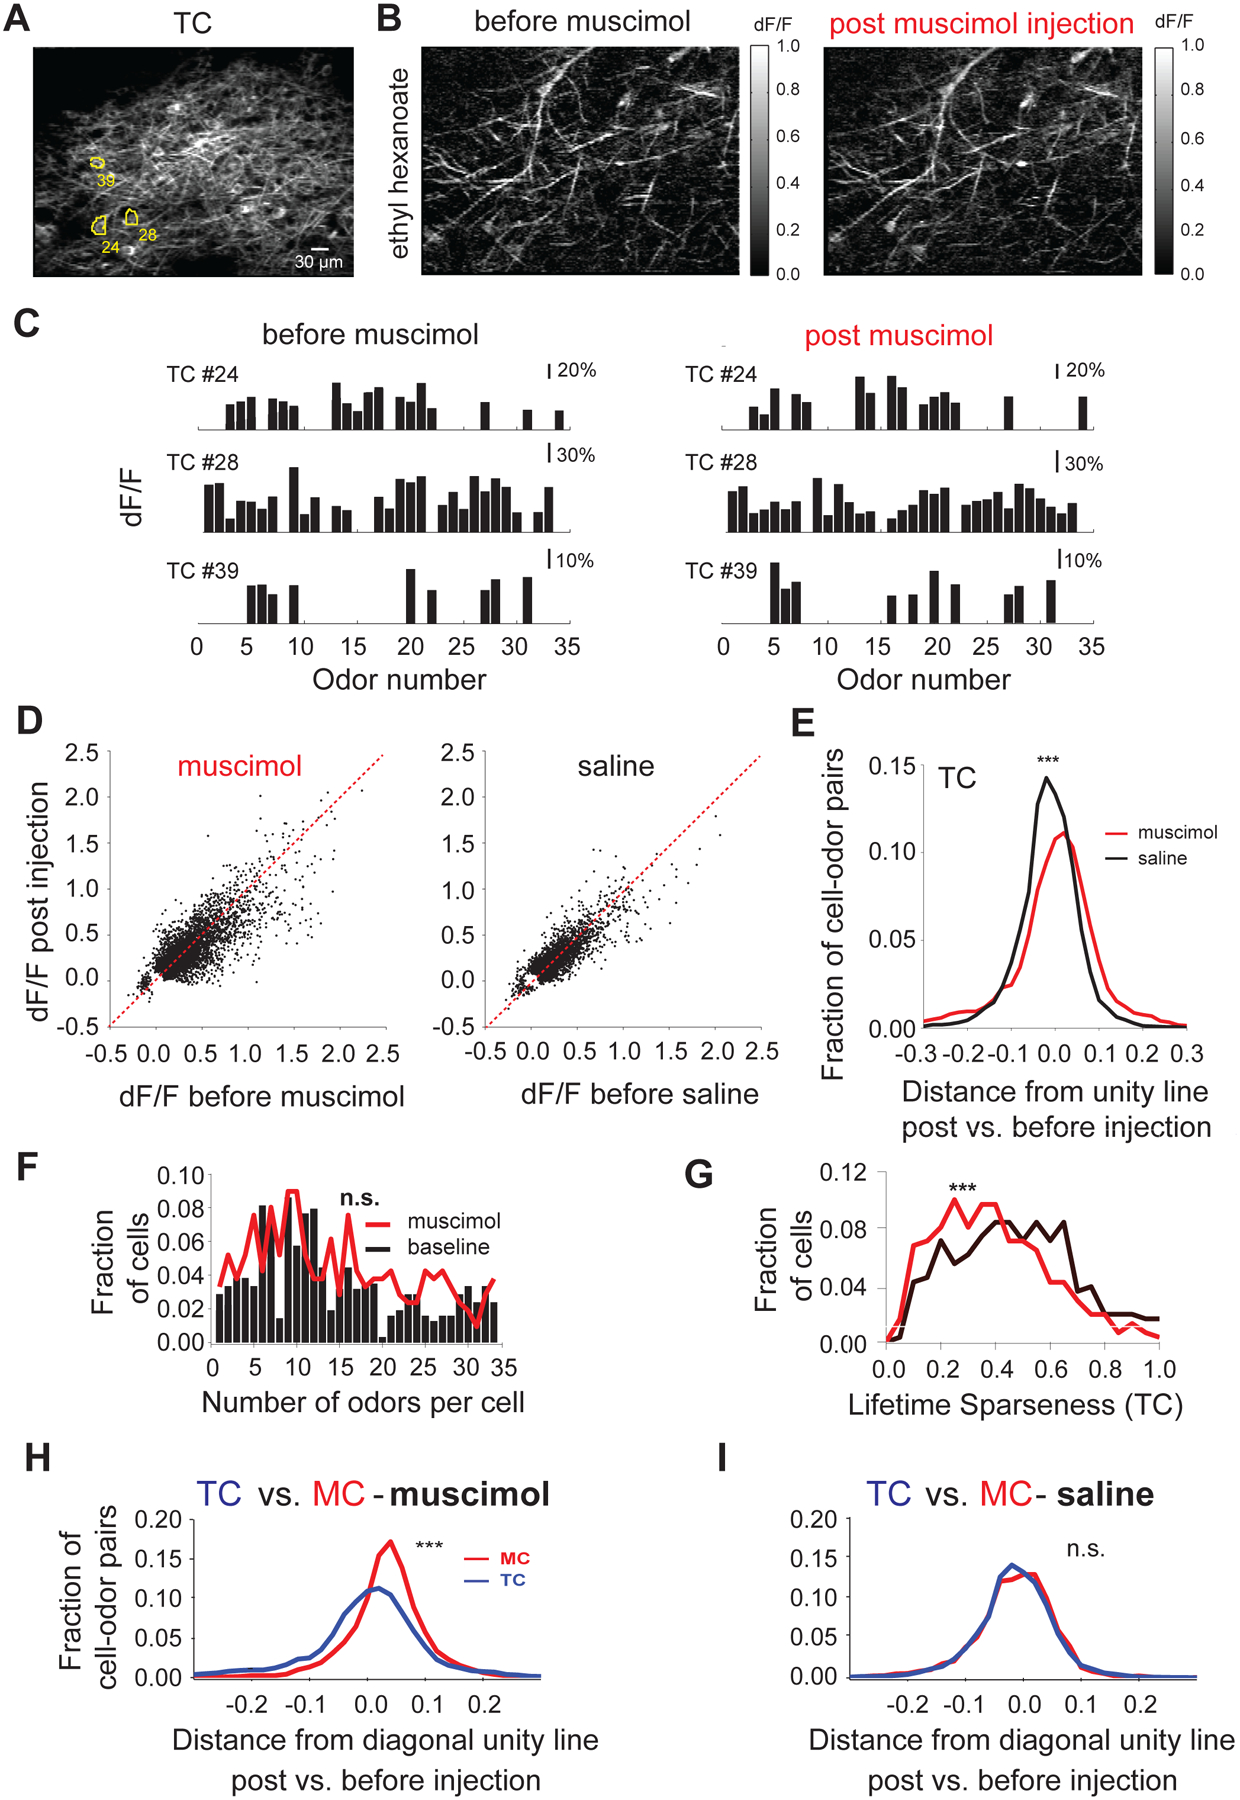
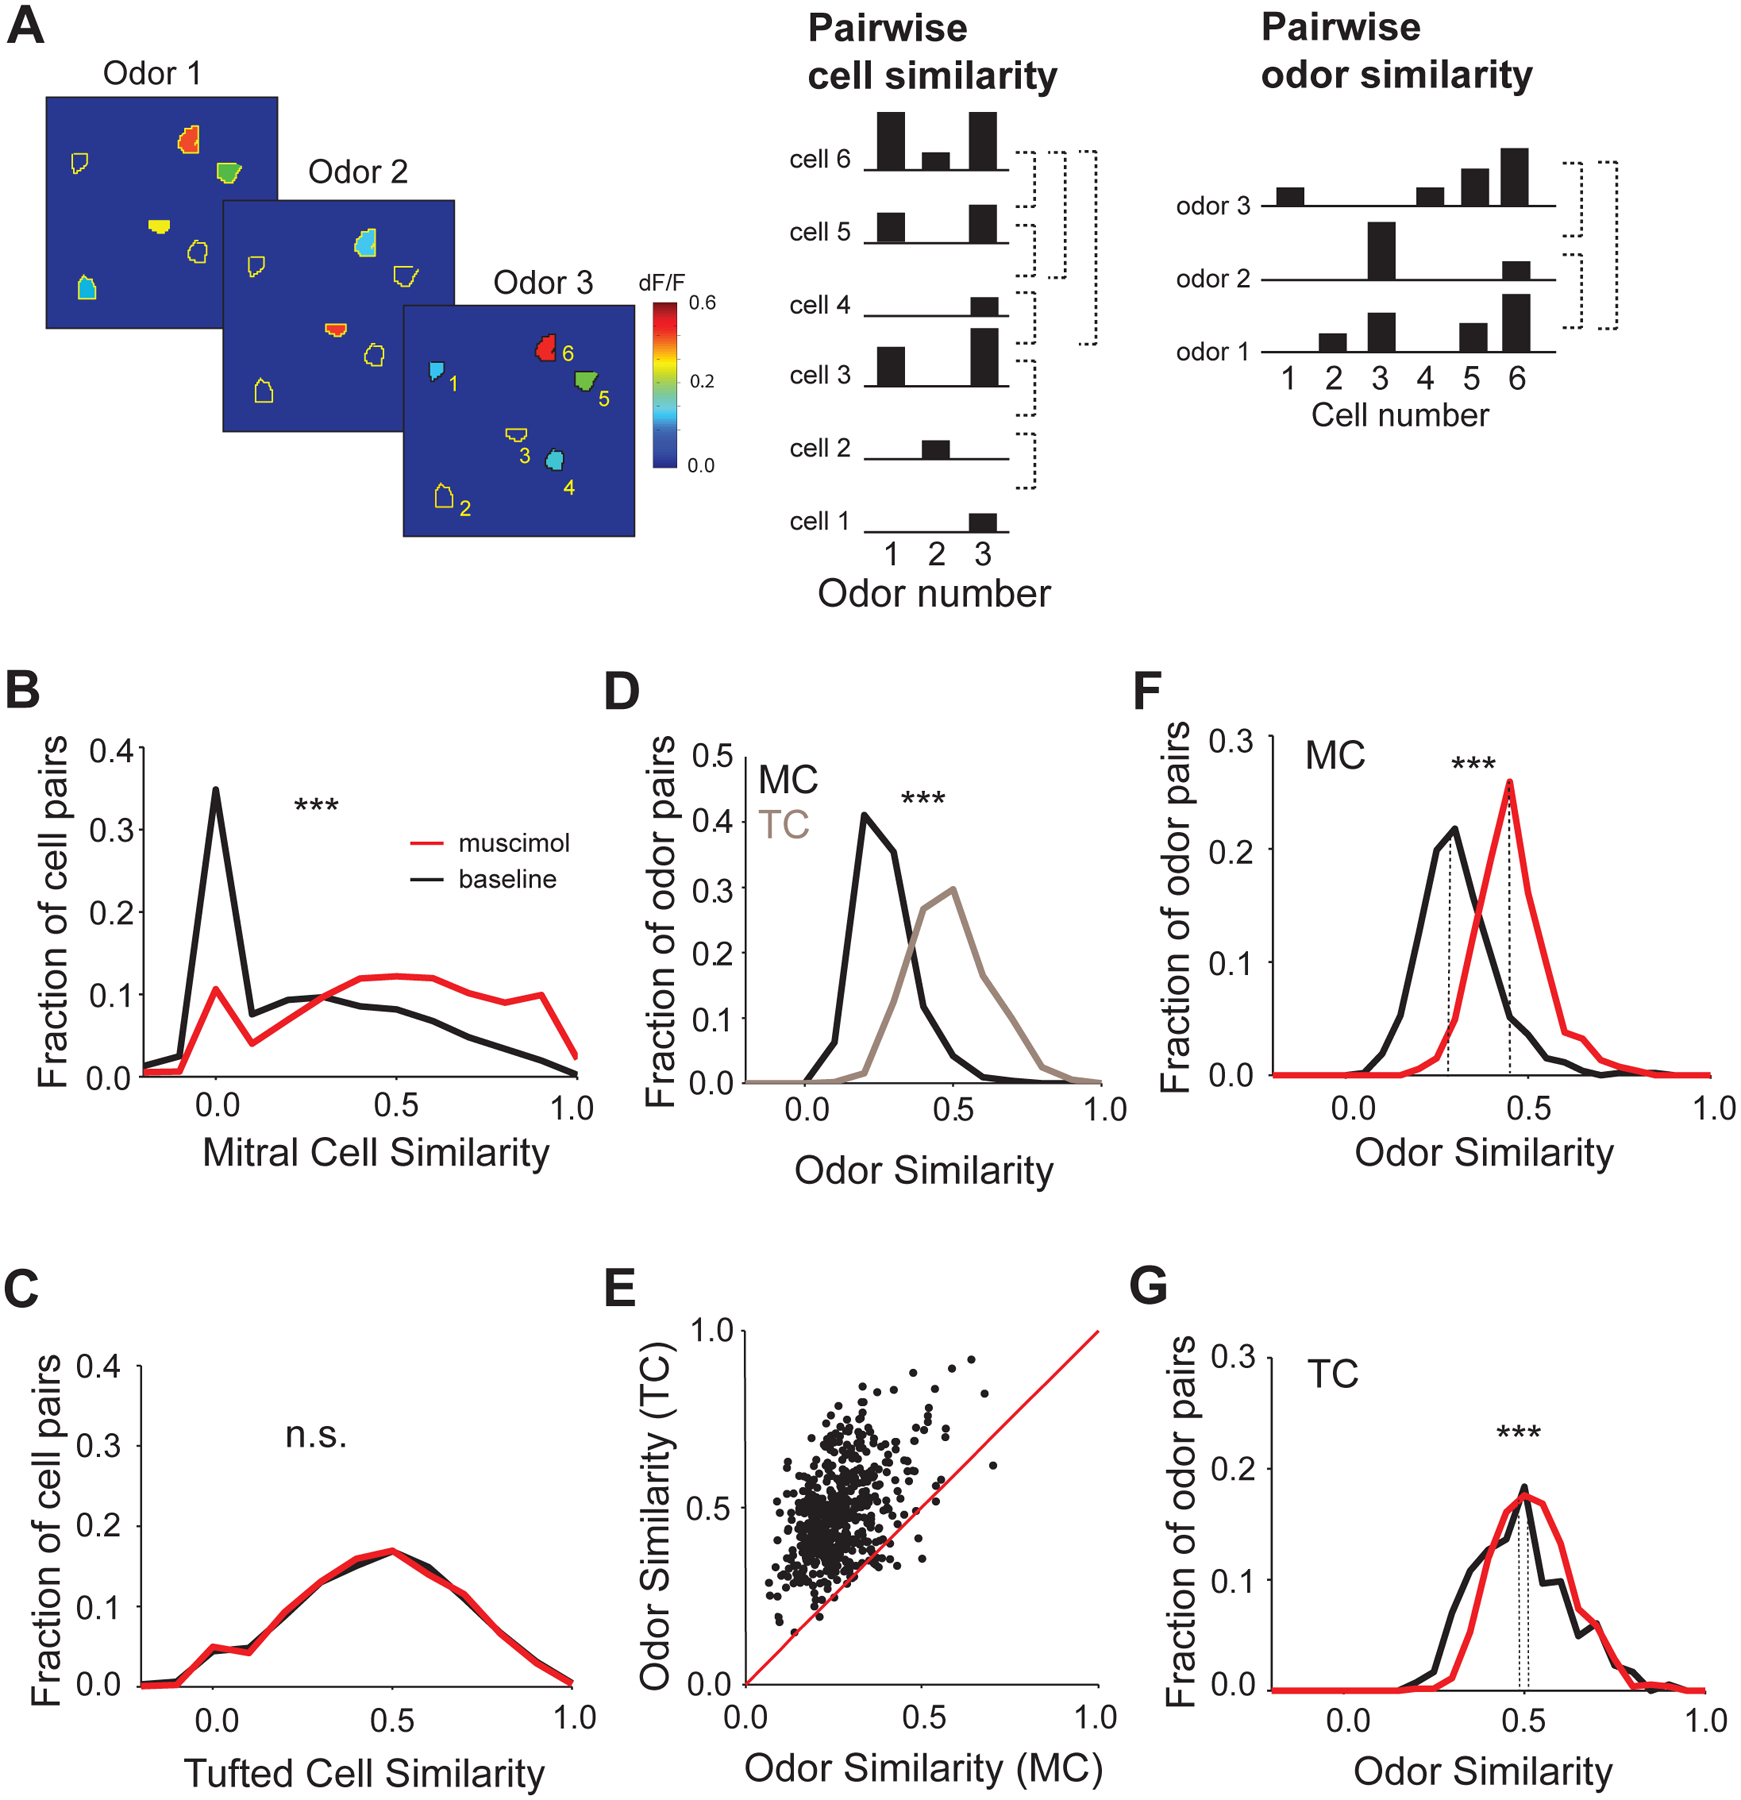
The olfactory bulb receives rich glutamatergic projections from the piriform cortex. However, the dynamics and importance of these feedback signals remain unknown. Here, we use multiphoton calcium imaging to monitor cortical feedback in the olfactory bulb of awake mice and further probe its impact on the bulb output. Responses of feedback boutons were sparse, odor specific, and often outlasted stimuli by several seconds. Odor presentation either enhanced or suppressed the activity of boutons. However, any given bouton responded with stereotypic polarity across multiple odors, preferring either enhancement or suppression. Feedback representations were locally diverse and differed in dynamics across bulb layers. Inactivation of piriform cortex increased odor responsiveness and pairwise similarity of mitral cells but had little impact on tufted cells. We propose that cortical feedback differentially impacts these two output channels of the bulb by specifically decorrelating mitral cell responses to enable odor separation.


Figures

Figure 1.
Figure 1.. Monitoring corticalbulbar boutons in awake head-fixed mice via multiphoton imaging of GCaMP5 signals.
A. Schematics of experimental setup: optical monitoring of cortical-bulbar feedback bouton responses via multiphoton imaging of GCaMP5 signals; Obj, 2p microscope objective; MC, mitral cells, Py, pyramidal neurons in the anterior piriform cortex (APC); B. Olfactory bulb (OB) circuit and neuronal types; OSN, olfactory sensory neurons; PG, periglomerular cells; SA, superficial short axon cells; ET, external tufted cells; TC, tufted cells; MC, mitral cells; dSA, deep short axon cells; GC, granule cells; CFB, cortical feedback fibers;; C. (Top) Composite GCaMP5 (green) and DAPI nuclear (blue) signals in a confocal reconstruction tiling a fixed sagittal brain slice from a mouse injected in the APC with AAV2.9 GCaMP5 expressing viruses. (Bottom) Insets for APC (Left), anterior olfactory nucleus (AON) (Center) and OB (Right); GL, glomerular layer, EPL, external plexiform layer, MCL, mitral cell layer, GCL, granule cell layer; A, anterior, P, posterior, D, dorsal, V, ventral; D. Example field of view ~300 μm deep from surface of GCaMP5 labeled cortical feedback axons and boutons in an awake head-fixed mouse; E. Spontaneous activity traces (dF/F0) from feedback boutons marked in D. Top six traces and respectively bottom four traces are from boutons of two different axonal branches; F. Histogram of pairwise correlations of baseline activity (dF/F) in a three minute interval preceding odor presentation; green and black traces corresponds to bouton pairs from different and respectively same axonal branches; G. Pairwise correlations of baseline activity (dF/F) in a three minute interval preceding odor presentation as a function of spontaneous events frequency; shaded area corresponds to standard deviation; H. Odor responses of four example boutons in GCL across four different stimuli (hexanal, acetal, (S)-limonene, ethyl tiglate, 0.4 % saturated vapor pressure). Individual repeats (gray), and average traces (black) are shown; odors trigger both positive (enhanced responses) and negative (suppressed responses) deflections from baseline; * mark significant odor responses; stimulus duration, 4s; I. Average fraction of cortical feedback boutons imaged responsive to odor (Odor) and APC electrical stimulation (Electrical) (40 pulses, 100μs, at 100Hz, 30μA); error bars indicate s.e.m calculated over odors and fields of view (left) and fields of view respectively (right). J. Histogram of the number of odors in the panel (Odor Set A, Table S1) that individual feedback boutons in the GCL responded to.
Figure 2.
Figure 2.. Dichotomy in corticalbulbar feedback odor responses: enhanced versus suppressed boutons.
A, B. Odor response types obtained via k-means clustering and their relative distribution in the population of feedback boutons targeting the GCL; Average response shapes (Top) and all corresponding odor responses (GCaMP5) assigned to each cluster (Bottom) A. Enhanced response clusters; B. Suppressed response clusters; C. Example average odor response spectra (ORS) of enhanced (red) and suppressed (blue) boutons; sparsely responding boutons, as well as broadly tuned boutons are shown for illustration; D. Fraction of boutons responsive to odors in the panel (Odor Set A, Table S1) via only enhancement (E), only suppression (S) and both enhancement and suppression (E-S); E. Enhanced (i) and suppressed (ii) concentration–response (GCaMP5) curves for two odors (ethyl valerate, i, and heptanal, ii) in three example cortical feedback boutons; error bars indicate SEM across repeats; F. Fraction of concentration response curves that were purely enhanced (E), only suppressed (S), or showed both enhancement and suppression compared to baseline within the sampled concentration range (E-S); error bars indicate standard deviation across fields of view.
Figure 3.
Figure 3.. Differential cortical feedback bouton odor responses across bulb layers.
A. (Left) Example field of view ~80 μm deep from surface of GCaMP5 labeled cortical feedback axons and boutons in an awake head-fixed mouse; (Right) Outlines of the regions of interest (ROIs) corresponding to putative cortical feedback boutons; B. Spontaneous activity traces from the feedback boutons selected in the field of view showed in A. Bottom two traces correspond to boutons assigned to the same axonal branch by reconstruction of single axons; C. Odor responses of four example boutons in GL across four different stimuli (ethyl pyruvate, heptanal, ethyl tiglate, valeraldehyde, 0.4% saturated vapor pressure). Individual repeats (gray) and average traces (black) are shown; odors trigger both positive (enhanced responses) and negative (suppressed responses) deflections from baseline; * mark significant odor responses; stimulus duration, 4s; D. Lifetime sparseness of boutons responsive to odors in the panel (Odor Set A, Table S1) only via enhancement (Left) or suppression (Right); distributions in the GCL (black bars) and GL (gray trace) are shown.
Figure 4.
Figure 4.. Cortical feedback representations are locally diverse.
A, B. Left) Example fields of view ~250 μm (A) and ~80 μm (B) from OB surface of GCaMP5 labeled cortical feedback axons and boutons in an awake head-fixed mouse; (Center) Odor response spectra (ORS) of eight example boutons marked in the fluorescence image; C, D. Two-dimensional histogram of pairwise correlations between ORS (Odor Set A, Table S1) of individual boutons in the granule cell layer (C) and glomerular layer (D) versus their physical separation. Red, average similarity (pairwise correlation) across different inter-bouton distances; Blue, average inter-bouton distance across all similarity values of bouton pairs; Gray scale, number of pairs per bin. E, F. Odor similarity in terms of only enhanced versus only suppressed bouton responses in the granule cell (E) (r=0.04) and glomerular layers (F) (r=0.15); numbers indicate the Pearson’s linear correlation coefficient (r) and the associated p-values, calculated using a paired t-test.
Figure 5.
Figure 5.. Suppression of APC activity increases mitral cell responsiveness.
A. Average resting fluorescence of an example field of view in the mitral cell layer (~220 μm from surface); B. Ratio image (dF/F) showing average fluorescence change in response to γ terpinene in the field of view shown in A. before (Left) and after (Right) muscimol injection; C. Example ORS (Odor Set B, Table S1) of three mitral cell bodies outlined in A. before (Left) and after (Right) muscimol injection; each bar indicates the average response amplitude (dF/F) to a given odor in the panel; D. Scatter plots showing the odor induced change in mitral cell body fluorescence (dF/F) before and after muscimol (Left) and respectively saline injection (Right); each dot indicates the response of a cell to a given odor (cell-odor pair) before versus after injection; only cell-odor pairs that were detected as significant in at least one of the two conditions are shown; gray line marks slope of 1; E. Summary histogram showing change in odor evoked mitral cells responses upon muscimol (black) and saline (gray) injections compared to pre-injection baseline; the change for each mitral cell odor response (each dot in D) is quantified as the Euclidian distance from the diagonal unity line (gray line indicating slope of 1); F. Histogram of the number of odors individual mitral cells responded to before (gray trace) and after (black trace) muscimol injection; G. Histogram of lifetime sparseness values for individual mitral cells before (gray trace) and after (black trace) muscimol injection (Avg. lifetime sparseness = 0.68 ± 0.01 pre-muscimol vs. 0.50 ± 0.01 post-muscimol, N = 509 MCs, 6 hemibulbs, Wilcoxon sign rank test, p< 0.001); *** indicate significance level (p<0.001, Wilcoxon signed rank test);
Figure 6.
Figure 6.. Suppression of APC activity only mildly alters tufted cells responses.
A. Average resting fluorescence of an example field of view containing tufted cell bodies and dendrites in the external plexiform layer (~140 μm from surface); B. Ratio image (dF/F) showing average fluorescence change in response to ethyl hexanoate in the field of view shown in A. before (Left) and after (Right) muscimol injection; C. Example ORS (Odor Set B, Table S1) of three tufted cell bodies outlined in E. before (Left) and after (Right) muscimol injection; D. Scatter plots showing the odor induced change in tufted cell body fluorescence (dF/F) before and after muscimol (Left) and respectively saline injection (Right); each dot indicates the response of a given cell to a given odor (cell-odor pair) before versus after injection; only cell-odor pairs that were detected as significant in at least one of the two conditions are shown; gray line marks slope of 1; E. Summary histogram showing change in odor evoked tufted cells responses upon muscimol (black) and saline (gray) injections compared to pre-injection baseline; the change for each mitral cell odor response (each dot in D) is quantified as the Euclidian distance from the diagonal (gray line indicating slope of 1); F. Histogram of the number of odors individual tufted cells responded to before (gray trace) and after (black trace) muscimol injection); Odor Set B, Table S1; n.s. indicates significance level (p = 1, Wilcoxon signed rank test). G. Histogram of lifetime sparseness values for individual tufted cells before (gray) and after (black) muscimol injection (Avg. lifetime sparseness = 0.47 ± 0.01 pre-muscimol vs. 0.39 ± 0.01 post-muscimol, N = 308 TCs, 5 hemibulbs, Wilcoxon sign rank test, p< 0.001); Odor Set B, Table S1; *** indicate significance level (p<0.001, Wilcoxon signed rank test); H, I. Summary histograms showing change in odor evoked mitral cell (black) and tufted cell (gray) responses upon muscimol (Avg. distance for MCs = 0.034 ± 0.001, N=7,538 odor-cell pairs vs. Avg. distance for TCs = -0.006 ± 0.002, N=5,662 odor-cell pairs, Wilcoxon rank sum test, p<0.001, H) and saline (Avg. distance for MCs = −0.017 ± 0.001, N=4,719 odor-cell pairs vs. Avg. distance for TCs = −0.0157 ± 0.001, N=3,047 odor-cell pairs, Wilcoxon rank sum test, p=0.56, I) injections compared to pre-injection baseline; the change for each cell odor response (each dot in Figures 5D, 6D) is quantified as the Euclidian distance from the diagonal (dotted line indicating slope of 1); *** indicates significance level (p<0.001, Wilcoxon signed rank test); n.s. indicates p>0.05;
Figure 7.
Figure 7.. Suppression of APC activity decorrelates mitral, but not tufted cells odor representations.
A. Schematic exemplifying pairwise cell similarity and odor similarity calculations for a given field of view; (Left) Cartoon showing responses of six identified ROIs (black outlines) within a given field of view across three odors; colors indicate the average response amplitude (dF/F) for each ROI; (Center) An ORS is calculated for each ROI (cell) as the vector containing the average dF/F for each odor; pairwise cell similarity is calculated as the uncentred correlation between the ORS vectors for each pair of cells (indicated by dotted lines); (Right) A cell response spectrum (CRS) is calculated for each odor as the vector containing the average dF/F for each cell upon presentation of the given odor; pairwise odor similarity is calculated as the uncentred correlation between the CRS vectors for each pair of odors; Odor Set B, Table S1 used for B-G; B. Histogram of pairwise cell similarity of mitral cells before (gray, baseline) and after (black) muscimol injection; Odor Set B, Table S1; C. Histogram of pairwise cell similarity of tufted cells before (gray, baseline) and after (black) muscimol injection; n.s. indicate significance level (p = 0.25, Wilcoxon signed rank test); D. Histogram of pairwise odor similarity of mitral cells (black, MC) and tufted cells (gray, TC) before muscimol injection; E. Scatter plot of averaged pairwise odor similarity of mitral versus tufted cells before muscimol injection; each dot represents the comparison of average similarity scores for a given odor pair obtained from mitral and tufted cells odor representations across all sampled fields of view; F. Histogram of pairwise odor similarity of mitral cells responses before (gray) and after (black) muscimol injection; dotted lines indicate the median; G. Histogram of pairwise odor similarity of tufted cells responses before (gray) and after (black) muscimol injection; *** indicate significance level (p<0.001, Wilcoxon signed rank test); dotted lines indicate the median.

References

    1. Akerboom J, Chen T-W, Wardill TJ, Tian L, Marvin JS, Mutlu S, Calderón NC, Esposti F, Borghuis BG, Sun XR, et al. (2012). Optimization of a GCaMP Calcium Indicator for Neural Activity Imaging. J. Neurosci. Off. J. Soc. Neurosci 32, 13819–13840. - PMC - PubMed
    1. Babadi B, and Sompolinsky H (2014). Sparseness and expansion in sensory representations. Neuron 83, 1213–1226. - PubMed
    1. Balu R, Pressler RT, and Strowbridge BW (2007). Multiple modes of synaptic excitation of olfactory bulb granule cells. J. Neurosci. Off. J. Soc. Neurosci 27, 5621–5632. - PMC - PubMed
    1. Barak O, Rigotti M, and Fusi S (2013). The sparseness of mixed selectivity neurons controls the generalization-discrimination trade-off. J. Neurosci. Off. J. Soc. Neurosci 33, 3844–3856. - PMC - PubMed
    1. Boyd AM, Sturgill JF, Poo C, and Isaacson JS (2012). Cortical feedback control of olfactory bulb circuits. Neuron 76, 1161–1174. - PMC - PubMed

Publication types

MeSH terms

LinkOut - more resources