. 2015 Jun 8:5:10957.
doi: 10.1038/srep10957.

Biological determinants of bladder cancer gene expression subtypes

Affiliations

Biological determinants of bladder cancer gene expression subtypes

Mattias Aine et al. Sci Rep. .

Abstract

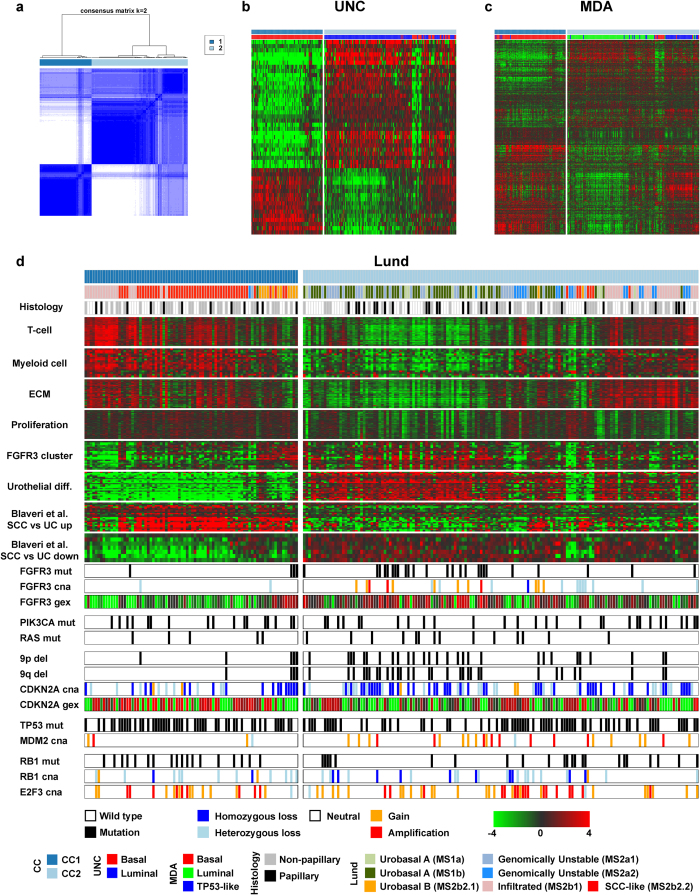
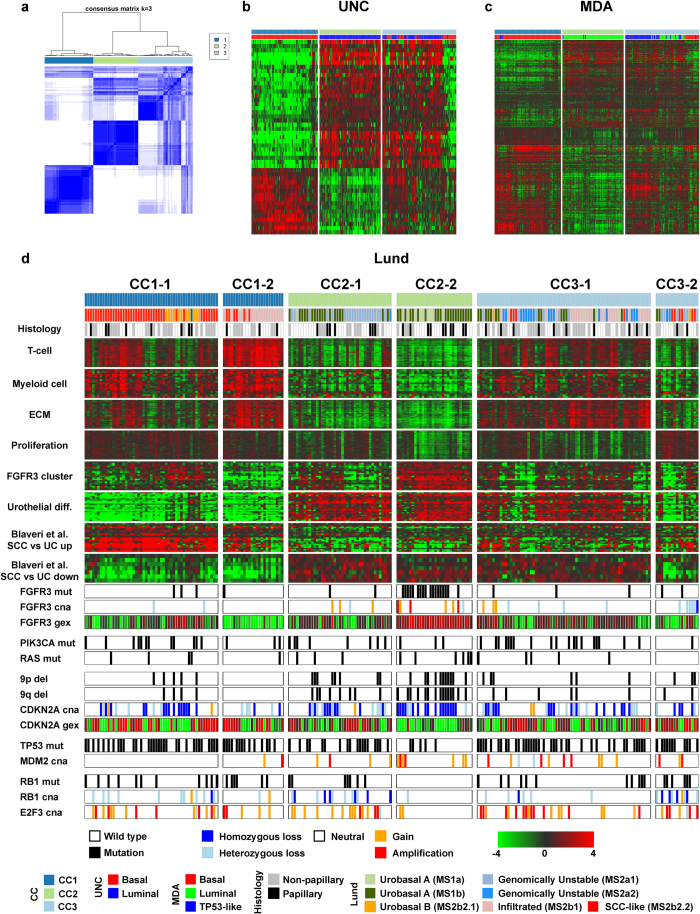
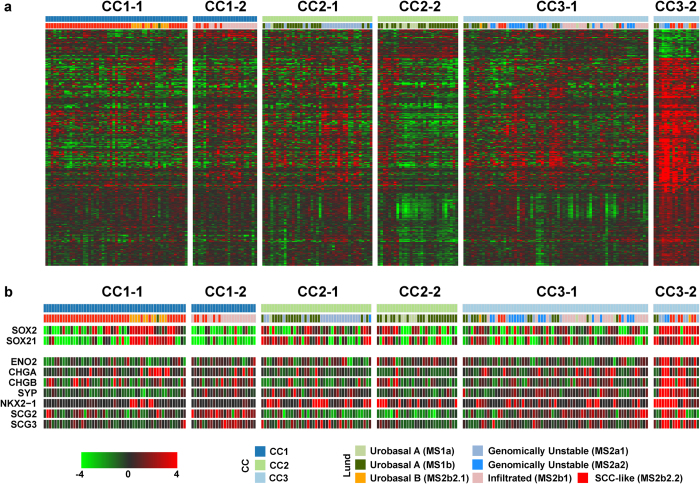
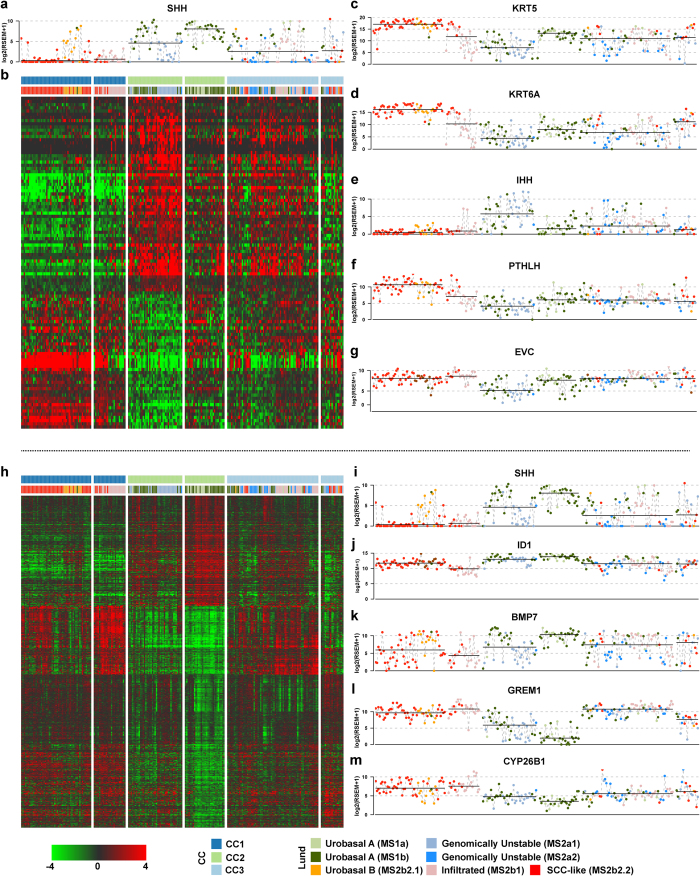
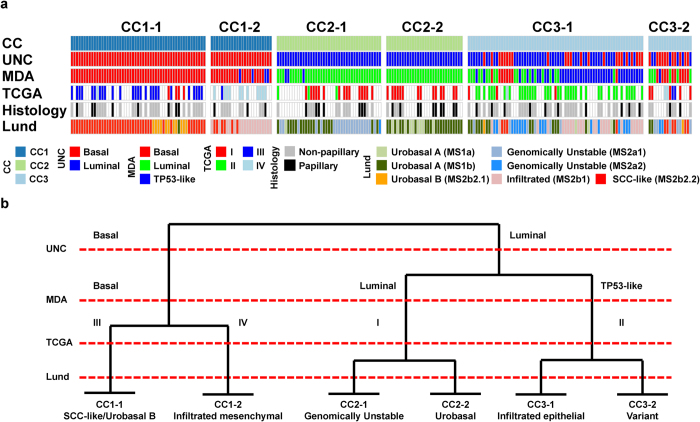
Molecular stratification of tumors by gene expression profiling has been applied to a large number of human malignancies and holds great promise for personalized treatment. Comprehensive classification schemes for urothelial carcinoma have been proposed by three separate groups but have not previously been evaluated simultaneously in independent data. Here we map the interrelations between the proposed molecular subtypes onto the intrinsic structure of a rich independent dataset and show that subtype stratification within each scheme can be explained in terms of a set of common underlying biological processes. We highlight novel biological and genomic drivers of urothelial carcinoma molecular subtypes and show that tumors carrying genomic aberrations characteristic of distinct molecular pathways converge on a common top level phenotype corresponding to the two major molecular subtypes of non-muscle invasive disease.


Figures

Figure 1
Figure 1. A two-group solution stratifies tumors based on the expression of genes involved in urothelial and squamous differentiation.
(a) Clustered heatmap of TCGA tumor co-clustering frequencies generated using the ConsensusClusterPlus-package. Blue indicates frequent co-clustering and the color bar indicates the CC1 and 2 subgroups respectively. (b-c) UNC and MDA classifier genes in the TCGA data visualized in heatmap format with consensus cluster and subgroup calls indicated. (d) Lund classifier calls with histological characteristics and biological gene signatures extracted from Sjödahl et al. 2012 and Blaveri et al. 2005 as well individual gene expression, CN-status and mutation calls for genes implicated in UC tumorigenesis. Abbreviations: ECM, extracellular matrix; SCC, squamous cell carcinoma; UC, urothelial carcinoma; mut, mutation; cna, copy-number aberration; gex, gene expression; del, deletion.
Figure 2
Figure 2. Substratification reveals biologically coherent themes to gene expression subtypes.
(a) Clustered heatmap of sample co-clustering frequencies generated using the ConsensusClusterPlus-package. Blue indicates frequent co-clustering and the color bar indicates the CC1 (dark blue), 2 (light green) and 3 (light blue) subgroups respectively. (b-c) UNC and MDA classifier genes in heatmap format overlaid on the three TCGA subgroups with subgroup calls indicated. (d) Further stratification of the CC1, CC2 and CC3 groups into six subgroups with Lund classifier calls, histological characteristics as well as biological gene signatures extracted from Sjödahl et al. 2012 and Blaveri et al. 2005 as well CN-status and mutation calls for genes implicated in UC tumorigenesis. Abbreviations: ECM, extracellular matrix; SCC, squamous cell carcinoma; UC, urothelial carcinoma; mut, mutation; cna, copy-number aberration; gex, gene expression; del, deletion.
Figure 3
Figure 3. The CC3-2 subgroup exhibits high expression of cell cycle genes and markers of variant histologies.
(a) Clustered heatmap visualization of genes differentially expressed between CC3-2 and the remaining subgroups with consensus clusters and Lund subtypes indicated. (b) CC3-2 and CC1-1/Lund Urobasal B tumors express the pluripotency markers SOX2 and SOX21. CC3-2 tumors exhibit consistent high expression of genes characteristic of variant histologies of urothelial cancers.
Figure 4
Figure 4. Differential expression of hedgehog-linked genes within the CC2 cluster.
(a) Uncentered data on SHH expression accross the consensus subgroups with Lund classification indicated for each tumor. The solid black bar indicates the within-cluster median gene expression level. (b) Heatmap visualization of genes differentially expressed between CC2-1 and the remaining subgroups. (c–g) As in (a) for the CC2-1 downregulated genes KRT5, KRT6A, EVC and PTHLH as well as the upregulated gene IHH. (h) As in (b) for genes differentially expressed between CC2-2 and the remaining subgroups. (i–m) As in (a) for the genes SHH, ID1, BMP7, GREM1 and CYP26B1.
Figure 5
Figure 5. Interrelations between four classification schemes for UC.
(a) Consensus cluster subgroups with UNC, MDA, TCGA and Lund classes as well as histology indicated for tumors (columns) included in the present study. (b) A schematic representation detailing how the different proposed subtypes of UC are interrelated.

References

    1. Epstein J. I., Amin M. B., Reuter V. R. & Mostofi F. K. The World Health Organization/International Society of Urological Pathology consensus classification of urothelial (transitional cell) neoplasms of the urinary bladder. Bladder Consensus Conference Committee. Am J Surg Pathol 22, 1435–48 (1998). - PubMed
    1. Fujimoto K. et al. Frequent association of p53 gene mutation in invasive bladder cancer. Cancer Res 52, 1393–8 (1992). - PubMed
    1. van Rhijn B. W. et al. The fibroblast growth factor receptor 3 (FGFR3) mutation is a strong indicator of superficial bladder cancer with low recurrence rate. Cancer Res 61, 1265–8 (2001). - PubMed
    1. Dalbagni G., Presti J., Reuter V., Fair W. R. & Cordon-Cardo C. Genetic alterations in bladder cancer. Lancet 342, 469–71 (1993). - PubMed
    1. Knowles M. A. et al. Allelotype of human bladder cancer. Cancer Res 54, 531–8 (1994). - PubMed

Publication types

MeSH terms

Substances