. 2015 Jun 18;161(7):1592-605.
doi: 10.1016/j.cell.2015.05.032. Epub 2015 Jun 4.

Activity-Induced DNA Breaks Govern the Expression of Neuronal Early-Response Genes

Affiliations

Activity-Induced DNA Breaks Govern the Expression of Neuronal Early-Response Genes

Ram Madabhushi et al. Cell. .

Abstract

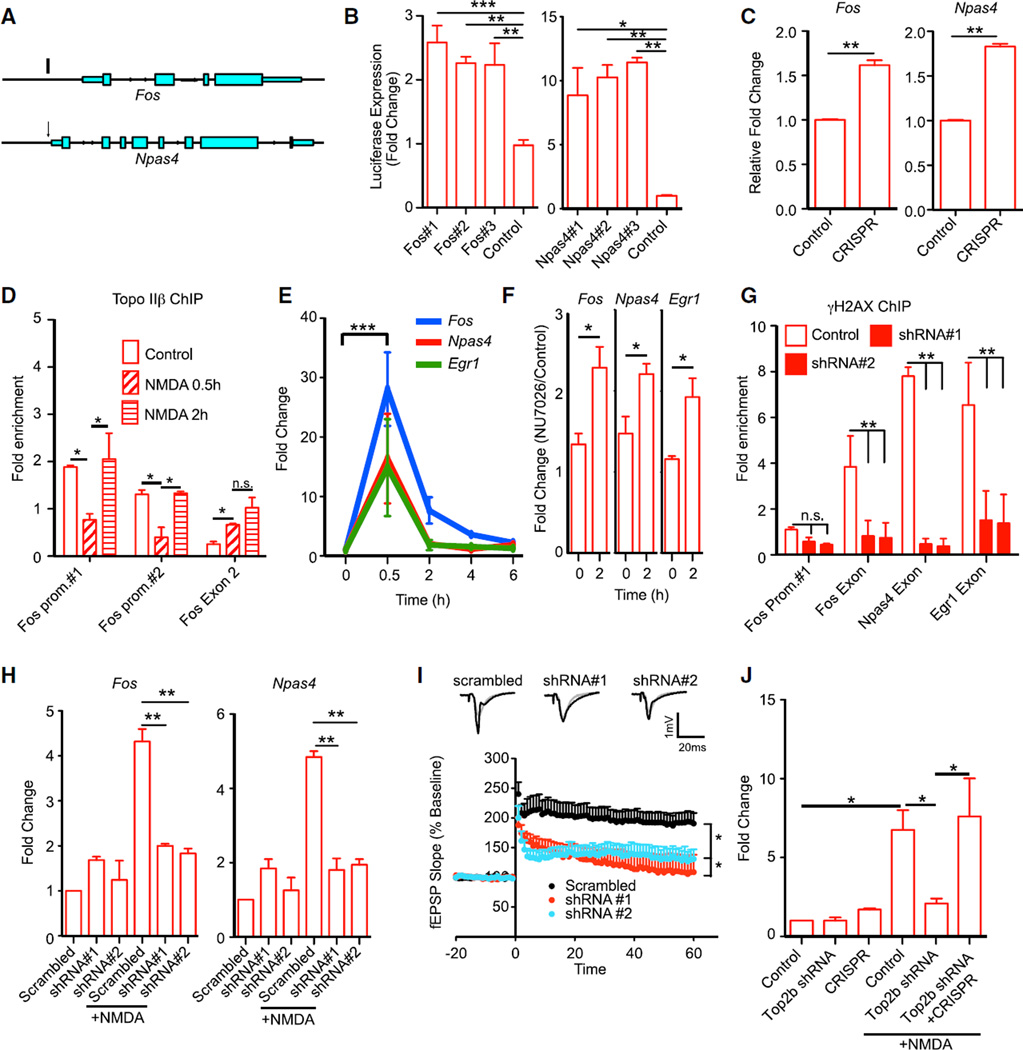
Neuronal activity causes the rapid expression of immediate early genes that are crucial for experience-driven changes to synapses, learning, and memory. Here, using both molecular and genome-wide next-generation sequencing methods, we report that neuronal activity stimulation triggers the formation of DNA double strand breaks (DSBs) in the promoters of a subset of early-response genes, including Fos, Npas4, and Egr1. Generation of targeted DNA DSBs within Fos and Npas4 promoters is sufficient to induce their expression even in the absence of an external stimulus. Activity-dependent DSB formation is likely mediated by the type II topoisomerase, Topoisomerase IIβ (Topo IIβ), and knockdown of Topo IIβ attenuates both DSB formation and early-response gene expression following neuronal stimulation. Our results suggest that DSB formation is a physiological event that rapidly resolves topological constraints to early-response gene expression in neurons.


Figures

Figure 1
Figure 1. Early-Response Genes Are Upregulated following Etoposide Treatment of Neurons
(A) Cultured primary neurons (DIV 10) were incubated with either vehicle (DMSO) or etoposide (5 µM) for 6 hr, following which RNA was extracted and subjected to RNA-seq. (Top) Differentially expressed genes are shown in a volcano plot, and genes whose expression was altered significantly (p < 0.05) are indicated in red. (Bottom) Schematic indicating the number of downregulated (blue) and upregulated genes (red). (B) List of upregulated genes in etoposide-treated neurons and their relative fold change (log2) compared to vehicle-treated controls. (C) UCSC genome browser snapshots of RNA-seq trace files from etoposide-treated neurons (green) and vehicle-treated controls (black) at various neuronal activity-regulated genes (violet bars), y axis represents signal intensity and the scale is indicated in parentheses. (D) Cultured primary neurons were treated with either etoposide (5 µM) orvehicle (DMSO) for 20 min, following which RNA was extracted, and the expression of the indicated genes were assessed using qRT-PCR (n = 3, *p < 0.05, **p < 0.01, ***p < 0.001, two-tailed t test). (E) Cultured primary neurons were pre-incubated with the ATM inhibitor, KU55933 (ATMi), for 30 min following which etoposide treatment was performed as in (D). (Top) Neurons were immunostained with antibodies against γH2AX following treatment with etoposide either in the presence or absence of ATMi. (Bottom) The expression of early-response genes, Fos and Npas4, were assessed using qRT-PCR (n = 3, *p < 0.05, **p < 0.01, one-way ANOVA). (F) Cultured primary neurons were incubated with the indicated drugs for 20 min, following which the expression of Fos and Npas4 was assessed using qRT-PCR (n = 3, **p < 0.01, one-way ANOVA).
Figure 2
Figure 2. Neuronal Activity-Induced DNA DSBs Form at Early-Response Genes
(A) Genomic regions were categorized into 14 distinct chromatin states based on combinatorial patterns of various chromatin marks (Figure S2A). The percentage of γH2AX peaks within each chromatin state were then normalized to the proportion of the genome with that chromatin state and plotted. (B) γH2AX ChIP-seq signals enriched in NMDA-treated samples relative to controls were processed using CEAS (Cis-Regulatory Element Annotation System) program (http://liulab.dfci.harvard.edu/CEAS/). (Left) Pie chart depicting the relative proportions of the indicated annotated regions in the genome. (Right) Disposition of γH2AX signals within these annotated genomic regions. (C) Differential peak calling was performed to determine the regions that were enriched for γH2AX following NMDA treatment (Experimental Procedures). This data were then processed using CIRCOS software (Krzywinski et al., 2009) to generate the shown circular representation. The outer ring depicts the mouse chromosomes. The blue ring represents a map of gene densities, and the green ring indicates γH2AX signals. Red lines within the green ring represent loci that were enriched for γH2AX relative to controls. Twenty loci were within genes, and these genes are indicated. One locus was within intergenic regions. (D) UCSC genome browser views depicting the disposition of γH2AX signals within various activity-regulated genes under basal conditions (control) and following NMDA treatment, y axis represents intensity and the range is indicated in parentheses.
Figure 3
Figure 3. Topo IIβ Binds to the Promoters of Early-Response Genes under Basal Conditions and Cleaves Them in Response to Neuronal Activity
(A) ChIP analysis of Topo IIβ binding to the promoters of Fos and Npas4. Two distinct primer sets (Fos Prom#1 and Fos Prom#2, respectively) were used to probe the Fos promoter region. In addition, two different exons within the Fos gene (exons 2 and 4), as well as the promoters of Npas4, β-globin, and GAPDH, were also probed (n = 3, *p < 0.05, **p < 0.01, one-way ANOVA). (B) Sequential ChIP analysis of HDAC2 and Topo IIβ binding to the Fos promoter. Cultured primary neurons were first subjected to ChIP with antibodies against Topo IIβ. The crosslinked proteins were then immunoprecipitated with antibodies against HDAC2. Primers were as in (A) (n = 3, *p < 0.05, one-way ANOVA). (C) Topo IIβ was immunoprecipitated from cultured primary neurons following NMDA treatment. The precipitated Topo IIβ was then incubated with 1 µg of a supercoiled luciferase reporter plasmid carrying ~6 kb of upstream regions of the Npas4 gene. Reactions were then incubated at 30°C for 15 min, stopped, and electrophoresed through 1% agarose gels. Letters indicate the positions of supercoiled (I) and relaxed (II) and DNA. Substrate DNA alone was run to indicate the migration of supercoiled and relaxed DNA (top). Input fractions (5%) collected prior to immunoprecipitation were electrophoresed through 6% SDS-PAGE gels and analyzed by western blotting (bottom). (D) Luciferase reporter constructs containing sequences upstream of either the Fos TSS or the Npas4 TSS were incubated with purified recombinant human Topo IIβ (8 units/reaction) either in the presence or absence of etoposide (0.2 mM final). Reactions were then incubated at 30°C for 15 min, stopped, and electrophoresed through 1 % agarose gels. As controls, constructs lacking the Fos and Npas4 sequences (ΔFos-luc and ΔNpas4-luc) were also analyzed. Dashed line indicates the size of the linearized construct. Letters indicate the positions of supercoiled (I), relaxed (II) and linear (III) DNA. (E) Schematic showing how DNA cleavage by Topo IIβ (red ovals) would preclude the amplification of the Fos promoter by PCR primers utilized in (A) (indicated by blue and green arrows). (F) ChIP analysis of Topo IIβ binding at the Fos promoter following either etoposide or NMDA treatment. Control bar graphs are as in (A) (n = 3, *p < 0.05, ***p < 0.001, two-way ANOVA). (G) ChIP analysis of ELK1 binding at the indicated regions under basal conditions and following NMDA treatment (n = 3, **p < 0.01, two-way ANOVA).
Figure 4
Figure 4. Genome-wide Topo IIβ DNA Cleavage Patterns Coincide with the Sites of Neuronal Activity-Induced DSBs
(A) Genomic regions were categorized into 14 distinct chromatin states based on combinatorial patterns of various chromatin marks (Figure S2A). The percentage of Topo IIβ peaks within each chromatin state were then normalized to the proportion of the genome within that chromatin state and plotted. (B) Publicly available ChIP-seq datasets of SRF and CREB (Kim et al., 2010) were used to determine the binding profiles of Topo IIβ relative to the binding sites of these proteins. The graphs indicate the averaged binding patterns of Topo IIβ within a 4kb window of all SRF (left) and CREB (right) peaks. Dashed line indicates the profile under basal conditions, whereas the solid line depicts the profiles following NMDA treatment. (C) Binding profiles of Topo IIβ within a 4 kb window of CBP peaks at either promoters (left) or enhancers (right) were generated as in (B). (D) UCSC genome browser views denoting the disposition of γH2AX and Topo IIβ signals at Fos and Npas4 under the indicated conditions, y axis denotes signal intensity and the range is indicated in parentheses. (E) γH2AX ChIP-seq signals enriched in etoposide-treated samples relative to controls were processed using CEAS (Cis-Regulatory Element Annotation System) program (http://liulab.dfci.harvard.edu/CEAS/). (Left) Pie chart depicting the relative proportions of the indicated annotated regions in the genome as in Figure 2A. (Right) Disposition of differential γH2AX signals within these annotated genomic regions following etoposide treatment. (F) Aggregate plots of input-normalized γH2AX signals at the 20 loci that show increased γH2AX intensity following NMDA treatment were generated for NMDA-treated (orange), etoposide-treated (blue) and control (gray) conditions. Graph on the left shows the distribution within a 2 kb window of the transcription start site (TSS), whereas the graph on the right denotes the distribution near the transcription termination site (TTS). Plots were generated using annotatePeaks.pl command of HOMER software and custom R scripts.
Figure 5
Figure 5. Activity-Induced DNA DSBs Occur within Topological Domains Defined by CTCF Binding
(A) Topo IIβ peaks in NMDA-treated samples were categorized into two groups—Class I represents new Topo IIβ peaks that appear after NMDA treatment and Class II denotes Topo IIβ peaks that are present under both basal and NMDA-treated conditions. Aggregate plots of γH2AX signals within a 4 kb window relative to Topo IIβ peaks in each class were then generated as in Figure 4F. (B) Motif scans at genome-wide Topo IIβ binding sites under basal conditions revealed a strong enrichment for the CTCF transcription factor binding site motif (CTCF_1; http://www.broadinstitute.org/~pouyak/motifs-table/) in the vicinity of Topo IIβ peaks. The plot denotes the disposition of input-normalized Topo IIβ signals relative to CTCF sites that displayed Topo IIβ peaks in their vicinity. Dashed line denotes the profile of Topo IIβ under basal conditions (control), whereas the solid line indicates Topo IIβ profiles in NMDA-treated samples. (C) Publicly available CTCF ChIP-seq datasets from the cortical plate of 8 week-old mice (GEO: GSM918727) were used to determine the overlap of CTCF and Topo IIβ binding profiles at CTCF motifs that were enriched for Topo IIβ peaks in (B). The gray bar in the middle indicates the width of the CTCF peak at these sites. Dashed line denotes the profile of Topo IIβ under basal conditions (control), whereas the solid line indicates Topo IIβ profiles in NMDA-treated samples. (D) A similar analysis to (C) was conducted using another publicly available CTCF ChIP-seq dataset from mouse neural progenitors (Phillips-Cremins et al., 2013). Grey bar and lines are as in (C). (E) Aggregate plots of input-normalized CTCF (violet) (Phillips-Cremins et al., 2013) and γH2AX (orange) signals within a 4 kb window relative to the transcription start site (TSS) and transcription termination site (TTS) (gray box) of the loci that show increased γH2AX intensity following NMDA treatment. (F) Aggregate plots of input-normalized CTCF (violet) (Phillips-Cremins et al., 2013) and γH2AX(blue) signals within a 4 kb window relative to the TSS and TTS (gray box) of the loci that show increased γH2AX intensity following etoposide treatment.
Figure 6
Figure 6. Topo IIβ-Mediated DNA DSBs Govern the Expression of Early-Response Genes Following Neuronal Activity
(A) Schematic of Fos and Npas4 genes with arrows indicating the positions of sgRNA-directed DNA cleavage by Cas9 (B) HEK293T cells were transfected with luciferase reporter constructs under the control of either Fos or Npas4 upstream sequences, together with the indicated sgRNA and Cas9-carrying constructs and Renilla. Three distinct sgRNAs were used for each locus (#1-#3). Luciferase expression was measured 16 hr after transfection. As a control, luciferase reporter constructs in each case were transfected with Cas9 and sgRNAs directed to the Bdnf promoter (n = 3, *p< 0.05, **p < 0.01, ***p < 0.001, one-way ANOVA) (C) Cultured primary neurons were infected with lentiviral vectors carrying Cas9 and sgRNAs directed to either the Fos or the Npas4 promoter. RNA was extracted 8 days post-infection and the expression of Fos and Npas4 was determined relative to neurons infected with sgRNAs directed to the Bdnf promoter using qRT-PCR (n = 3, **p < 0.01, two-tailed t test). (D) Cultured primary neurons were treated with NMDA as before and allowed to recover in NMDA-free media. Topo IIβ ChIP was then performed at the indicated times and the amplification of the Fos promoter was assessed as in Figure 3A (n = 3, *p < 0.05, two-way ANOVA). (E) Cultured primary neurons were treated with NMDA as before and allowed to recover in NMDA-free media. RNA was then extracted at the indicated times and the expression of Fos, Npas4, and Egr1 was assessed using qRT-PCR (n = 4, ***p < 0.001, one way-ANOVA). (F) Cultured primary neurons were incubated with a specific inhibitor of DNA-PK (NU7026) for 1 hr, following which neurons were treated with NMDA and allowed to recover in NMDA-free media. RNA was extracted 2 hr after the initial NMDA treatment (time = 0, x axis), and the levels of Fos, Npas4, and Egr1 was assessed relative to neurons treated with NMDA in the absence of NU7026 using qRT-PCR (n = 4, *p < 0.05, two-tailed t test). (G) Cultured primary neurons were infected with lentiviral vectors carrying either a scrambled shRNA (control) or one of two distinct shRNAs against Top2b (shRNA#1 or shRNA#2). One week after the infection, neurons were treated with NMDA (50 µM) for 10 min followed by recovery in NMDA-free media for an additional 10 min. Enrichment of γH2AX within exons of Fos, Npas4, and Egr1 was assessed using ChIP. As a control, the Fos promoter region was also probed (n = 3, **p < 0.01, two-way ANOVA). (H) Cultured primary neurons were infected with Top2b shRNAs and treated with NMDA as in (G). RNA was then extracted and the levels of Fos and Npas4 were probed using qRT-PCR (n = 4, **p < 0.01, one-way ANOVA). (I) Scrambled and Top2b shRNAs were stereotactically injected into the hippocampus of two-month old C57BL/6 mice. Four weeks after the injections, acute hippocampal slices were prepared and LTP was induced by 3x TBS at the Schaffer collateral-CA1 synapses. Sample traces represent fEPSPs 1 min before (gray) and 1 hr after (black) TBS. Scale bars, 1 mV and 20 ms (5–6 slices per animal, 3 animals per group, *p < 0.05, one-way ANOVA). (J) Cultured primary neurons were infected with a combination of lentiviral vectors carrying Cas9 and sgRNAs directed to the Fos promoter (CRISPR) together with Top2b shRNAs. Controls represent neurons infected with Cas9 and sgRNAs directed to the Bdnf promoter together with scrambled shRNAs (control). One week after the lentiviral infections, neurons were treated with NMDA (50 µM) for 10 min followed by recovery in NMDA-free media for 10 min. RNA was then extracted and Fos expression was assessed using qRT-PCR (n = 3, *p < 0.05 one-way ANOVA).

Comment in

References

    1. Álvarez-Quilόn A, Serrano-Benítez A, Lieberman JA, Quintero C, Sánchez-Gutiérrez D, Escudero LM, Cortés-Ledesma F. ATM specifically mediates repair of double-strand breaks with blocked DNA ends. Nat. Commun. 2014;5:3347. - PMC - PubMed
    1. Austin CA, Marsh KL. Eukaryotic DNA topoisomerase II beta. BioEssays. 1998;20:215–226. - PubMed
    1. Cortes Ledesma F, El Khamisy SF, Zuma MC, Osborn K, Caldecott KW. A human 5’-tyrosyl DNA phosphodiesterase that repairs topoisomerase-mediated DNA damage. Nature. 2009;461:674–678. - PubMed
    1. Crowe SL, Movsesyan VA, Jorgensen TJ, Kondratyev A. Rapid phosphorylation of histone H2A.X following ionotropic glutamate receptor activation. Eur. J. Neurosci. 2006;23:2351–2361. - PMC - PubMed
    1. Dobbin MM, Madabhushi R, Pan L, Chen Y, Kim D, Gao J, Ahanonu B, Pao P-C, Qiu Y, Zhao Y, Tsai LH. SIRT1 collaborates with ATM and HDAC1 to maintain genomic stability in neurons. Nat. Neurosci. 2013;16:1008–1015. - PMC - PubMed

Publication types

MeSH terms

Associated data