. 2015 May 21:9:60.
doi: 10.3389/fnana.2015.00060. eCollection 2015.

FIB/SEM technology and high-throughput 3D reconstruction of dendritic spines and synapses in GFP-labeled adult-generated neurons

Affiliations

FIB/SEM technology and high-throughput 3D reconstruction of dendritic spines and synapses in GFP-labeled adult-generated neurons

Carles Bosch et al. Front Neuroanat. .

Erratum in

Abstract

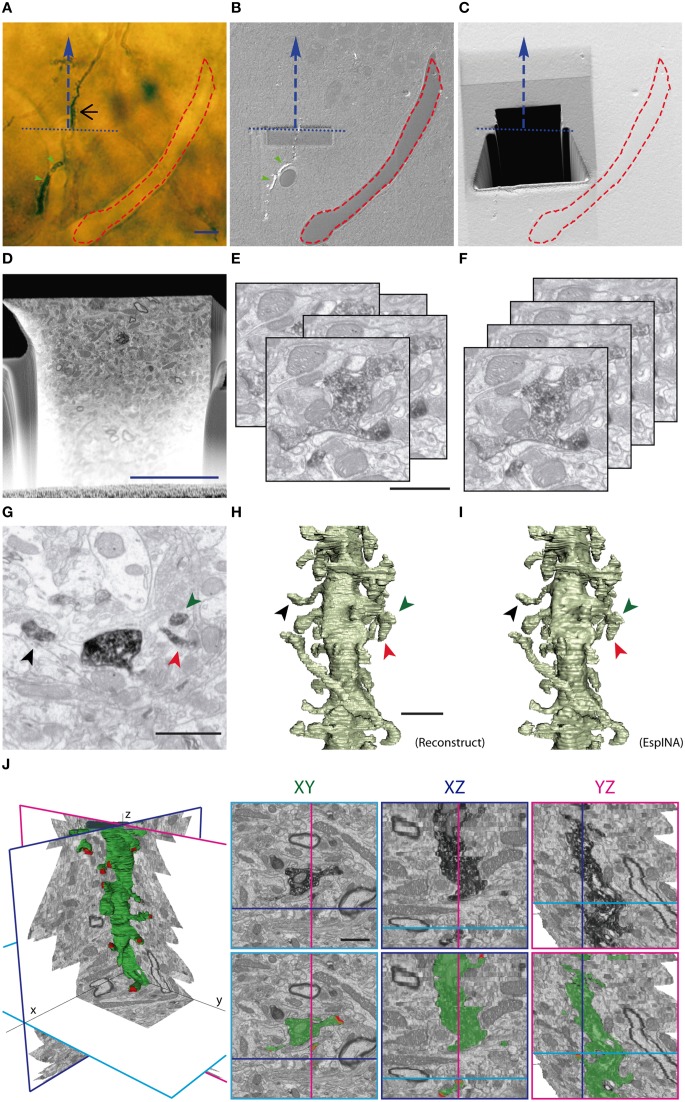
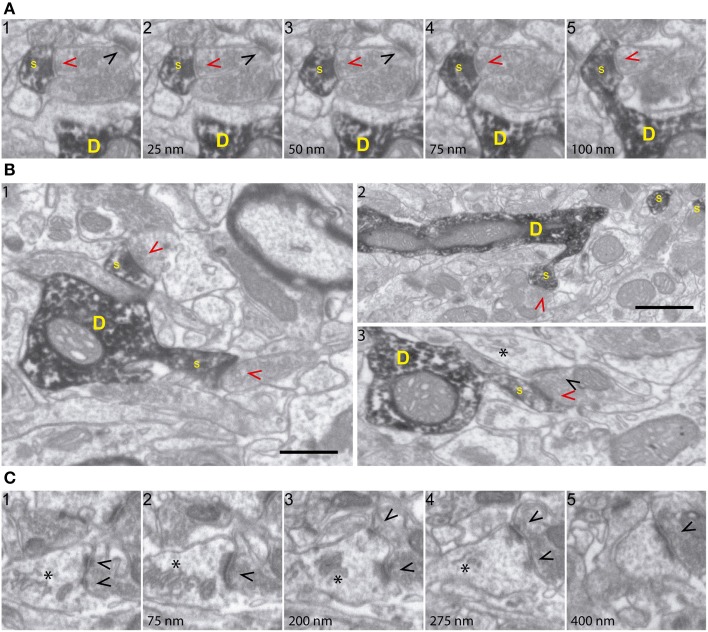
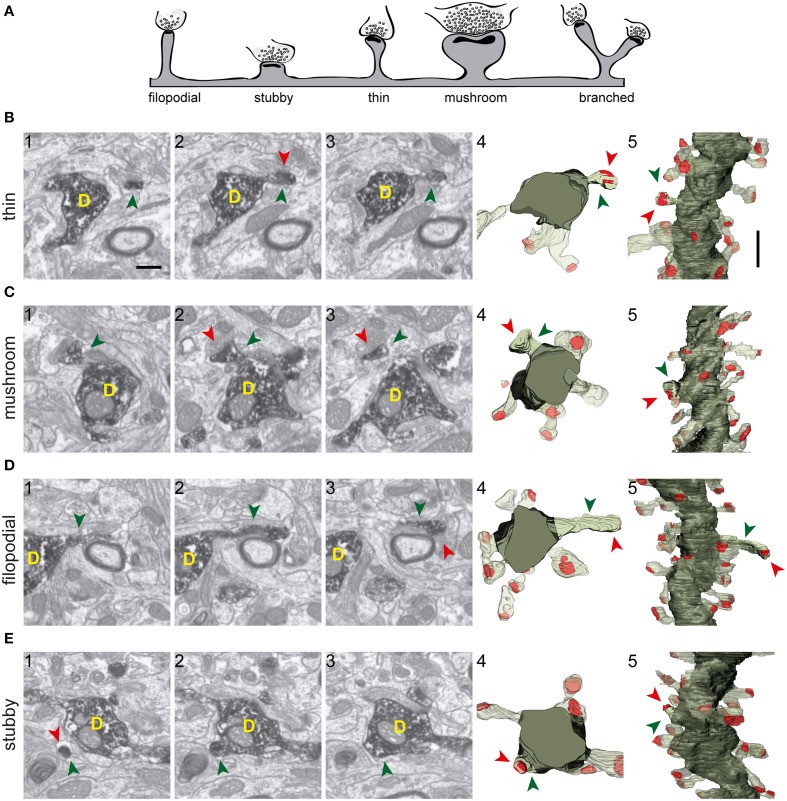
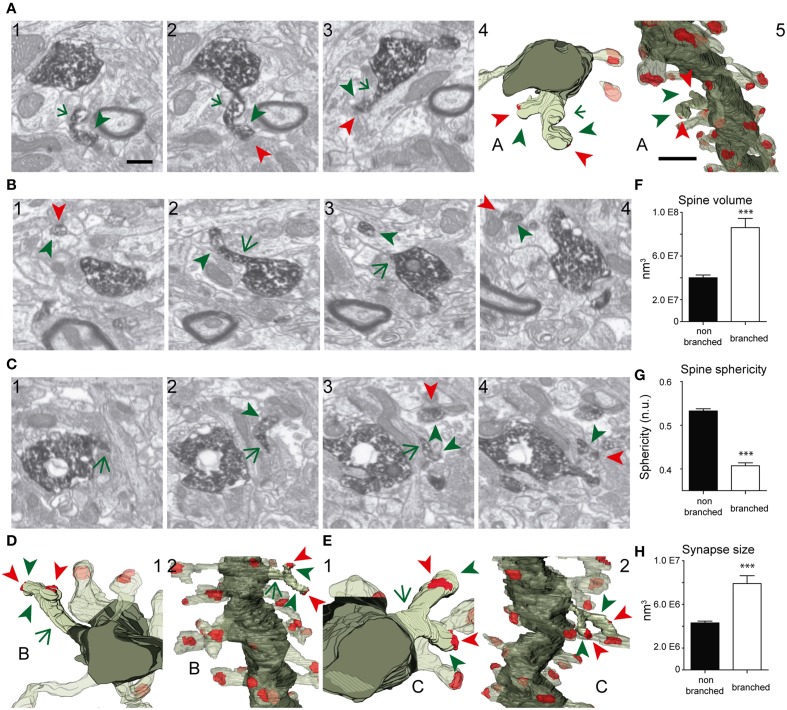
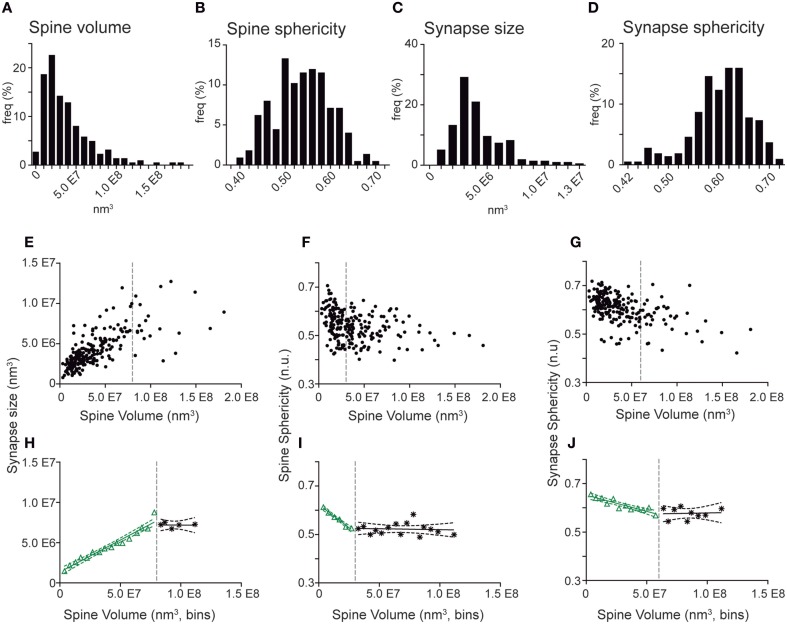
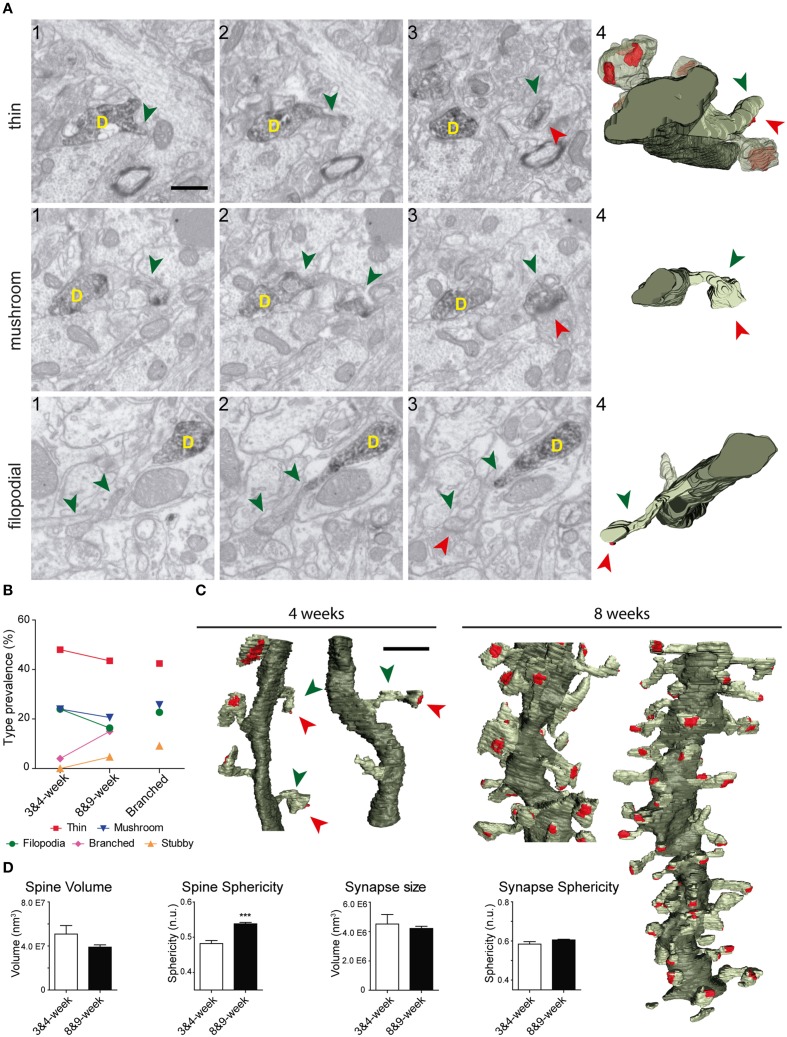
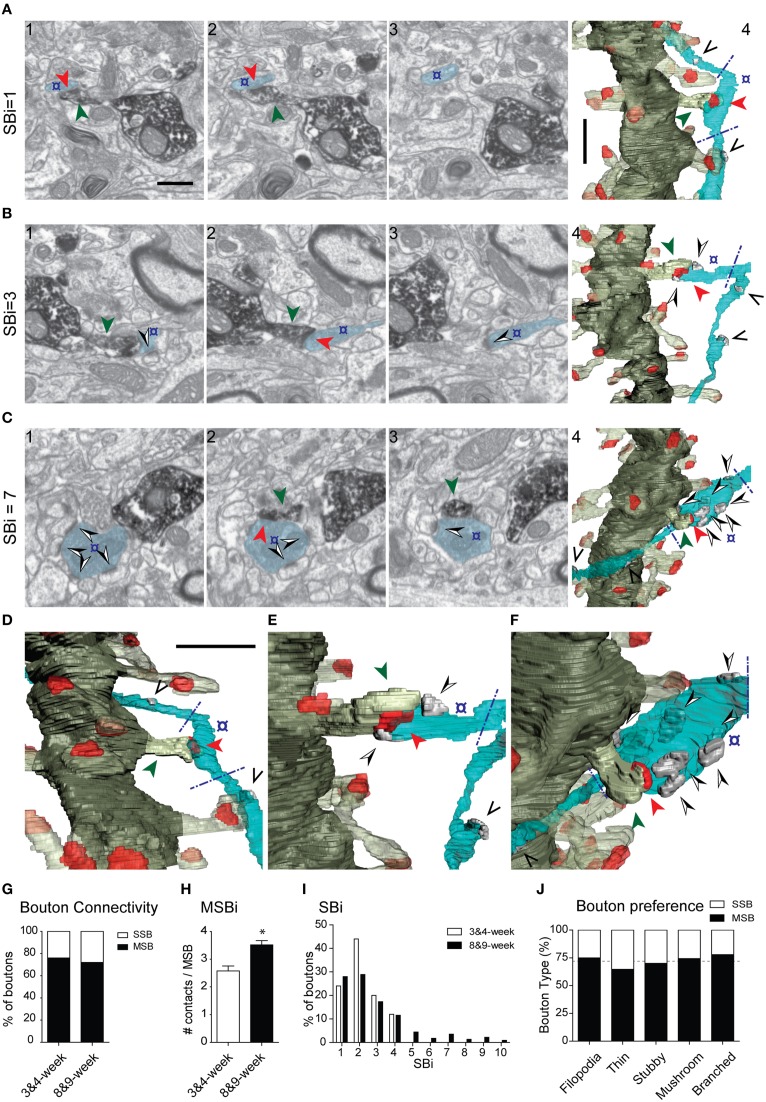
The fine analysis of synaptic contacts is usually performed using transmission electron microscopy (TEM) and its combination with neuronal labeling techniques. However, the complex 3D architecture of neuronal samples calls for their reconstruction from serial sections. Here we show that focused ion beam/scanning electron microscopy (FIB/SEM) allows efficient, complete, and automatic 3D reconstruction of identified dendrites, including their spines and synapses, from GFP/DAB-labeled neurons, with a resolution comparable to that of TEM. We applied this technology to analyze the synaptogenesis of labeled adult-generated granule cells (GCs) in mice. 3D reconstruction of dendritic spines in GCs aged 3-4 and 8-9 weeks revealed two different stages of dendritic spine development and unexpected features of synapse formation, including vacant and branched dendritic spines and presynaptic terminals establishing synapses with up to 10 dendritic spines. Given the reliability, efficiency, and high resolution of FIB/SEM technology and the wide use of DAB in conventional EM, we consider FIB/SEM fundamental for the detailed characterization of identified synaptic contacts in neurons in a high-throughput manner.

Keywords: 3D-reconstruction; FIB/SEM; adult neurogenesis; dendritic spines; electron microscopy; synapses.


Figures

Figure 1
Figure 1
Correlative light and FIB/SEM microscopy of DAB-stained GC dendrites allows high-resolution 3D reconstruction. (A) Light microscopy image of the araldite block surface (after trimming) allows the visualization and selection of the DAB-stained dendrite (black arrow) and the annotation of surface fiducial landmarks, such as blood vessels (red dashed line). The course line (blue dashed arrow) defines the trajectory of the dendrite of interest and the selected direction for serial milling and image acquisition. The blue dotted line indicates the desired acquisition starting plane. (B) SEM image of the block surface, revealing conserved traits (red dashed line, green arrowheads), allows the identification of the pre-selected starting plane for serial image acquisition. Note that dendritic segments that evolve at the block surface are visible in SEM (green arrowheads), but not dendritic segments evolving entirely below the surface (black arrow in A). (C) A trapezoidal trench has been milled behind the starting line (blue pointed line) to gain access to the region of interest. Afterwards, a smaller trench has been sequentially milled and imaged in the direction indicated by the blue dashed line. (D) Low magnification SEM backscattered electron image showing a freshly milled surface of the trench face during one of the milling-imaging cycles. The dendrite of interest is labeled by a red arrow. (E,F) Image acquisition provides up to several hundred serial images (E) that require alignment procedures (F) to obtain properly oriented stacks ready for 3D visualization and segmentation. (G,H) Spine identification in individual micrographs (G); stacks serial images can be further traced to obtain 3D reconstructions performed with either manual segmentation with Reconstruct software (H) or with the EspINA software, which allows faster semi-automated reconstructions (I). Note that the overall quality of 3D reconstructions using Reconstruct or EspINA are similar. (J) EspINA software allows the segmentation and visualization of labeled structures on the three orthogonal planes before and after segmentation (upper and lower rows, respectively). Scale bars are 10 μm in (A,D) 1 μm in (E,J).
Figure 2
Figure 2
FIB/SEM microscopy allows high-resolution ultrastructural analysis of identified synapses. (A) Five consecutive serial images (a1-5; spaced 25 nm each) demonstrating high fine structural resolution of GFP/DAB-stained dendrites, on both the XY and Z axes. The sequence shows a spine (s) emerging from the parent dendrite (D) and a presynaptic terminal forming a synapse with the labeled spine (red arrowhead) and with an unlabeled spine (black arrowhead). Note that 25 nm thick Z-axis image acquisitions allow efficient and repetitive visualization of structures of interest, such as synapses and spine necks. (B) Various FIB/SEM images (b1-3) demonstrating overall ultrastructural quality and the unambiguous identification of dendrites (D), spines (s), and axon terminals establishing synapses with either labeled (red arrowheads) or unlabeled (black arrowheads) profiles. (C) Selected serial/correlative images (c1-5; spaced 75–125 nm) showing distinct features, including spine apparatus (asterisk) and a perforated synapse (black arrowheads), on a single unlabeled spine. Scale bar in (B1) is 0.5 μm and applies to all panels, except for (B2), which corresponds to 1 μm.
Figure 3
Figure 3
Types of spines arising from 8-week-old GFP/DAB-labeled GCs as reconstructed with FIB/SEM microscopy. (A) Schematic representation of four e types of spines defined in the present study. Examples of thin (B), mushroom (C), filopodial (D), and stubby (E) spines arising from their parent dendrite (D). The left images (1–3) show selected serial planes of the spines depicting the head (green arrowheads), neck, and synaptic contact (red arrowheads). The right 3D reconstructions (4–5) show the labeled spines in two orthogonal orientations. The dendritic shaft (D) is shown in solid dark green, the spine of interest in solid pale green, and its synapse in solid red. Neighboring spines and synapses are indicated in light pale green and red, respectively. Scale bar in (B1) is 0.5 μm and applies to (B–E 1–4). Scale bar in (B5) is 1 μm and applies to (B–E5).
Figure 4
Figure 4
FIB/SEM images and the corresponding 3D reconstructions illustrating branched spines in GCs aged 8–9 weeks. (A–C) Serial FIB/SEM images illustrating three examples of branched spines: A1–3 (spine A), B1–4 (spine B), and C1–4 (spine C). The corresponding 3D reconstructions are shown in two orthogonal orientations in panels A4,5 (spine A), D1,2 (spine B), and E1,2 (spine C). The labeling of synaptic contacts is as in Figure 3. The spine heads are shown by green arrowheads, the shared neck by a green arrow, and their synaptic contacts by red arrowheads. The colors in the 3D reconstructions are as follows: the dendritic shaft in solid dark green, the spine of interest in solid pale green, and its synapses in solid red. Neighboring spines and synapses are colored in light pale green and red, respectively. (F–H) Histograms showing average spine volume (F), spine sphericity (G), and synapse size (H) in non-branched and branched spines. Data represent mean ± SEM; *p < 0.05; **p < 0.01; ***p < 0.001; Mann–Whitney test. Scale bar in (A1) is 0.5 μm and is applicable to (A–C 1–4, and D-E1). Scale bar in (A5) is 1 μm and is applicable to (A5, D2, and E2). Abbreviations: n.u., no units.
Figure 5
Figure 5
Quantitative correlations of spine volumes and other morphometric parameters in spines and synapses from GC aged 8–9 weeks. (A–D) Frequency histograms show the distribution of spine volume (A), spine sphericity (B), synapse size (C), and synapse sphericity (D). Note that all distributions display a continuous range of values. (E–G) Plots showing correlation of individual spine volumes with synapse size (E), spine sphericity (F), and synapse sphericity (G). (H–J). Binned analysis of the data shown in (E–G) revealing linear regressions between spine volume and synaptic size (H), spine sphericity (I), and synapse sphericity (J) above (black) and below (green) defined volume thresholds (dashed gray lines). Dashed green and black lines represent the 95% confidence intervals for these fits. The data show that the three parameters evolve linearly with spine volumes until a certain threshold, after which the three parameters remain constant. Note in (E–G) that these parameters no longer correlate above these thresholds. Detailed correlation analyses are provided in Supplementary Table 2.
Figure 6
Figure 6
Comparative analysis of spines in GC aged 3–4 and 8–9 weeks. (A) Examples of thin, filopodial, and mushroom spines arising from their parent dendrite (D) in 3- to 4-week-old GCs. The three left images (1–3) show selected serial planes of the spines, depicting the head (green arrowheads), neck, and synaptic contact (red arrowheads). The 3D reconstructions are shown to the right (4). (B) Plots showing the percentages of the different types of spines at 3–4 and 8–9 weeks; percentages of spine types are also shown for branched spines (right). (C) 3D reconstructions allowing comparison of dendritic segments and spines at 3–4 and 8–9 weeks. The color code is the same as described in Figure 3. (D) Histograms showing spine volumes and sphericity and synapse size and sphericity at both ages. Data represent mean ± SEM. ***p < 0.001; Mann–Whitney test. Scale bar in (A) is 0.5 μm. Scale bar in (C) is 1 μm.
Figure 7
Figure 7
Presynaptic innervation of GC spines at 3–4 and 8–9 weeks. (A–C) Three examples of synaptic configurations. The left FIB/SEM images (1–3) show selected serial planes of the dendritic spines and presynaptic boutons; (A) presynaptic bouton (o) contacting (red arrowhead) exclusively the DAB-labeled spine (green arrowhead); (B,C) axon terminals forming complex synaptic configurations contacting both the labeled spine and several unlabeled dendritic spines (black and white arrowheads) (B,C). The corresponding 3D reconstructions are shown to the right (A4, B4, C4), as well as magnified tilted orientations in DF, respectively. The number of postsynaptic spines innervated by the same bouton (SBi, Synaptic Bouton index) is shown to the left. Note that only the varicosities presynaptic to the labeled spine were analyzed (delimited by blue dashed lines in the 3D panels). The axons may establish other synapses elsewhere, not analyzed (black arrowheads in the 3D panels). The example shown in (B) illustrates a multisynaptic bouton establishing a total of three synapses and the example illustrated in (C) establishes seven synapses. The color code is as described in Figure 3; additionally, the axon is shown in light blue, and synapses established by the axon onto non-labeled spines in solid gray. (G) Percentage of single-synaptic (SSB) and multi-synaptic (MSB) boutons in dendritic spines aged 3–4 and 8–9 weeks. (H) Average number of synaptic contacts established by MSBs at 3–4 and 8–9 weeks. (I) Histogram showing the frequency of synaptic contacts established by axon terminals at 3–4 and 8–9 weeks. (J) Multisynaptic boutons innervate all spine types and morphologies equally. Percentage of single-synaptic (SSB) and multi-synaptic (MSB) boutons in various types of dendritic spines in 8- to 9-week-old neurons; the dashed line indicates the overall percentage of SSBs and MSBs. Data represent mean ± SEM. *p < 0.05; Mann–Whitney test. Scale bar in (A1) is 0.5 μm and applies to (A–C, 1–3). Scale bar in (A4) is 1 μm and applies to (A–C4). Scale bar in (D) is 1 μm and applies to (D–F).

References

    1. Aimone J. B., Deng W., Gage F. H. (2011). Resolving new memories: a critical look at the dentate gyrus, adult neurogenesis, and pattern separation. Neuron 70, 589–596. 10.1016/j.neuron.2011.05.010 - DOI - PMC - PubMed
    1. Allegra Mascaro A. L., Cesare P., Sacconi L., Grasselli G., Mandolesi G., Maco B., et al. (2013). In vivo single branch axotomy induces GAP-43-dependent sprouting and synaptic remodeling in cerebellar cortex. Proc. Natl. Acad. Sci. U.S.A. 110, 10824–10829. 10.1073/pnas.1219256110 - DOI - PMC - PubMed
    1. Arellano J. I., Benavides-Piccione R., Defelipe J., Yuste R. (2007). Ultrastructure of dendritic spines: correlation between synaptic and spine morphologies. Front. Neurosci. 1, 131–143. 10.3389/neuro.01.1.1.010.2007 - DOI - PMC - PubMed
    1. Blazquez-Llorca L., Merchán-Pérez A., Rodríguez J.-R., Gascón J., Defelipe J. (2013). FIB/SEM Technology and Alzheimer's disease: three-dimensional analysis of human cortical synapses. J. Alzheimers Dis. 34, 995–1013. 10.3233/JAD-122038 - DOI - PubMed
    1. Bock D. D., Lee W. C., Kerlin A. M., Andermann M. L., Hood G., Wetzel A. W., et al. (2011). Network anatomy and in vivo physiology of visual cortical neurons. Nature 471, 177–182. 10.1038/nature09802 - DOI - PMC - PubMed