. 2015 Jun 8:4:e08352.
doi: 10.7554/eLife.08352.

Forebrain deletion of the dystonia protein torsinA causes dystonic-like movements and loss of striatal cholinergic neurons

Affiliations

Forebrain deletion of the dystonia protein torsinA causes dystonic-like movements and loss of striatal cholinergic neurons

Samuel S Pappas et al. Elife. .

Abstract

Striatal dysfunction plays an important role in dystonia, but the striatal cell types that contribute to abnormal movements are poorly defined. We demonstrate that conditional deletion of the DYT1 dystonia protein torsinA in embryonic progenitors of forebrain cholinergic and GABAergic neurons causes dystonic-like twisting movements that emerge during juvenile CNS maturation. The onset of these movements coincides with selective degeneration of dorsal striatal large cholinergic interneurons (LCI), and surviving LCI exhibit morphological, electrophysiological, and connectivity abnormalities. Consistent with the importance of this LCI pathology, murine dystonic-like movements are reduced significantly with an antimuscarinic agent used clinically, and we identify cholinergic abnormalities in postmortem striatal tissue from DYT1 dystonia patients. These findings demonstrate that dorsal LCI have a unique requirement for torsinA function during striatal maturation, and link abnormalities of these cells to dystonic-like movements in an overtly symptomatic animal model.

Keywords: cholinergic interneurons; dystonia; mouse; neurodegeneration; neurogenetics; neuroscience; striatum; torsinA.


Conflict of interest statement

The authors declare that no competing interests exist.

Figures
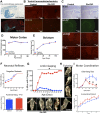
Figure 1.
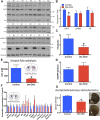
Figure 1.. Conditional TorsinA deletion from forebrain GABAergic and cholinergic neurons causes dystonic-like movements in juvenile mice.
(A) Dlx5/6-Cre expression is restricted to forebrain, as demonstrated by rosa26 LacZ and mT/mG reporter lines. (B) TorsinA immunohistochemistry demonstrates complete torsinA deletion in the striatum and partial deletion in the cortex. (C) Dlx-CKO mouse forebrain architecture appears normal (Nissl) and there is no evidence of gliosis (GFAP, s100β, Iba-1). (DE) Gross striatal and cortical development appears normal. Cortical thickness: two-way ANOVA main effect of age F3,65 = 17.24; p < 0.0001, genotype F1,65 = 0.35; p = 0.55); striatal volume: main effect of age F3,65 = 307.0; p < 0.0001; genotype F1,65 = 0.724; p = 0.39. (F) The behavior of neonatal Dlx-CKO mice is normal. Negative geotaxis and forelimb suspension did not differ from littermate controls. Forelimb suspension: t-test t(92) = 0.753; p = 0.45). (GH) Dlx-CKO mice develop severe forelimb and hindlimb clasping at P15 (Chi square test, Χ2 = 64.03; p < 0.0001), and a subset exhibits severe trunk twisting. (I) Dlx-CKO mice develop an inability to hang from a wire grid at 1 month of age (two-way ANOVA; main effect of genotype F1,269 = 16.63; p < 0.0001, time F6,269 = 6.613; p < 0.0001; and interaction F6,269 = 2.285; p = 0.036). Motor learning remains intact, as demonstrated by the accelerating rotarod test (two-way ANOVA main effect of trial F9,324 = 38.27 p < 0.0001, genotype: F1,36 = 3.591; p = 0.066). DOI: http://dx.doi.org/10.7554/eLife.08352.003
Figure 1—figure supplement 1.
Figure 1—figure supplement 1.. Postnatal weight gain is normal in Dlx-CKO mice.
Dlx-CKO mice exhibit normal postnatal growth, minor differences in weight after weaning, and no differences after maturation (two-way ANOVA main effect of age F5,230 = 1022, p < 0.0001; genotype F1,230 = 7.903, p = 0.005; interaction F5,230 = 9.76, p < 0.0001; Sidak's multiple comparisons test). DOI: http://dx.doi.org/10.7554/eLife.08352.004
Figure 1—figure supplement 2.
Figure 1—figure supplement 2.. Dlx-CKO mice exhibit normal motor function during gait.
(AI) results from digigait analysis. Genotype differences were present in stance width (two-way ANOVA main effect of genotype F1,62 = 16.51, p < 0.0001; limb F1,62 = 70.90, p < 0.0001; Interaction F1,62 = 0.381, p = 0.539, Sidak's multiple comparisons test), but no other abnormalities were observed. DOI: http://dx.doi.org/10.7554/eLife.08352.005
Figure 1—figure supplement 3.
Figure 1—figure supplement 3.. Dlx-CKO mice are hyperactive.
(A) Open field analysis of horizontal movements (two-way ANOVA main effect of genotype F1,35 = 16.29, p = 0.0003; time F11,385 = 12.72, p < 0.0001; interaction F11,385 = 1.713, p = 0.06, Bonferroni's multiple comparisons test). (B) Open field analysis of vertical movements (two-way ANOVA main effect of genotype F1,35 = 10.72, p = 0.002; time F11,385 = 4.176, p < 0.0001; interaction F11,385 = 1.07, p = 0.37, Bonferroni's multiple comparisons test). DOI: http://dx.doi.org/10.7554/eLife.08352.006
Figure 2.
Figure 2.. Antimuscarinic drugs ameliorate clasping and twisting behaviors in Dlx-CKO mice.
(A) Examples of forelimb clasping, hindlimb clasping, and trunk twisting that were evaluated during review of the videos by blinded raters. (B) Duration of clasping and twisting was significantly reduced by once-daily 5 mg/kg scopolamine administration (tail suspension recorded 45 min following drug treatment; two-way ANOVA: main effect of drug F1,141 = 36.14; p < 0.0001, Sidak's multiple comparisons test. n = 8 saline, n = 6 scopolamine. This study was also repeated in a second cohort). (C) Clasping and twisting duration was reduced by once-daily 5 mg/kg THP administration compared to saline-treated mice (tail suspension recorded 45 min following drug treatment; two-way ANOVA main effect of drug F1,82 = 46.69, p < 0.0001, Sidak's multiple comparison test. n = 6 saline, n = 8 THP). DOI: http://dx.doi.org/10.7554/eLife.08352.007
Figure 3.
Figure 3.. Cholinergic-specific abnormalities in the striatum of Dlx-CKO mice.
(A) Western blots of microdissected striatum from 10 week old control and Dlx-CKO mice for markers of cholinergic, GABAergic, and dopaminergic signaling. (BD) Quantification of the western blots demonstrated a selective reduction of LCI markers choline acetyltransferase (t-test: t (8) = 2.683; p = 0.013) and TrkA (t(8) = 1.883; p = 0.048). No differences were observed for markers of GABAergic or dopaminergic neurons (GAD67; t(8) = 0.012; p = 0.99; TH; t(8) = 0.742; p = 0.47; DARPP-32; t(8) = 1.12; p = 0.29). (E) Microdialysis and HPLC-MS analysis demonstrates a significant reduction of ACh in dorsal striatum of Dlx-CKO mice (t-test: t(12) = 3.895; p = 0.002; data reported as dialysate concentration and represent the average of 3 fractions per animal following neostigmine perfusion; n = 6–8 probes/group from 4 mice/group). (F) Microdialysis followed by benzoyl chloride derivatization and analysis by LC-MS demonstrated no significant change in any dorsal striatal neurotransmitter examined (basal values measured in absence of Acetylcholinesterase (AChE) inhibitors). Data represent the average of 5 basal collections per animal (n = 7 probes/group from 4 mice/group and are normalized to control levels (two-way ANOVA for genotype: F1,190 = 0.0206; p = 0.88). (G) AChE histochemistry on fresh frozen brain sections demonstrates a significant reduction of striatal AChE in Dlx-CKO mice (t-test; t(22) = 5.16; p < 0.0001). Specificity of AChE reaction was confirmed using several methods (Figure 3—figure supplement 1). DOI: http://dx.doi.org/10.7554/eLife.08352.008
Figure 3—figure supplement 1.
Figure 3—figure supplement 1.. AChE histochemistry is selective for AChE.
Assay controls demonstrate that omitting substrate, substituting an alternate thiocholine substrate, or inhibiting AChE activity with neostigmine fully abolishes staining. DOI: http://dx.doi.org/10.7554/eLife.08352.009
Figure 4.
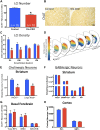
Figure 4.. Large cholinergic interneurons are selectively Lost from the striatum of Dlx-CKO mice.
(A, B) Stereological quantification of the number of ChAT-positive neurons in the striata of Dlx-CKO and littermate control mice (t-test: t(23) = 5.87; p < 0.0001). (C) Characterization of the topology of ChAT-positive cell loss in dorsal striatum. Significant decreases in ChAT-positive cells were observed only in the dorsal quadrants. Two-way ANOVA main effects of genotype: F1,56 = 38.17; p < 0.0001 and interaction: F3,56 = 6.405; p = 0.0008. (D) Pseudocolor representation of the degree of ChAT-positive cell loss in the dorsal striatum of Dlx-CKO mice. (E) Stereological quantification of the number of VAChT-positive and large (>20 μm diameter soma) Nissl-stained cells. VAChT t(13) = 3.305; p = 0.005, Nissl t(13) = 5.293; p = 0.0001. (F) Stereological quantification of the number of striatal small/medium (<20 μm diameter soma) nissl-positive cells (nissl+, t(13) = 0.606; p = 0.549), medium spiny neurons (DARPP-32+: t(22) = 1.14; p = 0.266), and SST- and PV-expressing inhibitory interneuron classes (PV+: t(23) = 2.806, p = 0.01 SST+: t(23) = 0.6865; p = 0.499). (G) Stereological quantification of the number of ChAT-positive neurons in basal forebrain nuclei (BFC—Basal Forebrain Complex, MS—Medial Septum, VDB—Vertical Limb of the Diagonal Band) of Dlx-CKO and littermate control mice (t(7) = 0.392; p = 0.706). (H) Stereological quantification of the number of cortical SST- and PV-expressing inhibitory interneuron classes (PV+: t(15) = 1.32; p = 0.206; SST+: t(15) = 1.18; p = 0.256). DOI: http://dx.doi.org/10.7554/eLife.08352.010
Figure 4—figure supplement 1.
Figure 4—figure supplement 1.. LCI cell loss is most prominent in dorsolateral striatum.
Percent cell density reductions in striatal quadrants as compared to control striata. Cell loss occurred in a dorsal to ventral gradient. DOI: http://dx.doi.org/10.7554/eLife.08352.011
Figure 4—figure supplement 2.
Figure 4—figure supplement 2.. TorsinA is deleted from basal forebrain cholinergic neurons in Dlx-CKO mice.
TorsinA and ChAT costains demonstrate torsinA expression in basal forebrain cholinergic projection neurons from control but not in Dlx-CKO mice. DOI: http://dx.doi.org/10.7554/eLife.08352.012
Figure 5.
Figure 5.. Dlx-CKO LCIs degenerate during juvenile striatal maturation, coincident with the onset of abnormal twisting.
(A) Stereological quantification of the number of ChAT-positive neurons in the striata of Dlx-CKO and littermate control mice at time points between postnatal day 7 and 168. Two-way ANOVA main effects of age: F3,66 = 2.899; p = 0.04, genotype: F1,66 = 33.74; p < 0.0001, and interaction: F3,66 = 7.232; p = 0.0003; * represents time points where significant differences exist using Sidak's multiple comparison test. (B, C) Quantification of the number of ChAT-positive striatal neurons co-expressing cleaved caspase-3 between P10 and P24 in control and Dlx-CKO brain sections (two-way ANOVA main effects of age F2,21 = 43.68; p < 0.0001, genotype: F1,21 = 122.1; p < 0.0001, and interaction F2,21 = 32.91; p < 0.0001). DOI: http://dx.doi.org/10.7554/eLife.08352.013
Figure 5—figure supplement 1.
Figure 5—figure supplement 1.. ChAT and TrkA expression is normal at P7.
Western blot analysis demonstrates no differences in ChAT or TrkA levels at postnatal day 7, a time point when no behavioral or cellular deficits are present. DOI: http://dx.doi.org/10.7554/eLife.08352.014
Figure 5—figure supplement 2.
Figure 5—figure supplement 2.. There are no differences in the number of non-cholinergic apoptotic striatal cells.
Although there are significantly more apoptotic cholinergic interneurons, there are no differences in the number of non-cholinergic apoptotic cells, as measured by expression of cleaved caspase-3 (two-way-ANOVA main effect of age F2,21 = 18.93, p < 0.0001; genotype F1,21 = 2.371, p = 0.13; interaction F2,21 = 0.04, p = 0.96). DOI: http://dx.doi.org/10.7554/eLife.08352.015
Figure 6.
Figure 6.. Surviving striatal LCIs exhibit cell soma hypertrophy.
(A) Quantification of ChAT-positive cell soma area in dorsal striatum between postnatal day 7 and 168 (two-way ANOVA significant main effect of genotype F1,60 = 12.51; p = 0.0008 and time F3,60 = 117.8; p < 0.0001, Tukey's multiple comparison test). (B) Frequency histogram of cell soma area data at postnatal day 168. (C, D) Cell soma area of striatal and cortical GABAergic interneurons and striatal MSNs at postnatal day 168. (E) Example of Golgi-Cox-stained MSN and dendritic tree reconstruction. (FH) Analysis of dendritic complexity (n = 69 control, 25 Dlx-CKO neurons). No differences observed in average highest dendritic branch order (one-way ANOVA F3,90 = 1.079; p = 0.36), dendritic length (one-way ANOVA F3,92 = 1.023; p = 0.386), or intersections on sholl analysis (two-way ANOVA F1,92 = 0.019; p = 0.89). DOI: http://dx.doi.org/10.7554/eLife.08352.016
Figure 7.
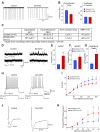
Figure 7.. Surviving LCIs exhibit changes in excitability and abnormal synaptic inputs.
(A) Sample cell-attached recordings from tonically active control and Dlx-CKO LCIs. (B) Mean frequencies of spontaneous firing (cell-attached) and coefficients of variation from control and Dlx-CKO LCIs. (C) Capacitance, input resistance, time constant, and resting membrane potential values from recordings with K-gluconate internal solution. (D) Sample recordings of sIPSCs and sEPSCs. (E) Mean sIPSC frequency from Dlx-CKO LCIs was significantly greater than that of control LCIs (p = 0.006). (F) Mean sEPSC frequencies from both genotypes were similar. (G) Ratio of sIPSC/sEPSC indicates that Dlx-CKO LCIs received significantly more inhibitory inputs than control LCIs (p = 0.05). (H) Examples of typical responses of control and Dlx-CKO LCIs to injected current pulses. Control LCIs generated more action potentials. (I) Mean numbers of action potentials are significantly reduced in Dlx-CKO LCIs at higher injected currents (two-way ANOVA with posthoc Bonferroni test, p < 0.001). (J) Sample traces of evoked EPSCs in control and Dlx-CKO LCIs. (K) Peak amplitudes of evoked EPSCs were significantly larger in Dlx-CKO LCIs (two-way ANOVA with posthoc Bonferroni test, p < 0.01). DOI: http://dx.doi.org/10.7554/eLife.08352.017
Figure 8.
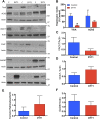
Figure 8.. DYT1 dystonia postmortem putamen displays selective reductions in cholinergic markers.
(A) Western Blot analysis of postmortem putamen samples from 3 dystonia patients and 3 age-matched control subjects. (B) Significant reductions in TrkA expression (t-test; t(4) = 4.413; p = 0.014). (BF) No significant alterations in AChE (t(4) = 0.940; p = 0.400), VAChT (t(4) = 0.208; p = 0.208), ChAT (t(df = 4) = 1.766; p = 0.152), TH (t(4) = 0.7459; p = 0.497), or GAD67 (t(4) = 0580; p = 0.593). DOI: http://dx.doi.org/10.7554/eLife.08352.018

References

    1. Albin RL, Cross D, Cornblath WT, Wald JA, Wernette K, Frey KA, Minoshima S. Diminished striatal [123I]iodobenzovesamicol binding in idiopathic cervical dystonia. Ann Neurol. 2003;53:528–532. - PubMed
    1. Alexander GE, DeLong MR, Strick PL. Parallel organization of functionally segregated circuits linking basal ganglia and cortex. Annual Review of Neuroscience. 1986;9:357–381. doi: 10.1146/annurev.ne.09.030186.002041. - DOI - PubMed
    1. Berke JD. Functional properties of striatal fast-spiking interneurons. Frontiers in Systems Neuroscience. 2011;5:45. doi: 10.3389/fnsys.2011.00045. - DOI - PMC - PubMed
    1. Bressman SB, Sabatti C, Raymond D, de Leon D, Klein C, Kramer PL, Brin MF, Fahn S, Breakefield X, Ozelius LJ, Risch NJ. The DYT1 phenotype and guidelines for diagnostic testing. Neurology. 2000;54:1746–1752. doi: 10.1212/WNL.54.9.1746. - DOI - PubMed
    1. Burke RE, Fahn S, Marsden CD. Torsion dystonia: a double-blind, prospective trial of high-dosage trihexyphenidyl. Neurology. 1986;36:160–164. doi: 10.1212/WNL.36.2.160. - DOI - PubMed

Publication types