Contrasting environmental drivers of adult and juvenile growth in a marine fish: implications for the effects of climate change
- PMID: 26052896
- PMCID: PMC4460954
- DOI: 10.1038/srep10859
Contrasting environmental drivers of adult and juvenile growth in a marine fish: implications for the effects of climate change
Abstract
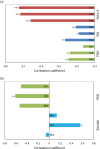
Many marine fishes have life history strategies that involve ontogenetic changes in the use of coastal habitats. Such ontogenetic shifts may place these species at particular risk from climate change, because the successive environments they inhabit can differ in the type, frequency and severity of changes related to global warming. We used a dendrochronology approach to examine the physical and biological drivers of growth of adult and juvenile mangrove jack (Lutjanus argentimaculatus) from tropical north-western Australia. Juveniles of this species inhabit estuarine environments and adults reside on coastal reefs. The Niño-4 index, a measure of the status of the El Niño-Southern Oscillation (ENSO) had the highest correlation with adult growth chronologies, with La Niña years (characterised by warmer temperatures and lower salinities) having positive impacts on growth. Atmospheric and oceanographic phenomena operating at ocean-basin scales seem to be important correlates of the processes driving growth in local coastal habitats. Conversely, terrestrial factors influencing precipitation and river runoff were positively correlated with the growth of juveniles in estuaries. Our results show that the impacts of climate change on these two life history stages are likely to be different, with implications for resilience and management of populations.
Figures


References
-
- Whitehead P. J. P. Clupeidae in Fishes of the north-eastern Atlantic and the Mediterranean, Vol. 1 (eds Whitehead P. J. P. et al.. ) 28–281 (UNESCO, 1984).
-
- Cohen D. M., Inada T., Iwamoto T. & Scialabba N. Gadiform fishes of the world (Order Gadiformes) in FAO Species catalogue, Vol. 10. (FAO, 1990).
-
- Elliott M. et al.. The guild approach to categorizing estuarine fish assemblages: a global review. Fish Fish. 8, 241–268 (2007).
-
- Sutherland W. J. in From individual behaviour to population ecology. (Oxford University Press, 1996).
-
- Drinkwater K. F. et al.. On the processes linking climate to ecosystem changes. J. Mar. Syst. 79, 374–388 (2010).
Publication types
MeSH terms
LinkOut - more resources
Full Text Sources
Other Literature Sources

