. 2015 Jul 9;523(7559):217-20.
doi: 10.1038/nature14460. Epub 2015 Jun 8.

Global circulation patterns of seasonal influenza viruses vary with antigenic drift

Affiliations

Global circulation patterns of seasonal influenza viruses vary with antigenic drift

Trevor Bedford et al. Nature. .

Abstract

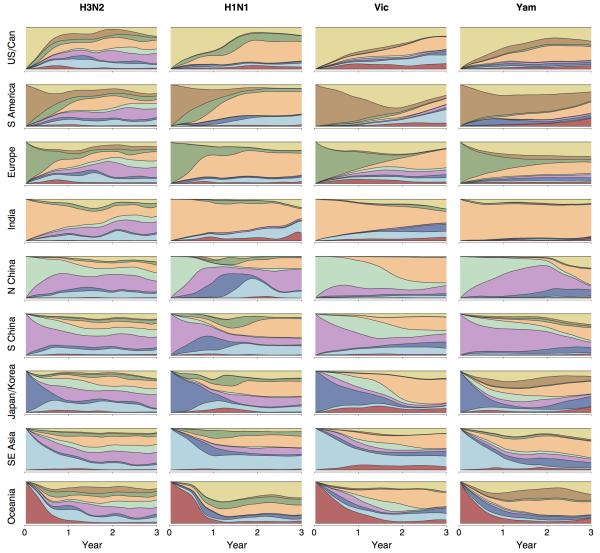
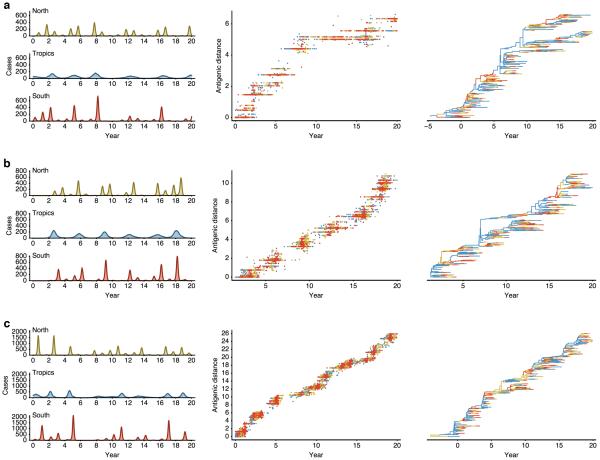
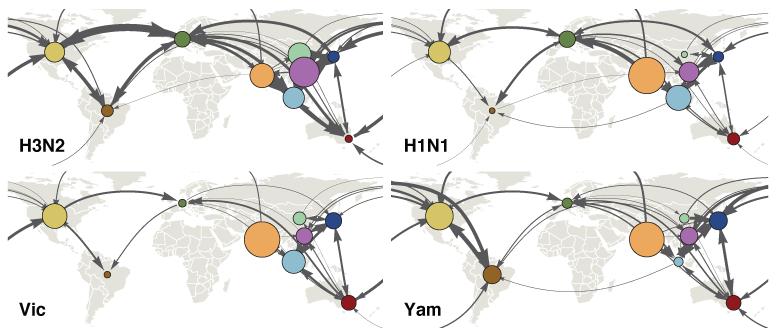
Understanding the spatiotemporal patterns of emergence and circulation of new human seasonal influenza virus variants is a key scientific and public health challenge. The global circulation patterns of influenza A/H3N2 viruses are well characterized, but the patterns of A/H1N1 and B viruses have remained largely unexplored. Here we show that the global circulation patterns of A/H1N1 (up to 2009), B/Victoria, and B/Yamagata viruses differ substantially from those of A/H3N2 viruses, on the basis of analyses of 9,604 haemagglutinin sequences of human seasonal influenza viruses from 2000 to 2012. Whereas genetic variants of A/H3N2 viruses did not persist locally between epidemics and were reseeded from East and Southeast Asia, genetic variants of A/H1N1 and B viruses persisted across several seasons and exhibited complex global dynamics with East and Southeast Asia playing a limited role in disseminating new variants. The less frequent global movement of influenza A/H1N1 and B viruses coincided with slower rates of antigenic evolution, lower ages of infection, and smaller, less frequent epidemics compared to A/H3N2 viruses. Detailed epidemic models support differences in age of infection, combined with the less frequent travel of children, as probable drivers of the differences in the patterns of global circulation, suggesting a complex interaction between virus evolution, epidemiology, and human behaviour.


Figures

Extended Data Figure 1
Extended Data Figure 1. Spatial distribution of 4006 H3N2, 2144 H1N1, 1999 Vic and 1455 Yam samples
Circle area is proportional to the number of sequenced viruses originating from a location. Color indicates assignment to one of 9 geographic regions.
Extended Data Figure 2
Extended Data Figure 2. Inferred location of the trunk of H3N2 tree through time in the primary dataset (a) and in a smaller secondary dataset (b)
Colored width at each time point indicates the posterior support for viruses from a particular geographic location comprising the trunk of the phylogenetic tree. Colors correspond to colored circles in persistence insets in Figure 1. The secondary datasets consist of 1391 H3N2 viruses, 1372 H1N1 viruses, 1394 Vic viruses and 1240 Yam viruses.
Extended Data Figure 3
Extended Data Figure 3. Average inferred geographic history of region-specific samples for H3N2, former seasonal H1N1, Vic and Yam viruses from 2000 to 2012
In each panel, phylogeny tips belonging to a particular region were collected and their phylogeographic histories traced backwards in time averaging across the phylogenetic tree to combine all viruses within each region. The x-axis shows number of years backward in time from phylogeny tips from a particular region and the y-axis shows the geographic make up as stacked histogram of the ancestors of these tips, where region color-coding corresponds to the legend in Figure 1. For example, the top left panel shows the ancestry of USA and Canadian H3N2 viruses. At x = 0, all of these viruses are still in the USA or Canada and so an unbroken yellow band takes up the entire y. However, at x = 1 year, a number of different geographic regions appear on the y. This indicates that, 1 year back, ancestors of USA and Canadian viruses are primarily found in Southeast Asia, India and South China. The pattern in the top right panel shows that the ancestors of USA and Canadian Yam viruses more often remain in the USA or Canada with approximately 50% of ancestors remaining 1 year back. Each panel is constructed by averaging across region-specific tips within a tree, but also across sampled posterior trees.
Extended Data Figure 4
Extended Data Figure 4. Maximum clade credibility (MCC) trees for region-specific samples from USA/Canada, India and South China for H3N2, H1N1, Vic and Yam viruses
Each tree only contains viruses from a particular geographic region and thus tips are all a single color within a tree. Branch and trunk coloring have been retained from Figure 1 to highlight the inferred geographic ancestry of each lineage.
Extended Data Figure 5
Extended Data Figure 5. Antigenic map of Vic viruses primarily collected in 2008 (a), age distribution of infections for H3N2 (b), H1N1 (c) and B (d) in Australia 2000–2011, age distribution of ~102.5 million passengers at London Heathrow and London Gatwick airports during 2011 (e), timeseries of virological characterizations from 2000 to 2012 of viruses from the USA by US CDC and from Australia by VIDRL for H3N2 (f), H1N1 (g), Vic (h) and Yam (i)
In (a), the positions of strains (colored circles) and antisera (uncolored squares) are fit such that the distances between strains and antisera in the map represent the corresponding hemagglutination inhibition (HI) measurements with the least error following Smith et al. using data on Vic viruses from the WHO Collaborating Centre for Reference and Research on Influenza at the Centers for Disease Control and Prevention, Atlanta, Georgia, USA. Strains are colored by antigenic cluster. Genetic clades corresponding to each antigenic cluster are marked with colored vertical bars in Fig 1c. The spacing between grid lines is one unit of antigenic distance corresponding to a twofold dilution of antiserum in the HI assay. In (f) to (i), virological characterizations are a surrogate for epidemiological activity that allow for accurate discrimination among H3N2, H1N1, Vic, and Yam viruses. These data generally reflect the relative magnitudes and frequencies of epidemics but in some cases will inflate magnitudes of very small epidemics due to preferential characterization of subtypes circulating at low levels.
Extended Data Figure 6
Extended Data Figure 6. Combined persistence estimates across pairs of regions for H3N2, H1N1, Vic and Yam (a) and Spearman correlation of a region’s persistence vs the region’s contribution to phylogenetic ancestry for H3N2, H1N1, Vic and Yam (b)
In (a) and (b), persistence is measured as the average waiting time in years for a sample to leave its origin backwards in time in the phylogeny, with waiting time averaged across tips within a tree and across sampled posterior trees. In each panel of (a), the diagonal shows persistence within each of the 9 study regions and within the combined region of ‘China’, for which nodes in North China and in South China were considered to belong to a single region. The estimates along the diagonal are equivalent to the means shown in Figure 1. Off-diagonal elements show persistence estimates for pairwise combinations of regions. For example, the off-diagonal for North and South China is exactly equivalent to the diagonal element for ‘China’ and the off diagonal for ‘China’ and India represents mean persistence when combining nodes from North China, South China and India. In (b), origin proportion is measured as the proportion of the time that a region is represented when tracing back 2 or more years from each tip in the phylogeny, averaged across tips within a tree and across sampled posterior trees. Spearman’s ρ is not significant for any individual virus. However, the probability of observing 4 instances where each virus has a ρ of at least 0.32 is significant (P = 0.0017, bootstrap resampling test).
Extended Data Figure 7
Extended Data Figure 7. Simulation results for a model parameterized for slow antigenic drift (a), moderate antigenic drift (b), and fast antigenic drift (c)
Colors represent geographic regions with tropics in blue, north in yellow and south in red. Region-specific incidence patterns are shown in terms of cases per 100,000 individuals per week, patterns of antigenic drift in terms of increasing antigenic distance (roughly proportional to log2 HI units) over time and in the geographically labeled phylogeny. The parameterized antigenic mutation rate is 0.00015 antigenic mutations per infection per day in (a), 0.00035 in (b) and 0.00055 in (c), while the realized antigenic drift rate is 0.29 antigenic units per year in (a), 0.58 in (b) and 1.19 in (c). Between-region mixing is 5.26× faster in adults. Each panel shows output from a single simulation selected from the 112 shown in Figure 3, and is intended to show model behaviors over a range of parameters, not necessarily the behavior of particular viruses.
Extended Data Figure 8
Extended Data Figure 8. Simulation results showing relationship between antigenic drift and persistence as a function of seasonality (a) and simulation results showing the effects of modulating transmission rate β on model behavior (b)
In (a), the seasonal forcing parameter ε follows ε = 0.00 (no forcing), ε = 0.04, ε = 0.08 and ε = 0.12 (moderate seasonal forcing). Points represent outcomes from a model in which adults travel between regions at 5.26× the rate of children. Solid black lines represent linear fits to the data. With 4 seasonality scenarios, 7 mutation rates and 8 replicates, there are 224 individual simulations shown. Persistence is measured as the average time in years taken for a tip to leave its region of origin going backwards in time, up the tree. In (b), transmission rate β in contacts per day is varied and compared to its effect on observed antigenic drift (in antigenic units per year), attack rate per year, proportion of childhood infections and migration rate between regions (in events per viral lineage per year). One antigenic unit is roughly equivalent to one log2 HI unit. Black points represent outcomes from a model in which children and adults travel between regions at equal rates. Red points represent outcomes from a model in which adults travel between regions at 5.26× the rate of children. Solid black and red lines represent LOESS fits to the data. With 2 travel scenarios, 7 transmission rates and 8 replicates, there are 112 individual simulations shown.
Figure 1
Figure 1. Maximum clade credibility trees for primary datasets of 4006 H3N2 viruses (a), 2144 H1N1 viruses (b), 1999 Vic viruses (c) and 1455 Yam viruses (d)
Branch tips are colored by geographic region of virus collection; internal branches are colored by geographic region as inferred by Bayesian phylogeographic methods (region colors in persistence insets). In b) nodes 1-3 indicate co-circulating clades that diverged in 2004. In c), nodes 1 and 2 indicate divergent clades of viruses from Asia, colored vertical bars indicate antigenic variants shown in Extended Data Figure 5a (green: B/Malaysia/2506/2004-like, red: B/Hubei Songzi/52/2008-like, other post-2008 viruses: B/Brisbane/60/2008-like). The inset to the top left of each tree shows duration of region-specific persistence measured as the waiting time in years for a virus to leave its geographic region of origin. Circles represent mean persistence across sampled viruses, while lines show the inter-quartile range of persistence across sampled viruses. Region “China”, shows the combined persistence estimate for North China and South China together.
Figure 2
Figure 2. Estimates of mean pairwise virus migration rate
Line thickness between regions indicates average number of migration events per lineage per year. Arrowhead size indicates the strength of directionality of migration. For clarity, only arrows corresponding to migration rates greater than 0.25 events per lineage per year are shown. Circle area indicates the global proportion of ancestry deriving from each region.
Figure 3
Figure 3. Relationship of antigenic drift to incidence (a), proportion of childhood infections (b), and geographic migration rate (c), in a multi-strain multi-region model of influenza transmission
Black points represent outcomes from a model in which children and adults travel between regions at equal rates. Red points represent outcomes from a model in which adults travel between regions at 5.26× the rate of children (Extended Data Fig. 5e). Solid black and red lines represent LOESS fits to the data. With 2 travel scenarios, 7 mutation rates and 8 replicates, there are 112 individual stochastic simulations (Extended Data Fig. 7). Antigenic drift was measured in cartographic units per year (see Methods). In a) attack rate was measured as proportion of the total population infected yearly. In c) migration rate was measured in terms of migration events per lineage per year.

References

    1. Russell CA, et al. The global circulation of seasonal influenza A (H3N2) viruses. Science. 2008;320:340–346. - PubMed
    1. Lemey P, et al. Unifying viral genetics and human transportation data to predict the global transmission dynamics of human influenza H3N2. PLoS Pathog. 2014;10:e1003932. - PMC - PubMed
    1. Rambaut A, et al. The genomic and epidemiological dynamics of human influenza A virus. Nature. 2008;453:615–619. - PMC - PubMed
    1. Bedford T, Cobey S, Beerli P, Pascual M. Global migration dynamics underlie evolution and persistence of human influenza A (H3N2) PLoS Pathog. 2010;6:e1000918. - PMC - PubMed
    1. Chan J, Holmes A, Rabadan R. Network analysis of global influenza spread. PLoS Comput Biol. 2010;6:e1001005. - PMC - PubMed

Publication types