. 2015 Jun 18;522(7556):309-14.
doi: 10.1038/nature14445. Epub 2015 Jun 8.

Hippocampal-prefrontal input supports spatial encoding in working memory

Affiliations

Hippocampal-prefrontal input supports spatial encoding in working memory

Timothy Spellman et al. Nature. .

Abstract

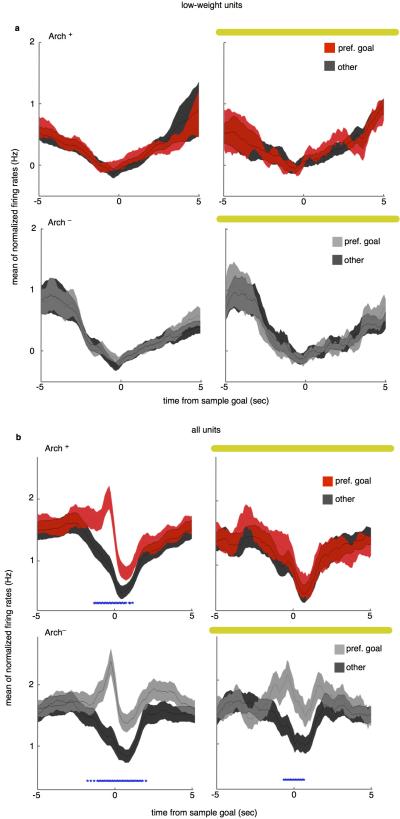
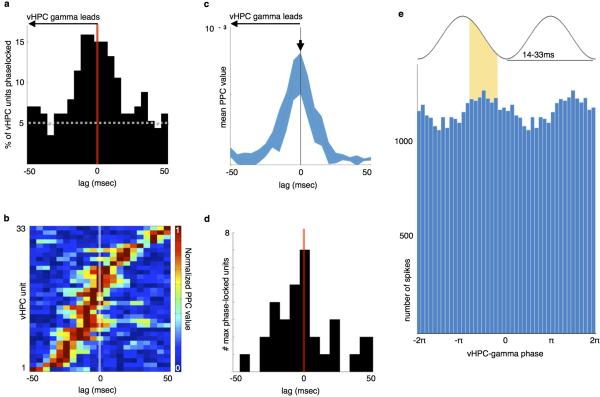
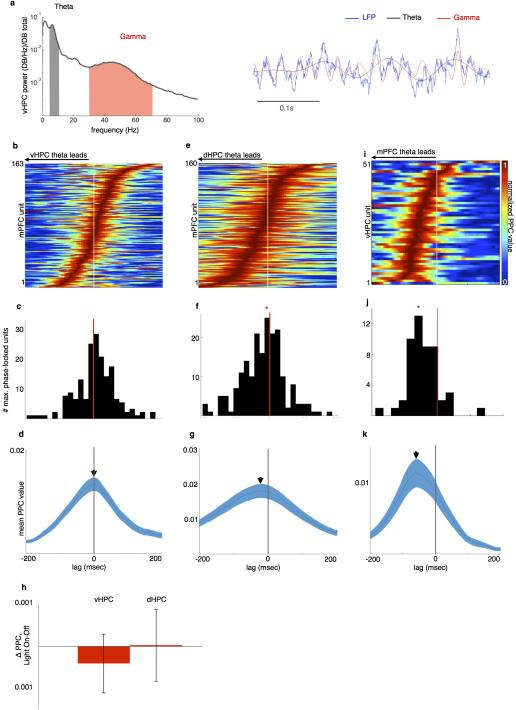
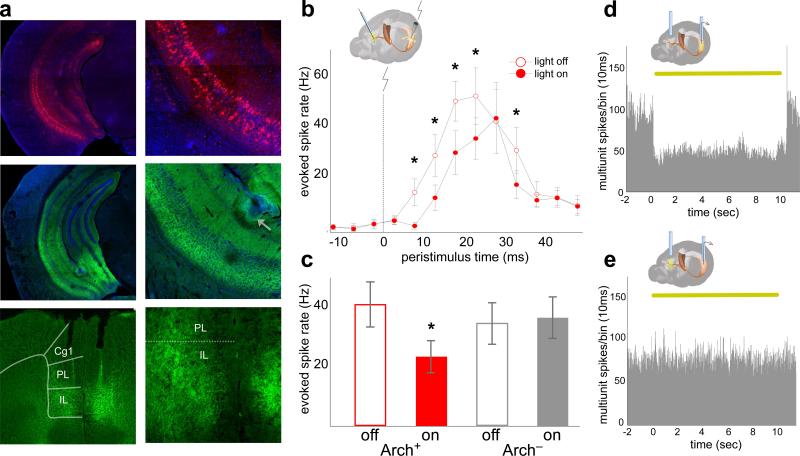
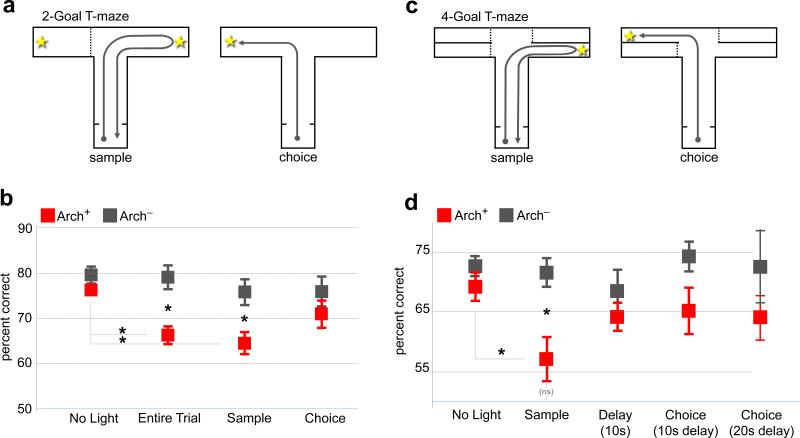
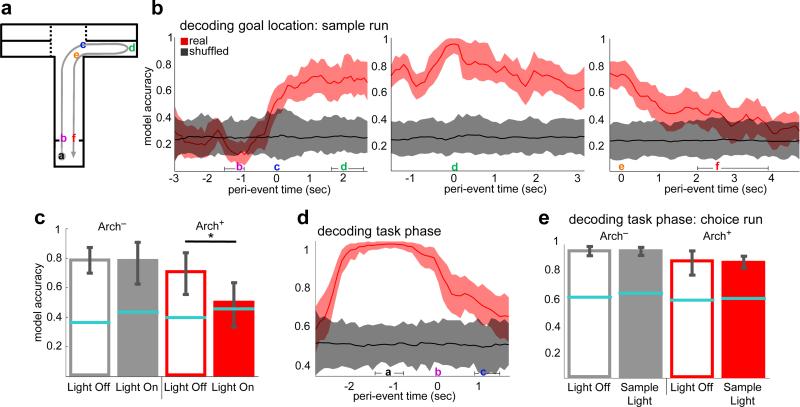
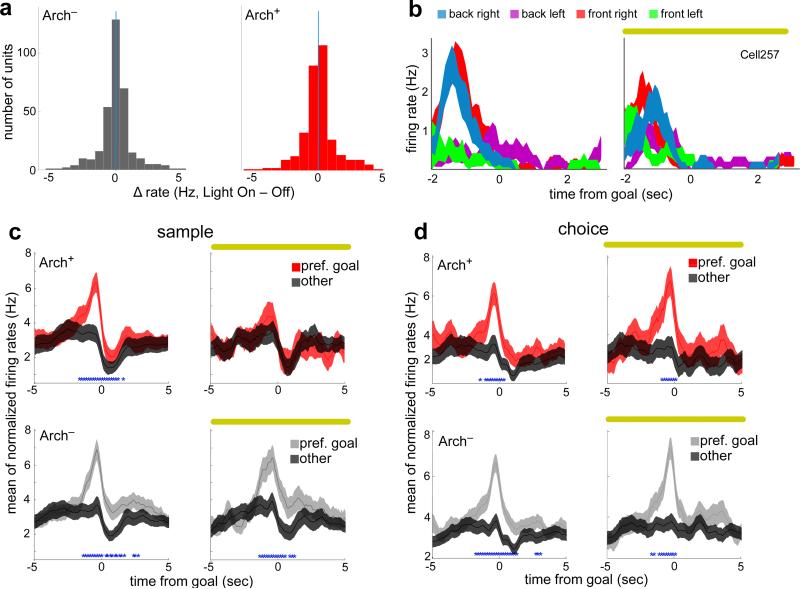
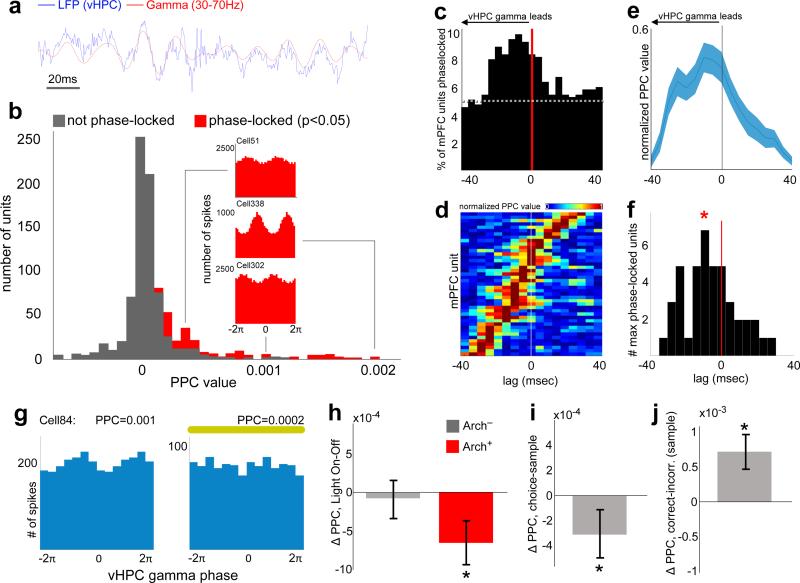
Spatial working memory, the caching of behaviourally relevant spatial cues on a timescale of seconds, is a fundamental constituent of cognition. Although the prefrontal cortex and hippocampus are known to contribute jointly to successful spatial working memory, the anatomical pathway and temporal window for the interaction of these structures critical to spatial working memory has not yet been established. Here we find that direct hippocampal-prefrontal afferents are critical for encoding, but not for maintenance or retrieval, of spatial cues in mice. These cues are represented by the activity of individual prefrontal units in a manner that is dependent on hippocampal input only during the cue-encoding phase of a spatial working memory task. Successful encoding of these cues appears to be mediated by gamma-frequency synchrony between the two structures. These findings indicate a critical role for the direct hippocampal-prefrontal afferent pathway in the continuous updating of task-related spatial information during spatial working memory.


Figures

Extended Data Figure 1
Extended Data Figure 1. Individual mPFC Units Clustered from Fiber-Coupled Stereotrodes
(a) Multiple individual units clustered from stereotrode recordings in mPFC in the absence and presence of illumination. (b) Mean waveforms of extracellular potentials from example units in (a).
Extended Data Figure 2
Extended Data Figure 2. mPFC Cells Encode Goal Location Both Categorically and Globally
(a) A raster plot of spikes fired by an example single unit across trials, sorted by sample goal, temporally aligned to arrival at sample goal. (b) Traces of firing rates averaged across trials by sample goal location, for the unit from (a). This unit shows location selectivity, firing preferentially in the back left goal. Traces are mean +/− s.e.m. (c) Spatial map of firing rates for the same unit for the full recording session. Goal-selective units tended to fire more at the preferred goal than at the other goals, and more at all goals than in the rest of the environment. (d) Percentage of units that were goal-selective as a function of time from sample goal, according to 2-way repeated measures ANOVAs performed on binned spike rates. Units were identified as having selectivity for left/right (blue), back/front (red), and/or combined spatial dimensions (green). Dashed line represents chance (p=0.05). Inset, % of units having each type and/or combination of selectivity at time zero (arrival at sample goal). Percentages are out of 792 recorded units.
Extended Data Figure 3
Extended Data Figure 3. mPFC Units Represent Choice Goal Location, Not Sample Goal Location, During Choice Runs
(a) Model accuracy at the time bin corresponding with arrival at the sample goal port during the 4-goal task was highest for spike histograms with time bins of 500ms and 1000ms. 500ms time bins were used for spike analyses. (b) Decoding sample goal location during subsequent choice run during the 4-goal task. Using the linear decoder, previously visited location was not detectable above chance accuracy. 10- and 20-second delay trials were combined. (c) Decoding choice goal during choice run, correct vs. incorrect trials during the 4-goal task. Location decoded for this analysis was chosen goal, (i.e., the mouse's current location) rather than correct goal. Model accuracy reached 0.93 upon arrival at the goal on correct trials. On incorrect trials, model accuracy exceeded chance during goal approach but dropped to chance levels upon reaching the goal. 10- and 20-second delay trials were combined. (d) Decoding choice accuracy (correct vs. incorrect) during choice trials. Model accuracy peaked at 0.99 at 1.9 seconds following arrival at the goal. Histograms aligned to departure from start box here in (b) through (d). 10- and 20-second delay trials were combined.
Extended Data Figure 4
Extended Data Figure 4. vHPC-mPFC Terminal Inhibition Does Not Alter mPFC Spike Rate
(a) Waveform features used to separate putative cell types. Spike duration was defined as the peak-to-trough time, while afterhyperpolarization (AHP) energy was taken as the area over the curve following the second zero-crossing. Spike duration yielded the clearest separation. (b) Putative FS and non-FS cells, sorted by spike width, showed no effect of terminal illumination on spike rate (Arch Non-FS: sign rank z=−1.7, p=0.095, Arch FS: z=−1.6, p=0.11; Arch+ Non-FS: z=−2.7, p=0.79; Arch+ FS: z=−0.49, p=0.62).
Extended Data Figure 5
Extended Data Figure 5. Effect of mPFC Illumination on Goal-Selective Firing in mPFC
(a) Low-weighted units, as identified using the classifier, show no difference in firing between the goal with the highest weight relative to the other goals. In the sample goal these units fire at rates not different than their session mean rates. Traces indicate mean +/−s.e.m. of normalized firing rate (bin FR – session FR). (b) Terminal inhibition eliminates firing rate differences in preferred VS non-preferred goal during encoding across all units. On sample runs with no light, units from both Arch (Lower Left) and Arch+ animals (Upper Left) had elevated firing rates in preferred goal relative to non-preferred goal (red asterisks mark time points with Bonferroni-corrected significance). In Sample Light runs, units from Arch animals maintain elevated firing in the preferred goal (Lower Right), while units from Arch+ animals show no significant firing rate difference (Upper Right; N=358 Arch units, 325 Arch+ units, Sign rank p<0.0005).
Extended Data Figure 6
Extended Data Figure 6. vHPC Gamma Modulates vHPC Output
(a) vHPC units phase-lock maximally to the vHPC-gamma rhythm at a lag of zero (p-value from Rayleigh's test<0.05, dashed line indicates chance rate). (b) Normalized PPC values, sorted by lag of maximal phase-locking, for significantly phase-locked vHPC units. Units with Bonferroni-corrected significance within the −40 to 40ms lag window (Rayleigh test, p<0.0029) were included. (c) Mean normalized PPC value for the population shown in (b). (d) Histogram of units with maximum PPC value at each lag. Units maximally phase-locked at a lag of zero, with no net difference from zero across the population. (e) vHPC units share a common preferred gamma phase. Pooled spikes from significantly phase-locked vHPC units were modulated by vHPC gamma phase at zero-lag (N=26303 spikes, Rayleigh's z=17.6, p=2.2 × 10⁻⁸, PPC value=0.002), with peak spiking in the descending phase of the gamma cycle. (**Note that spikes and LFPs were both recorded from stereotrodes in the stratum pyramidal and that this gamma phase would likely differ from that recorded in SLM, as in Figure 7).
Extended Data Figure 7
Extended Data Figure 7. mPFC Theta Activity Follows dHPC and Leads vHPC during the task
(a) Example vHPC LFP (blue, right) and spectrogram (left) demonstrating robust theta (grey, 4-12Hz) and gamma (red, 30-70Hz) components during all runs toward goals. (b) Pseudocolor plot of relative strength of mPFC unit phase-locking to vHPC theta at lags from −200ms to 200ms, for units with Bonferroni-corrected significance in at least one lag. Warmer colors indicate stronger phase-locking. (c) Distribution of lags at peak phase-locking strength for significantly phase-locked mPFC units. Distribution centered at 0 (N=189 units, z=2.05, p=0.98). (d) Mean +/− s.e.m. PPC value of mPFC units and vHPC theta, as a function of lag. (e-g) Phase-locking of mPFC units to dHPC theta as a function of lag, as in (B-D). Distribution of lags at peak phase-locking is significantly shifted towards a dHPC lead (N=160 units, Sign rank z=−4.4, p=6×10⁻⁶). (h) No difference in strength of phase-locking of mPFC units to vHPC (left) and dHPC (right) theta in light-on vs light-off trials. Mean and s.e.m. shown for each (N=140 units, Sign rank z=−1.3, p=0.2; z=−1.4, p=0.12). (i-k) Phase-locking of vHPC units to mPFC theta as a function of lag, as in (B-D). Distribution of lags at peak phase-locking is significantly shifted towards an mPFC lead (N=51 units, z=−5.03, p=2.4×10⁻⁷).
Fig. 1
Fig. 1. Optogenetic inhibition of vHPC-mPFC terminals in vivo
(a) Expression of Arch (middle row, green) and mCherry (top row, red) in ventral CA1. Arrow, lesion marking electrode location. Bottom row, Arch in terminals in the prelimbic (PL) and infralimbic (IL) mPFC. (b) mPFC multi-unit responses to vHPC stimulation in Arch+ mice (n=16 sites from 3 animals, ANOVA F=5.6, p=0.02 for light effect, *p<0.05, post-hoc t-test. Baseline rate=6.1 +/− 0.14Hz). Error bars, +/− s.e.m. (throughout, unless otherwise noted). (c) Group mean evoked mPFC spike rate summed across 5-40ms post-stimulus. (ANOVA F=31.4, p=4×10⁻⁶ for virus-light interaction; n=16 sites from 3 mice, t=6.68, p=0.0004; n=17 sites from 3 mice, t=1.57, p=0.3, for Arch+ and Arch mice, respectively). (d, e) Multiunit activity (MUA) traces from vHPC of Arch+ mice during somatic (d) and terminal field (e) illumination in vivo. Yellow bar, light on (throughout).
Fig. 2
Fig. 2. Inhibition of vHPC-mPFC terminals impairs encoding
(a) 2 Goal DNMTP task. (b) Effect of mPFC illumination on performance in the 2-Goal task differed by trial phase and virus type (ANOVA, virus-by-light interaction, F=5.92, p=0.02). Post-hoc tests revealed effects of Entire Trial (t=3.96, p=0.002) and Sample (t=2.98, p=0.011) but not Choice (t=1.1, p=0.29) illumination in Arch+ (n=8) vs. Arch (n=6) animals. Entire Trial and Sample but not Choice performance differed from the No Light condition in Arch+ (t=4.9, p=0.002, Entire Trial; t=4.5, p=0.003, Sample; t=1.7, p=0.125; Choice) but not Arch animals (t=0.18, p=0.87; t=1.1, p=0.3; t=1.3, p=0.25, respectively). (c) 4-Goal DNMTP task. (d) Effect of illumination of mPFC terminal fields on performance in the 4-Goal task (Arch+, n=7 Arch, n=6, ANOVA F=3.1, p=0.03 for virus-by-light interaction). Impairment was restricted to Sample trials (t=3.1, p=0.0093; and t=1.1, p=0.29; t=1.0, p=0.34; t=1.91, p=0.08; t=1.2, p=0.24, for No Light, Delay, Choice 10s, and Choice 20s, respectively). No Light and Sample performance were significantly reduced in Arch+ (t= 2.5, p=0.04) but not Arch mice (t=0.35, p=0.73). Performance of Arch+ mice during Sample Light runs was not significantly above chance (t=1.9, p=0.11).
Fig. 3
Fig. 3. mPFC units require vHPC input to encode location but not task phase
(a) Schematic of sample run. (b) Accuracy of goal decoding during sample run with light off. Solid lines, mean decoder accuracy; shaded areas, 95% confidence intervals. (n=727 units from 9 mice). (c) Decoding accuracy for sample goal upon arrival at the reward port (location d in (a)) in the presence (closed bars) and absence (open bars) of illumination of vHPC-mPFC terminals (269 units from 4 Arch+ mice, 285 units from 5 Arch mice; n=100 permutations; ANOVA F=1978, p=5×10-105 for virus-by-light interaction; t=0.48, p=0.64 for Arch; *t =161.2, p=1.2 × 10−121 for Arch+). Error bars represent 95% confidence intervals; blue lines represent upper bounds of 95% confidence intervals for shuffled data. (d) Decoding of task phase (sample vs. choice) as a function of time relative to departure from the start box. Conventions as in (b) (792 units from 9 mice). (e) Decoding of task phase at door opening (location a in (a)) as a function of trial type (ANOVA, F=1.94, p=0.17 for virus-by-light interaction.
Fig. 4
Fig. 4. Location selectivity requires vHPC input during encoding but not retrieval
(a) Differences in firing rate with terminal illumination (n=433 units, sign rank z=−0.23, p=0.82; n=359, z=−0.97, p=0.33, for Arch+ and Arch animals, respectively). (b) Mean binned spike rates for an example mPFC unit from an Arch+ animal, aligned to arrival at each of the 4 sample goals (color coded) without (left) or with (right) terminal illumination. (c) Peri-event firing rates during the sample phase for all location-selective units as they approach the preferred (red/grey) and non-preferred (black) goals (blue asterisks, time points with Bonferroni-corrected significance) during light on (right) and light off (left) trials. n=67 units from 7 Arch+ mice, and 78 units from 6 Arch mice. (d) Same as (c), but during the choice phase. n=145 units from 7 Arch mice, and 77 units from 6 Arch+ mice.
Fig. 5
Fig. 5. Task-dependent modulation of mPFC Spiking by vHPC gamma
(a) Example raw and gamma-filtered vHPC LFP. (b) Distribution of phase-locking values for all units from spikes recorded at all times, colored by significance (Rayleigh's test, p<0.05). Insets, vHPC gamma phase histograms from example mPFC units (Cell51: z=−3.24, p<0.001, PPC=0.0003; Cell338: z<−6, p<0.0001, PPC=0.002; Cell324: z=−2.8, p=0.002, PPC=0.001). (c) Percentage of mPFC units significantly phase-locked to vHPC gamma across a range of lags. Dashed line, chance. (d) Pseudocolor plot of normalized PPC values, sorted by lag of maximal phase-locking, for mPFC units with Bonferroni-corrected significance (p<0.0029). (e) Mean normalized PPC value by lag. (f) Distribution of lags at peak phase-locking strength; shifted towards a vHPC lead (n=43 units, Sign rank, z=−2.2, p=0.014). *, mean lag. (g) Distribution of gamma phases for spikes from an example mPFC unit from an Arch+ animal during all Light Off runs (Rayleigh's p=0.03) and Light On runs (Rayleigh's p=0.3). (h-j) Change in phase locking comparing (h) light on vs off (n=140 units from 7 Arch+ mice, z=−3.9, p=8.7×10⁻⁵; and n=222 units from 6 Arch mice, z=−1.83, p=0.07); (i) choice vs sample phases (n=458 units z=−3.2, p=0.0016); and (j) correct vs incorrect trials (n=270 units, z=−4.2, p=3.5×10⁻⁵). Significance by sign rank.

References

    1. Baddeley A, Hitch G. In: Recent advances in learning and motivation. Bower GA, editor. Vol. 8. Academic Press; 1974. pp. 47–90.
    1. Klauer K, Zhao Z. Double dissociations in visual and spatial short-term memory. Journal of Experimental Psychology: General. 2004;133:355–381. - PubMed
    1. Andrade J. Working Memory in Context. Psychology; 2001.
    1. Miyake A, Shah P. Models of Working Memory: Mechanisms of Active Maintenance and Executive Control. Cambridge University Press; 1999.
    1. Baddeley A. Working memory: looking back and looking forward. Nature Reviews Neuroscience. 2003;4:829–839. - PubMed

Publication types