. 2015 Jul 16;523(7560):342-6.
doi: 10.1038/nature14462. Epub 2015 Jun 8.

HDL-bound sphingosine-1-phosphate restrains lymphopoiesis and neuroinflammation

Affiliations

HDL-bound sphingosine-1-phosphate restrains lymphopoiesis and neuroinflammation

Victoria A Blaho et al. Nature. .

Abstract

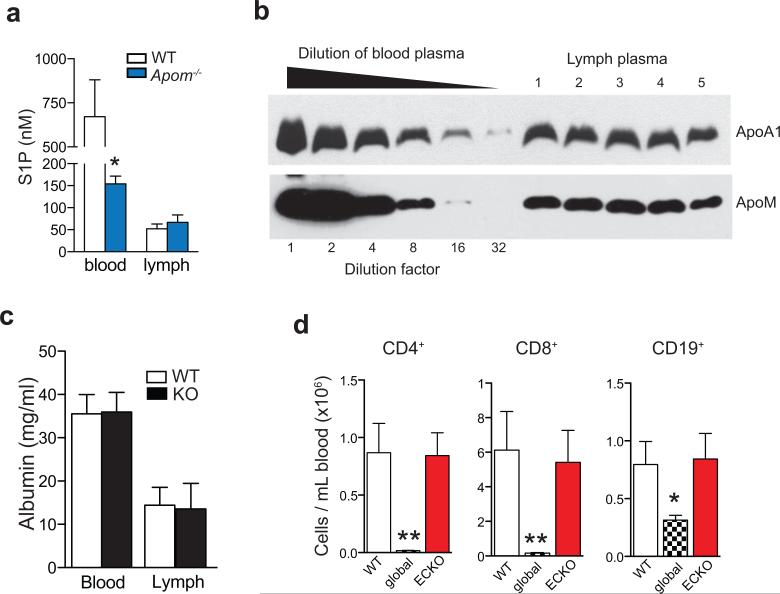
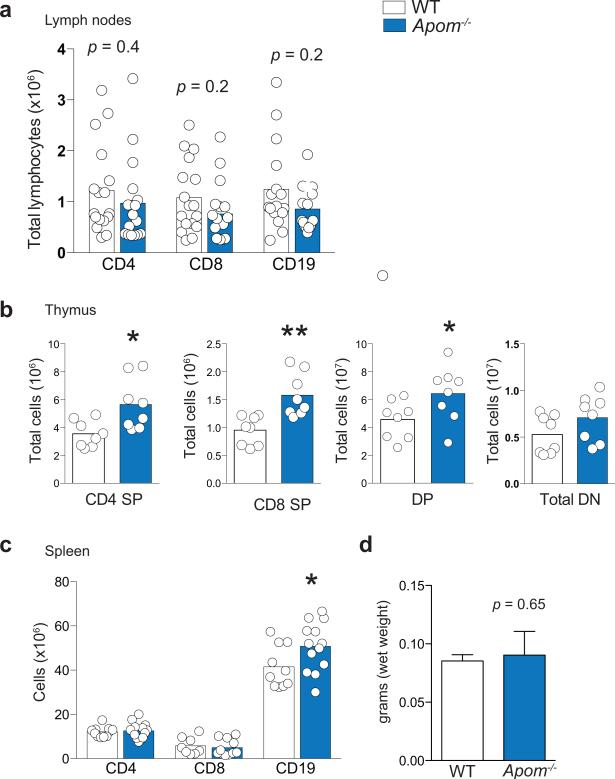
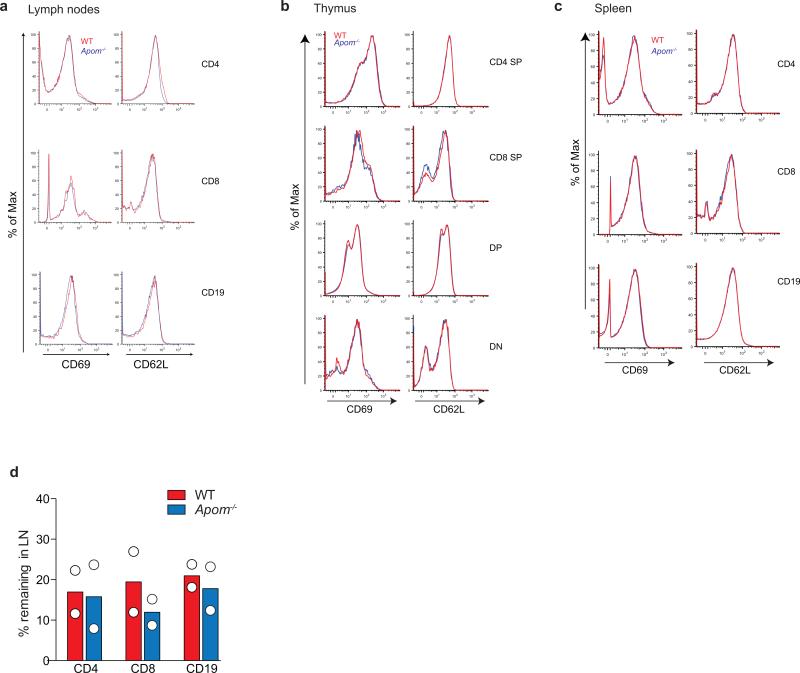
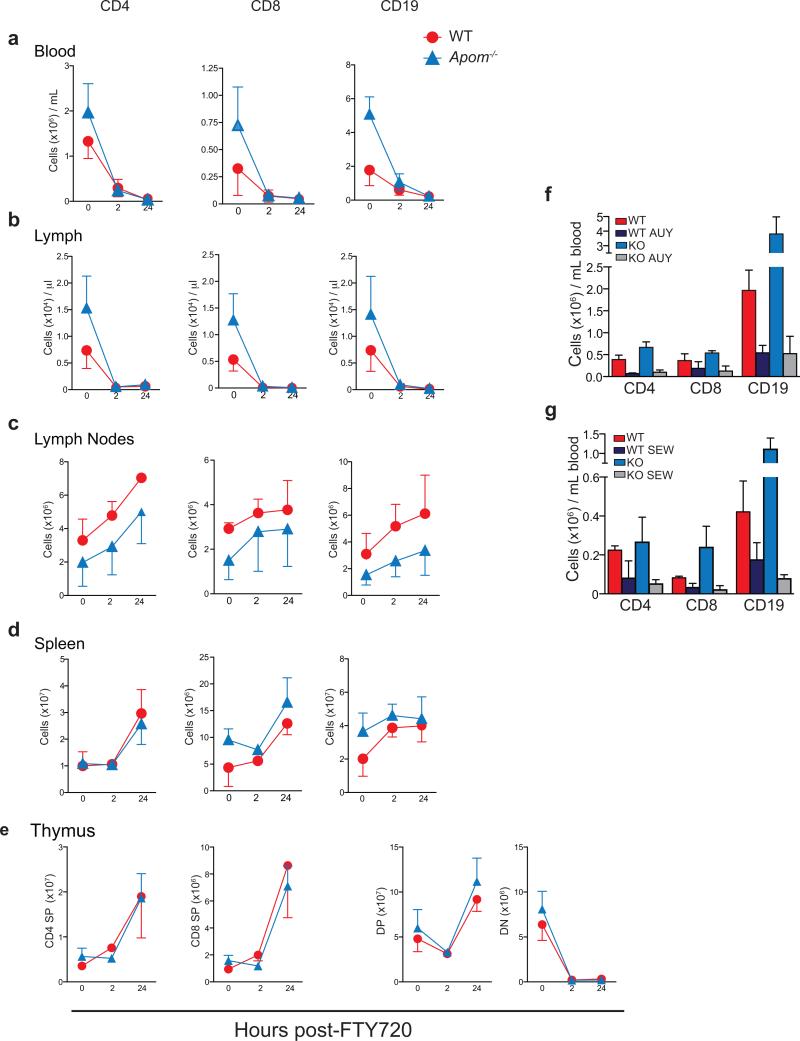
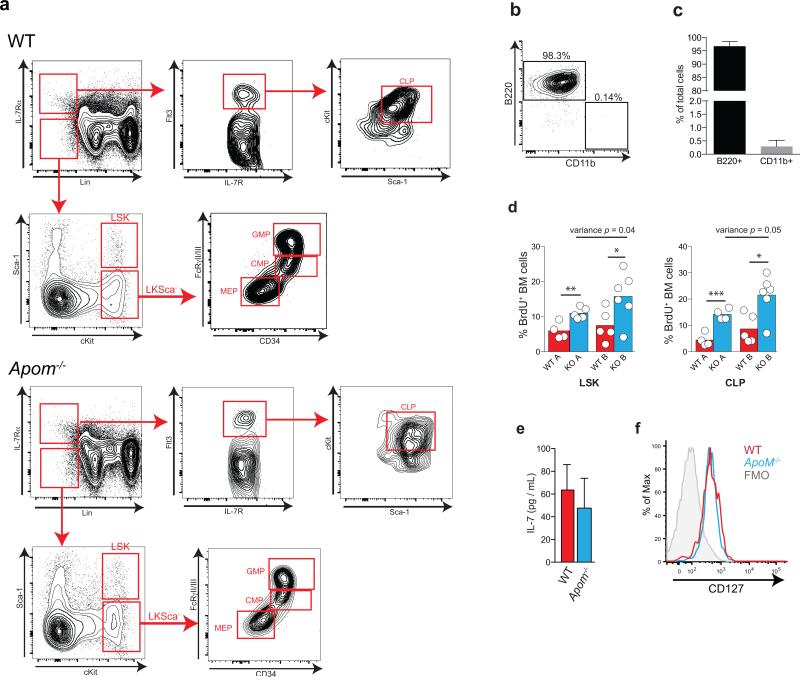
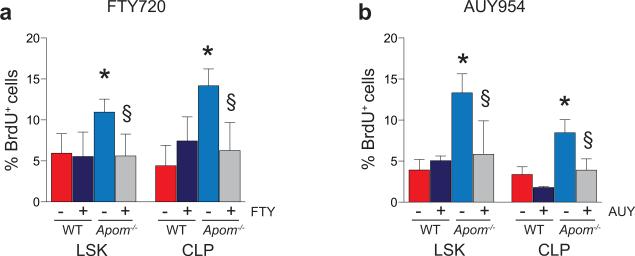
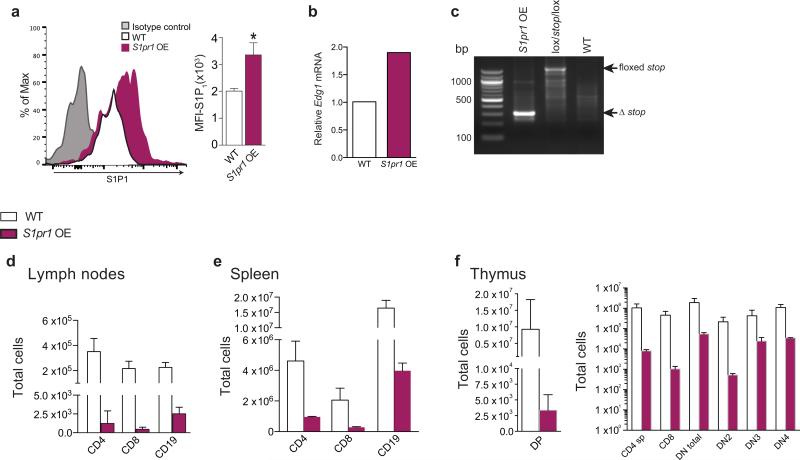
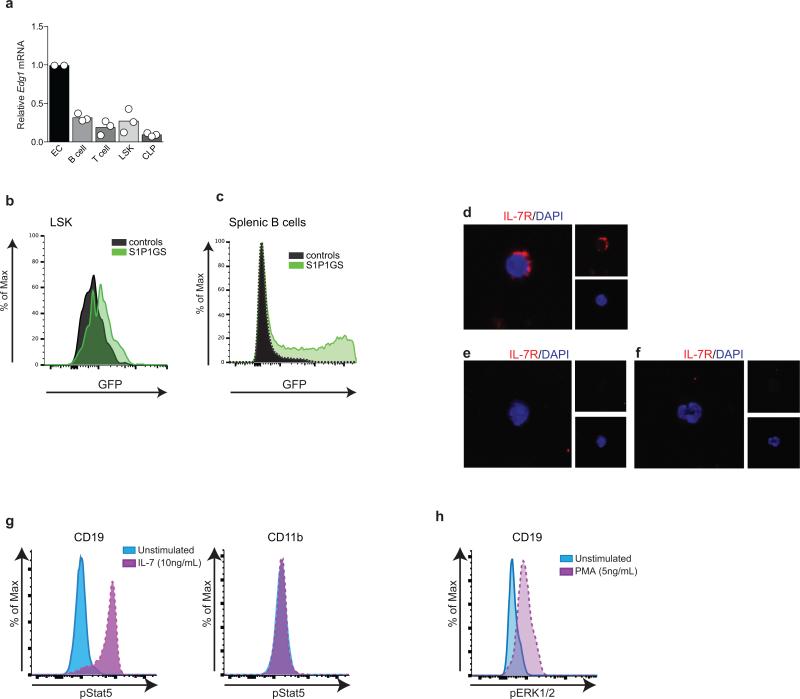
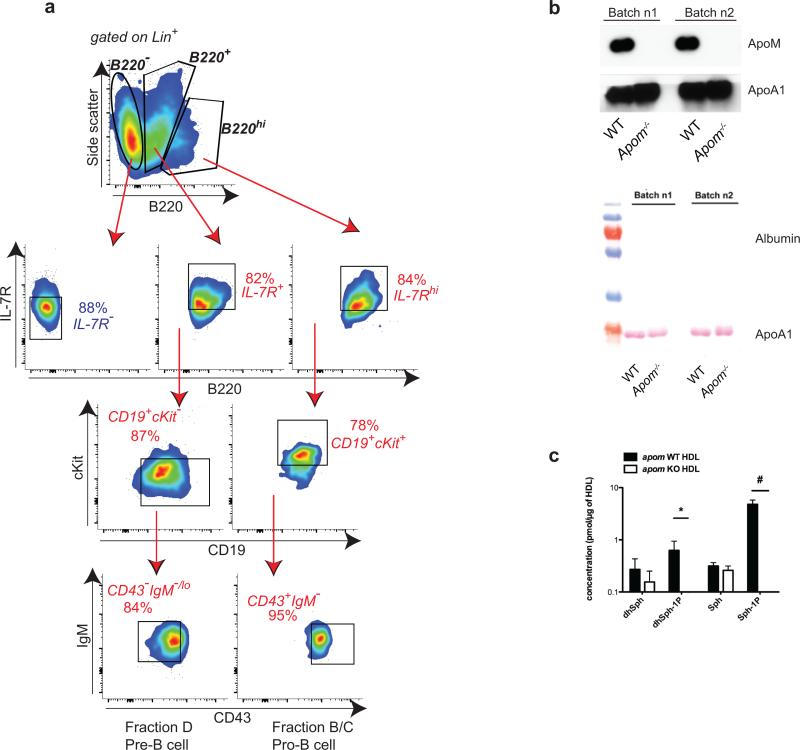
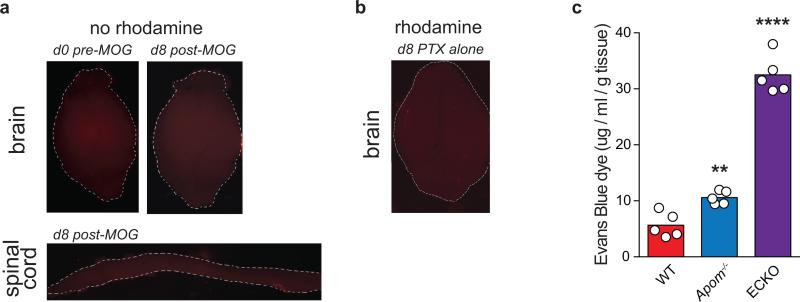
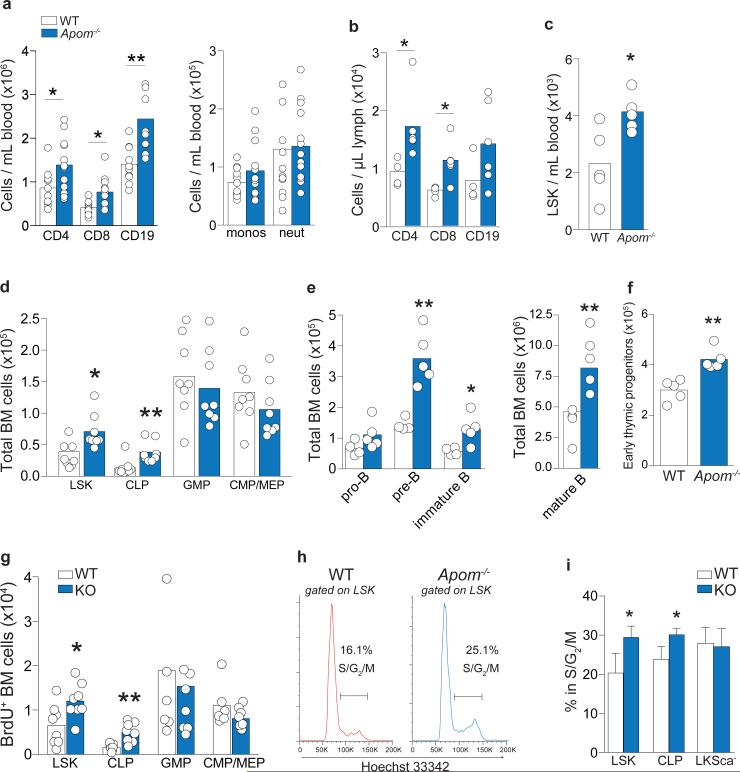
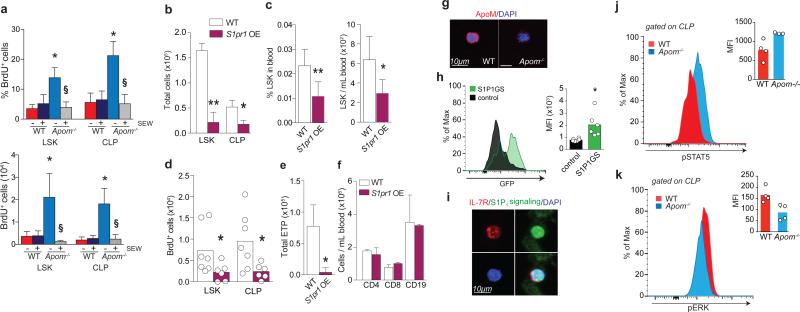
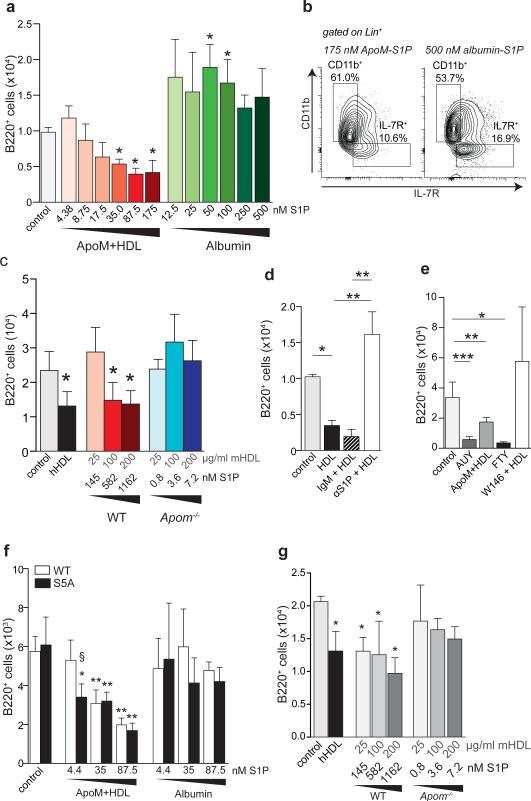
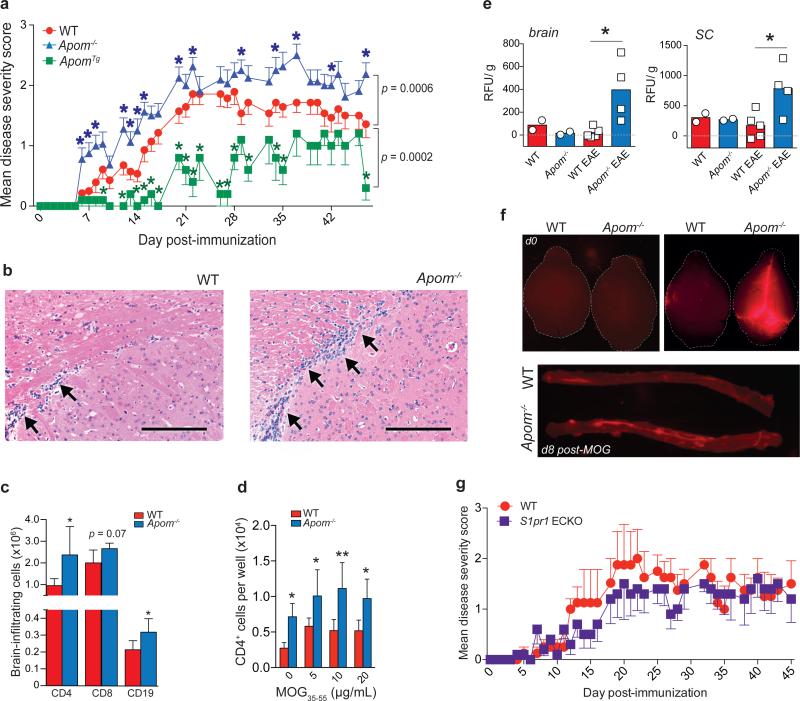
Lipid mediators influence immunity in myriad ways. For example, circulating sphingosine-1-phosphate (S1P) is a key regulator of lymphocyte egress. Although the majority of plasma S1P is bound to apolipoprotein M (ApoM) in the high-density lipoprotein (HDL) particle, the immunological functions of the ApoM-S1P complex are unknown. Here we show that ApoM-S1P is dispensable for lymphocyte trafficking yet restrains lymphopoiesis by activating the S1P1 receptor on bone marrow lymphocyte progenitors. Mice that lacked ApoM (Apom(-/-)) had increased proliferation of Lin(-) Sca-1(+) cKit(+) haematopoietic progenitor cells (LSKs) and common lymphoid progenitors (CLPs) in bone marrow. Pharmacological activation or genetic overexpression of S1P1 suppressed LSK and CLP cell proliferation in vivo. ApoM was stably associated with bone marrow CLPs, which showed active S1P1 signalling in vivo. Moreover, ApoM-bound S1P, but not albumin-bound S1P, inhibited lymphopoiesis in vitro. Upon immune stimulation, Apom(-/-) mice developed more severe experimental autoimmune encephalomyelitis, characterized by increased lymphocytes in the central nervous system and breakdown of the blood-brain barrier. Thus, the ApoM-S1P-S1P1 signalling axis restrains the lymphocyte compartment and, subsequently, adaptive immune responses. Unique biological functions imparted by specific S1P chaperones could be exploited for novel therapeutic opportunities.


Figures

Extended Data Fig 1
Extended Data Fig 1. Blood and lymph ApoM and albumin in WT and Apom−/− mice and blood cell numbers in S1pr1 global and ECKO mice
a, Concentrations of blood and lymph sphingosine 1-phosphate (S1P) were determined by LC-MS/MS. Bars represent means ± SD. n = 4 as described in Materials and Methods. b, Western blots of ApoA1 and ApoM in lymph of WT mice. 1 μl of WT blood plasma was serially diluted 1:1, and 1 μl of diluted lymph plasma from 5 animals was analyzed for ApoA1 and ApoM protein levels. c, Determination by ELISA of albumin concentrations in the blood and lymph of WT or ApoM−/− (KO) mice. Bars are mean ± SD. WT, n = 5; ApoM−/− , n = 7 d, Quantification of CD4, CD8, and CD19 cells in the blood of wild-type (WT), S1pr1f/f Rosa26-Cre-ERT2 (global) or S1pr1f/f Cdh5-Cre-ERT2 (ECKO) mice. Bars are mean ± SD. WT, n = 5; global or ECKO, n = 6. *p < 0.05; **p < 0.005, as compared to WT values.
Extended Data Fig 2
Extended Data Fig 2. Cell populations of the lymph node, thymus, and spleen are largely similar in Apom−/− and WT mice
a, Quantification of CD4, CD8, and CD19 cells in two brachial and two inguinal lymph nodes combined. Data are compiled from five experiments. b, Quantitation of CD4 single positive (SP), CD8 SP, CD4+CD8+ double positive (DP), and total CD4CD8 double negative (DN) cells in thymi of WT or Apom−/− mice. Data are compiled from three experiments. c, Quantitation of CD4, CD8, and CD19 cells in spleens of WT or Apom−/− mice. Data are compiled from three experiments. (a-c) Bars represent means and circles represent values obtained from individual mice. *p < 0.05. d, Total spleen weights (grams of wet weight) from WT or Apom−/− mice. n = 6. Bars represent means ± SD.
Extended Data Fig 3
Extended Data Fig 3. Surface expression of the maturation markers CD62L and CD69 and lymph node egress are unchanged in Apom−/− mice
Surface expression of the lymphocyte maturation markers CD62L and CD69 was determined by flow cytometry and representative histograms are shown of staining by a, lymph node cells, b, thymocytes, or c, splenocytes quantified in Supplemental Fig 3 from WT (red) and Apom−/− (blue) mice. d, Percent of CD4+, CD8+, and CD19+ cells remaining in brachial and inguinal lymph nodes 14 hours after administration of α4 and αL integrin-blocking antibodies. Symbols represent mean value acquired from three mice in independent experiments; bars represent means.
Extended Data Fig 4
Extended Data Fig 4. ApoM expression is not required for the lymphopenia response to treatment with FTY720 or the S1P1-specific agonists AUY954 and SEW 2871
WT (red) and Apom−/− (blue) mice were treated with a single dose of FTY720 (0.5 mg/kg p.o.), and samples collected at 0, 2, or 24 hours post-treatment. CD4, CD8, and CD19 cells from a, blood, b, lymph, c, lymph node, and d, spleen, and CD4 SP, CD8 SP, CD4+CD8+ DP, and CD4CD8 DN from thymus (e) were quantitated by flow cytometry. Symbols represent means ± SD and graphs are of data compiled from two experiments. 0 hours, n = 5; 2 hours, n = 6 24 hours, n = 4 f, WT and Apom−/− mice were treated with AUY954 (AUY; 1 mg/kg), g, SEW2871 (SEW; 20 mg/kg), or respective vehicle controls. 24 hours post-treatment, CD4, CD8, and CD19 cells in the blood were quantitated by flow cytometry. Bars represent means ± SD. n = 4 for all treatment groups and data are representative of two experiments.
Extended Data Fig 5
Extended Data Fig 5. Multiparameter flow cytometry gating scheme for determination of CLP and other bone marrow populations
a, Cells are first gated as Lineage (Lin) and IL-7Rα+. Cells are then gated by Flt3 (Flk2/CD135) versus IL-7Rα expression, then further gated by cKit versus Sca1 expression to define common lymphoid progenitors (CLP). Representative staining examples of WT (top) or Apom−/− (bottom) BM cells are shown. b, Representative flow cytometric plot and c, quantitation of B220+CD11b and CD11b+B220 cells generated from CLP in vitro. CLP, gated according to the gating hierarchy shown in (a), were sorted from BM of WT mice and incubated in methylcellulose medium containing growth factors to support both lymphoid and myeloid lineage development. Cells were analyzed for B220 and CD11b expression after 12d of culture. n = 6. d, Percent BrdU incorporation by LSK (left) or CLP (right) in BM of WT (red) or Apom−/− (blue) mice in two independent experiments (A and B). *p < 0.05 versus WT; **p = 0.006 versus WT; ***p = 0.0009 versus WT. Equality of variance was determined by an F test. Bars represent means and circles represent values obtained from individual mice. e, IL-7 protein in bone marrow supernatants from WT and Apom−/− mice were quantified by ELISA. n = 6 combined from two studies. Bars represent mean ± SD. f, Representative histogram of IL-7Rα (CD127) expression on the surface of WT (red) or Apom−/− (blue) CLP. The fluorescence minus one (FMO) control is represented by the grey filled histogram.
Extended Data Fig 6
Extended Data Fig 6. Treatment with the S1P1 modulator FTY720 or the S1P1- specific agonist AUY954 suppresses BrdU incorporation by LSK and CLP in Apom−/− bone marrow
Percent BrdU incorporation 24 hours post-treatment with (a) 0.5 mg/kg FTY720 or (b) 1.0 mg/kg AUY954. (a) WT, n = 4; Apom−/−, n = 5 for vehicle-treated and WT, n = 7; Apom−/−, n = 8 for FTY720-treated groups. (b) Vehicle-treated, n = 3; AUY954-treated, n = 6.. Bars represent means ± SD and data are compiled from two experiments. *p < 0.05 versus WT; §p < 0.05 versus vehicle-treated control.
Extended Data Fig 7
Extended Data Fig 7. Over-expression of S1P1 results in marked decreases in lymphocyte populations in the thymus and secondary lymphoid organs
a, Representative flow cytometry plots and quantitative MFI of S1P1 expression by Lin cells from S1pr1 OE and WT littermates. n = 3. b, Relative expression levels of S1pr1 mRNA in bone marrow cells of S1pr1 OE mice relative to WT mice, as determined by multiplex qRT-PCR. c, Representative agarose gel of Cre activation and excision of the floxedsStop cassette as assessed by PCR of genomic DNA from bone marrow cells of S1pr1 OE, lox/stop/lox littermate, or WT littermate. Arrows indicate amplified DNA fragments corresponding to undeleted or deleted segments Four days after the final dose of tamoxifen, CD4+, CD8+, and CD19+ cells in (d) brachial and inguinal lymph nodes and (e) spleen, and (f) thymic CD4+CD8+ double positive (DP), CD4 and CD8 single positive (CD4 or CD8 sp), total double negative (DN), and double negative subpopulations DN2, DN3, and DN4 were quantified by flow cytometry in S1pr1 OE mice and WT littermates. Bars represent means ± SD; S1pr1 OE, n = 6; WT, n = 7 and data are compiled from two experiments.
Extended Data Fig 8
Extended Data Fig 8. GFP expression by BM cells and splenocytes of S1P1 GFP signaling mice and stimulation of STAT5 or ERK1/2 phosphorylation in splenocytes
a, Relative expression levels of S1pr1 mRNA in LSK and CLP from bone marrow, or splenic B or T cells of WT mice relative to mouse endothelial cells, as determined by multiplex qRT-PCR. Bars represent means and circles represent values obtained from individual mice. b, Representative histograms of GFP expression by LSK from BM of S1P1 GFP signaling mice (S1P1GS; green) or control (black) mice. c, Representative histogram of GFP expression by splenic B cells (CD19) from S1P1 GFP signaling mice (green) or control (black) mice, demonstrating high in vivo GFP expression. d, Representative immunofluorescence image of IL-7Rα+ cell with CLP morphology from BM of littermate control of S1P1 GFP signaling mice. Cells were subjected to the same selection process before immunofluorescence staining. IL-7Rα, red; blue, DAPI, (e and f) Staining of BM cells from S1P1 GFP signaling mouse littermate controls demonstrates IL-7Rα staining specificity: cells with (e) CLP morphology stained with secondary alone or (f) myeloid cell morphology from BM stained with anti-IL-7Rα exhibit no IL-7Rα positivity. IL-7Rα, red; blue, DAPI. g, pSTAT5 staining after in vitro stimulation of WT splenocytes with IL-7 (10 ng/mL) for 15 minutes. CD19+ cells serve as positive controls for pSTAT5 staining. CD11b+ cells serve as negative controls, since they do not have IL-7R and therefore do not respond to IL-7 stimulation with STAT5 phosphorylation. h, pERK1/2 staining after in vitro stimulation of WT splenocytes with PMA (5 ng/mL) for 15 minutes. CD19+ cells serve as positive controls for pERK1/2 staining.
Extended Data Fig 9
Extended Data Fig 9. In vitro lymphopoiesis in the presence of ApoM+HDL generates B cells at different stages of development
a, Phenotyping of B220+ cell populations generated from WT Lin BM after eight days of culture in methylcellulose medium. Initially, cells were gated as B220, B220+, or B220hi. From populations expressing B220, pro-B cell (Hardy fractions B/C) and pre-B cell (Hardy fraction D) equivalents were identified. Pro-B cells were defined as IL-7Rhi, CD19+, cKit+, CD43+, and IgM. Pre-B cells were defined as IL-7R+, CD19+, cKit, CD43, and IgM−/lo. b, Western blot analysis of two batches of mouse HDL (Batches n1 and n2) isolated from WT or Apom−/− mice showing the absence of contaminating albumin. c, Liquid chromatography tandem mass spectrometric (LC-MS/MS) analysis of HDL isolated from pooled plasmas of WT or Apom−/− mice. *p <0.05, #p < 0.005. n = 3. dhSph, dihydrosphingosine; dhSph-1P, dihydro-sphingosine 1-phosphate; Sph, Sphingosine; Sph-1P, Sphingosine 1-phosphate.
Extended Data Fig 10
a, Representative photographs of auto-fluorescence in whole brains or spinal cord in WT mice at d0 or d8 post-MOG35-55 immunization. No rhodamine denotes tissues from animals that were not injected with TMR-dextran. b, Representative photograph of whole brain 16h after TMR-injection of a mouse injected with pertussis toxin (PTX) alone, without accompanying MOG35-55 immunization. c, Pulmonary vascular permeability as determined by Evans Blue dye extravasation in wild-type (WT), Apom−/−, and S1P1 EC-specific knockout (ECKO) mice . Bars represent means and circles represent values from individual animals. **p < 0.005, ****p < 0.0001, as compared to WT controls.
Figure 1
Figure 1. Increased lymphocytes and their progenitors in Apom−/− mice
a, CD4 and CD8 T cells, CD19 B cells, monocytes, and neutrophils in blood or b, lymph from WT (white) and Apom−/− (blue) mice. c, LSK cells in blood of WT and Apom−/− mice. d Stem and progenitor cell populations in bone marrow (BM) of WT and Apom−/−. e, Pro-pre, immature, and mature B cell populations in BM of WT and Apom−/− mice. f, Early thymic progenitors (ETP) in thymi of WT and Apom−/− mice. g, h, Proliferation of progenitors in BM of WT and Apom−/− mice determined by BrdU incorporation. (a-g) Circles indicate values from individual mice and bars represent means. Data are compiled from two (b, c, e, f) or four (a, d, g) independent experiments. h, Representative histograms of Hoechst 33342-stained LSK bone marrow cells from WT and Apom−/− mice demonstrating entry into cell cycle. Numbers above bars represent percentage of cells in S/G2/M phase. i, Quantification of cycling LSK, CLP, and LKSca subsets in WT and Apom−/− mice. Bars represent means ± SD. n = 4. Graphs are representative of at least two experiments. *p < 0.05, **p < 0.005 as compared to WT.
Figure 2
Figure 2. ApoM/ S1P/ S1P1 signaling suppresses LSK and CLP expansion
a, % BrdU incorporation (left panel) and total BrdU+ (right panel) LSK and CLP in WT and Apom−/− BM 24 hours post-treatment with SEW 2871. n = 6. *p < 0.05 versus WT; §p < 0.05 versus vehicle-treated control. b, LSK and CLP in BM and c, percentage and total number of LSK in blood of S1pr1 OE mice and WT littermates. S1pr1 OE, n = 6; WT, n = 7. d, BrdU incorporation by BM LSK and CLP of WT and S1pr1 OE mice. e, ETP, or f, blood CD4+, CD8+, and CD19+ cells from WT and S1pr1 OE mice. S1pr1 OE, n = 6; WT, n = 7. g, Immunofluorescence of ApoM (red) bound to the surface of Lin Sca1+ (LSK and CLP) cells from WT or Apom−/− BM. DAPI nuclear counter stain, blue. h, Representative histogram and quantitative median fluorescence intensity (MFI) of GFP expression by CLP from BM of S1P1 GFP signaling (green) or control (black) mice. i, Immunofluorescence of IL-7R (red) expression of GFP (green) by CLP. DAPI nuclear counter stain, blue. j. Representative flow cytometry histograms of p-Stat5 and k, p-ERK1/2 in WT (red) and Apom−/− (blue) CLPs. MFI of p-Stat5 and p-ERK1/2 in CLP of 3-4 WT or Apom−/− mice are shown in inset. (d, h-k) Bars represent means and circles represent values from individual animals. (b, c, e, f) Bars represent means ± SD. *p < 0.05; **p < 0.005 versus WT or control. (a-c, e, f, h, j) Data are combined from two experiments. (d) Data are combined from three experiments. (g and i), Data are representative of at least four experiments.
Figure 3
Figure 3. ApoM-S1P activation of S1P1 suppresses lymphocyte progenitor generation in vitro
a, B220+ cells generated from WT Lin BM after incubation with increasing concentrations of ApoM+HDL S1P or albumin-S1P. b, Representative flow cytometry plots of IL-7Rα+ versus CD11b+ cells generated in the presence of 175 nM ApoM-S1P or 500 nM albumin-S1P. c, B220+ cell numbers generated after culture in the presence of human HDL (hHDL; 100 μg/ml), or increasing concentrations of mouse ApoM+HDL (WT) or ApoMHDL (Apom−/−). d, B220+ cells generated after incubation with ApoM+HDL (50 μg/mL), ApoM+HDL + IgM, or ApoM+HDL + αS1P. e, B220+ cells generated in the presence of vehicle, AUY954 (10 nM), FTY720p (10 nM), 100 μg/ml ApoM+HDL, or W146 (100 nM) + 100 μg/ml HDL. f, B220+ cells generated from WT or S1P1S5A (S5A) Lin BM cells after incubation in the presence of increasing concentrations of ApoM+HDL-S1P or albumin-S1P. g, Number of B220+ cells generated from S5A Lin BM incubated with increasing concentrations of ApoM+HDL (WT) or ApoM-HDL (Apom−/−). (a-c) n = 5; (d, e) n = 6 and data are compiled from two independent experiments. (f & g) WT, n = 5; S5A, n = 3 and data are representative of two experiments. *p < 0.05; **p <0.005; ***p < 0.001 versus control or vehicle values. Bars represent mean ± SD.
Figure 4
Figure 4. ApoM expression affects EAE disease onset and severity
a, Mean clinical EAE scores of WT, Apom−/−, or ApomTg mice. Symbols represent means ± s.e.m. WT, n = 14; Apom−/−, n = 16; ApomTg, n = 5. Data from WT and Apom−/− mice are representative of three independent experiments. *p ≤ 0.05 compared to WT value as determined by Mann-Whitney U-test. b, Representative photomicrographs of hematoxylin and eosin staining of brains from WT or Apom−/− mice at d16 post-MOG35-55 immunization. Scale bar, 100μm. c, Numbers of brain-infiltrating CD4, CD8, and CD19 cells from CNS of WT and Apom−/− EAE mice at day 24 post-immunization. d, Number of CD4 T cells from splenocytes of MOG35-55-immunized WT or Apom−/− EAE mice following ex vivo restimulation with increasing concentrations of MOG35-55 peptide. (c & d) Bars represent means ± SD. *p < 0.05, **p < 0.01 compared to WT. Experiments were performed at least twice with cells from n = 5 / arm. e, Quantification of TMR-dextran fluorescence in brain and spinal cord after 16h of circulation in WT or Apom−/− mice at d0 or d8 post-MOG35-55 immunization. Bars represent means and symbols represent values from individual mice. Data are combined from two experiments. f, Representative photographs of whole brains or spinal cords quantified in (e). g, Mean clinical EAE scores of S1pr1 ECKO and WT littermates. Symbols represent means ± s.e.m. n = 5 per arm and data are representative of two experiments performed.

References

    1. Cyster JG, Schwab SR. Sphingosine-1-phosphate and lymphocyte egress from lymphoid organs. Annu. Rev. Immunol. 2012;30:69–94. - PubMed
    1. Schwab SR, et al. Lymphocyte sequestration through S1P lyase inhibition and disruption of S1P gradients. Science. 2005;309:1735–1739. - PubMed
    1. Christoffersen C, et al. Endothelium-protective sphingosine-1-phosphate provided by HDL-associated apolipoprotein M. Proc. Natl. Acad. Sci. U.S.A. 2011;108 - PMC - PubMed
    1. Kono M, et al. Sphingosine-1-phosphate receptor 1 reporter mice reveal receptor activation sites in vivo. J. Clin. Invest. 2014;124:2076–2086. - PMC - PubMed
    1. Furlan R, Cuomo C, Martino G. Animal models of multiple sclerosis. Methods Mo.l Biol. 2009;549:157–173. - PubMed

Publication types

MeSH terms