. 2015 Jul;17(7):868-79.
doi: 10.1038/ncb3179. Epub 2015 Jun 8.

The kinetochore encodes a mechanical switch to disrupt spindle assembly checkpoint signalling

Affiliations

The kinetochore encodes a mechanical switch to disrupt spindle assembly checkpoint signalling

Pavithra Aravamudhan et al. Nat Cell Biol. 2015 Jul.

Abstract

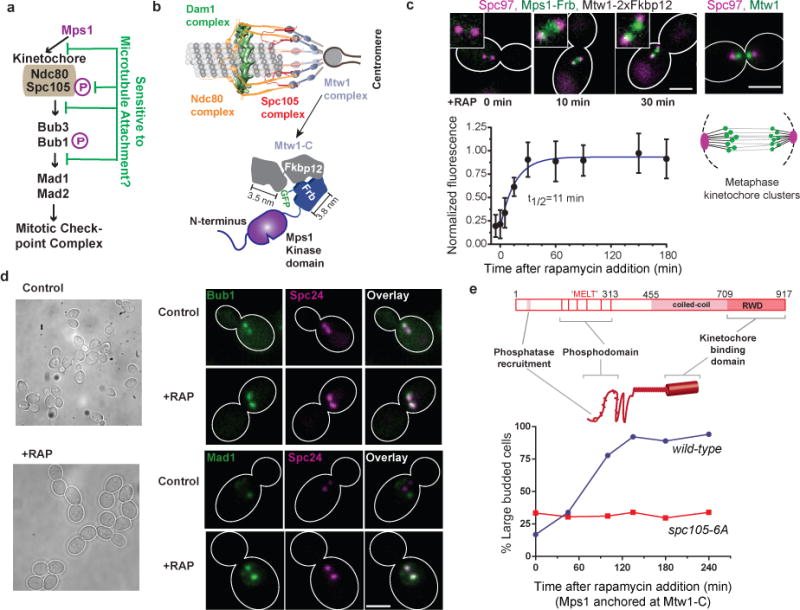
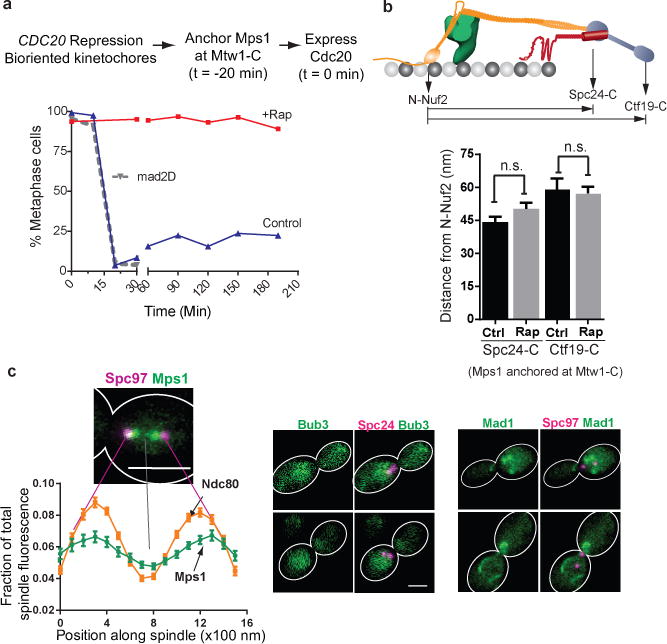
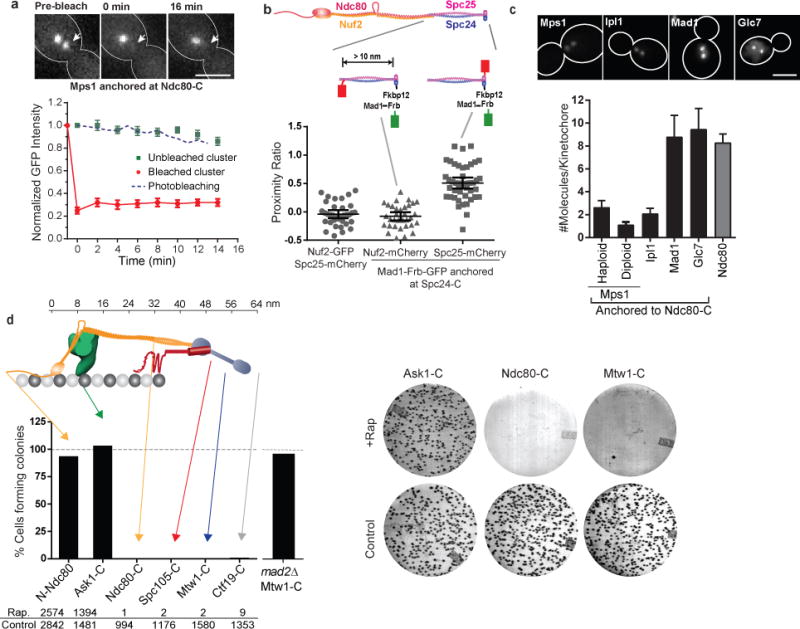
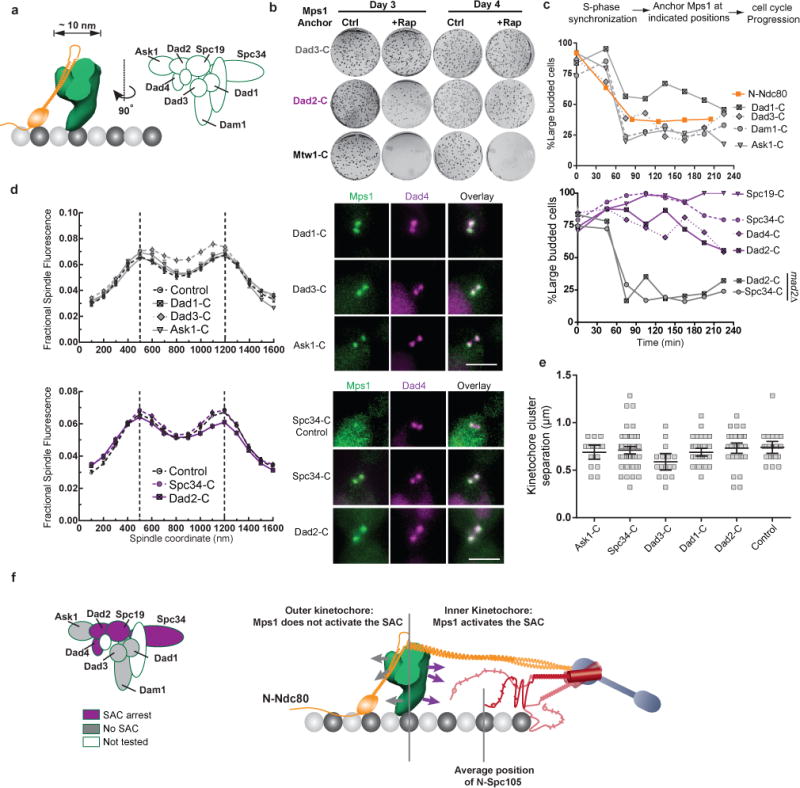
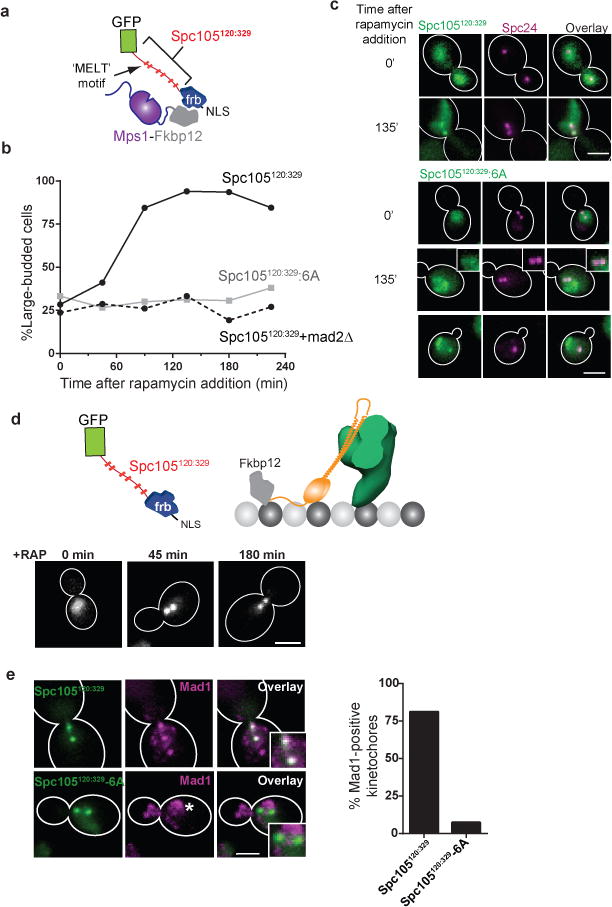
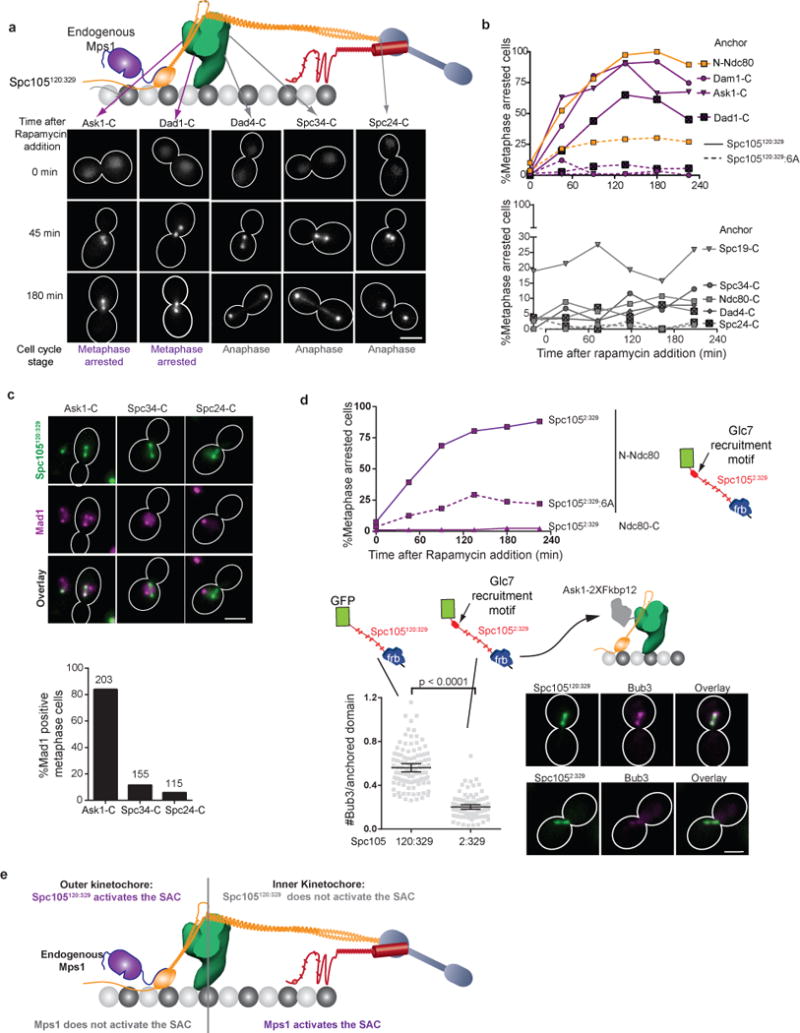
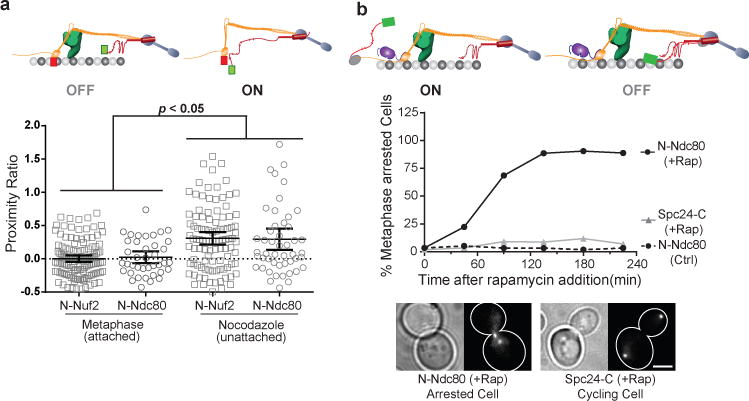
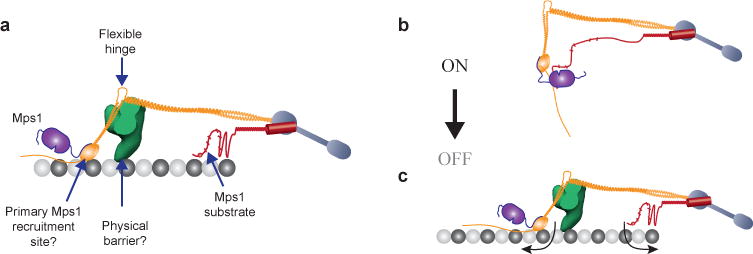
The spindle assembly checkpoint (SAC) is a unique signalling mechanism that responds to the state of attachment of the kinetochore to spindle microtubules. SAC signalling is activated by unattached kinetochores, and it is silenced after these kinetochores form end-on microtubule attachments. Although the biochemical cascade of SAC signalling is well understood, how kinetochore-microtubule attachment disrupts it remained unknown. Here we show that, in budding yeast, end-on microtubule attachment to the kinetochore physically separates the Mps1 kinase, which probably binds to the calponin homology domain of Ndc80, from the kinetochore substrate of Mps1, Spc105 (KNL1 orthologue). This attachment-mediated separation disrupts the phosphorylation of Spc105, and enables SAC silencing. Additionally, the Dam1 complex may act as a barrier that shields Spc105 from Mps1. Together these data suggest that the protein architecture of the kinetochore encodes a mechanical switch. End-on microtubule attachment to the kinetochore turns this switch off to silence the SAC.


Figures

Figure 1
Figure 1. Cell cycle effects of anchoring Mps1 to the kinetochore using rapamycin-induced dimerization
(a) The steps in the kinetochore-based signaling cascade of the SAC (magenta Ps indicate Mps1-mediated phosphorylation) that may be disrupted by microtubule attachment. (b) Top: Protein architecture of the metaphase kinetochore-microtubule attachment. Bottom: Schematic of the rapamycin-induced dimerization technique used to anchor Mps1 to the carboxyl terminus of Mtw1 (Mtw1-C). (c) Top: Micrographs show the anchoring of Mps1-Frb-GFP at Mtw1-C (time after rapamycin addition indicated; scale bar ~ 3 μm). The stereotypical distribution of kinetochores in metaphase visualized with Mtw1-GFP, spindle poles visualized using Spc97-mCherry is shown in the right. Cartoon underneath depicts the metaphase spindle morphology. Bottom: kinetics of rapamycin-induced anchoring of Mps1-Frb-GFP to Mtw1-C. Error bars represent mean ± s.d. of n = 10, 11, 8, 13, 14, 18, 24, 16 and 11 kinetochore clusters analyzed from −5 to 108 min. (d) Left: Representative transmitted-light images before and 1 hour after the addition of rapamycin to anchor Mps1 at Mtw1-C. Right: Localization of Bub1-GFP and Mad1-GFP, and kinetochores (visualized by Spc24-mCherry) in untreated cells (control) and in cells that have Mps1 anchored at Mtw1-C (+RAP). Scale bar ~ 3 μm. (e) Top: Domain organization of Spc105. The end-to-end length of the unstructured domain of Spc105 (amino acids 1–455) is predicted to be 11.7 ± 5 nm (mean ± s.d. using the worm-like chain model). The maximum length of it α-helical region (a. a. 455–709) is 38 nm (3.6 amino acids per turn/0.54 nm pitch). The predicted kinetochore-binding domain (RWD*) is ~ 6 nm long. Other than these estimated dimensions, the structure and organization of Spc105 is unknown. Therefore, the depiction is not drawn to scale. The six Mps1 phosphorylation sites (consensus sequence ‘MELT’) are depicted as bars. Bottom: Cell cycle progression of asynchronous cells with the indicated genotypes observed upon anchoring Mps1 at Mtw1-C. Accumulation of large budded cells indicates mitotic arrest. Plotted points represent the average values calculated from 2 independent experiments. More than 50 cells were scored for each time point. The source data are shown in Supplementary Table 3.
Figure 2
Figure 2. Testing the sensitivity of SAC signaling steps to the attachment status of the kinetochore
(a) Cell cycle progression of three different strains following release from metaphase arrest (methodology indicated at the top, see Methods for details). Solid lines indicate cell cycle progress of a strain expressing Mtw1-2xFkbp12 and Mps1-Frb released into media with (red) or without (blue) rapamycin. The dotted gray line indicates cell cycle progression of a mad2∆ strain similarly released from metaphase arrest. Plotted points represent the average values calculated from 2 independent experiments. The source data are shown in Supplementary Table 3. (b) Separation between the centroids of fluorescently labeled kinetochore proteins along the spindle axis obtained by high-resolution colocalization in unperturbed metaphase cells (ctrl.) and rapamycin treated cells (rap. – rapamycin added to anchor Mps1 at Mtw1-C; mean ± s.e.m.; n = 61, 49, 19, 42 cells were analyzed (from left to right). Data were pooled from 2 independent experiments. n. s. – not significant, p-value > 0.05 using Mann-Whitney test). (c) Left: Fractional intensity distributions of Mps1-Frb-GFP (that autonomously localizes along the spindle in the absence of rapamycin) and Ndc80-GFP along the spindle in cells arrested in metaphase using CDC20 repression (spindle pole bodies visualized using Spc97-mCherry). Error bars represent s.e.m. from n = 38 and 57 cells for Mps1 and Ndc80, respectively. The experiment was repeated twice and graph presents mean data pooled from 2 independent experiments. Right: Bub3 and Mad1 do not localize to kinetochores under the same conditions. Mad1 puncta correspond to its known localization to the nuclear envelope. Scale bar ~ 3 μm.
Figure 3
Figure 3. The ability of Mps1 to activate the SAC depends on its position in the kinetochore
(a) Fluorescence recovery after photobleaching of Mps1-frb-GFP anchored at Ndc80-C (red circles), and loss of anchored protein from the unbleached cluster (green squares). Blue dashed line displays the expected rate of photobleaching as a result of imaging determined in cells expressing Ndc80-GFP (mean ± s.e.m. from n = 8 and 11 clusters for bleached and unbleached clusters, respectively; data pooled from 2 independent experiments). Scale bar ~ 3 μm. (b) Top: Structure of Ndc80 complex and the positions of fluorescent tags used for FRET. Scatter plot: Proximity ratio, which is directly proportional to the FRET efficiency, for FRET between Spc25-mCherry or Nuf2-mCherry and Mad1-Frb-GFP anchored to Spc24-C (mean ± 95% confidence interval from n = 35, 33 and 44 kinetochore clusters analyzed, from left to right. The experiment was repeated twice and graph presents mean data pooled from 2 independent experiments). Proximity ratio is defined as the acceptor fluorescence resulting from FRET normalized by the sum of direct excitation of mCherry on exciting GFP and GFP emission bleed-through into the mCherry imaging channel. FRET between the anchored donor, Mad1-Frb-GFP, and the acceptor, Spc25-mCherry, was readily detected, but it was absent when the mCherry was fused to Nuf2-C. Spc25-C is < 3 nm away from Spc24-C, where the donor is anchored, whereas Nuf2-C is > 10 nm away. We used Mad1, rather than Mps1, in this experiment to ensure that the number of donors is equal to the number of acceptor molecules (either Spc25-mCherry or Nuf2-mCherry, see (c) below) for accurate FRET quantification. (c) Number of protein molecules anchored at Ndc80-C, measured 30 min after rapamycin addition (mean ± s.d. from n = 25, 33, 29, 20, 41, and 30 kinetochore clusters from left to right. The experiment was performed once). Scale bar ~ 3 μm. (d) Top: The organization of yeast kinetochore proteins along the microtubule axis, . The N-terminal half of Spc105 is not drawn to scale. Bottom: Bar graph shows the number of colonies formed on rapamycin-containing plates relative to control plates. The experiment was repeated at least twice and the cumulative number of colonies scored is displayed below the graph. Right: Representative photographs of plates for three strains.
Figure 4
Figure 4. The Dam1 complex defines a boundary for SAC signaling by anchored Mps1
(a) Cartoon: Position of the Dam1 complex relative to Ndc80 complex and subunit organization within the Dam1 complex. EMD1372 was used to infer the dimensions of the Dam1 complex. (b) Colony growth (also see Supplementary Fig. 4a) on control (ctrl.) and rapamycin (+Rap) plates. The number of days after plating is indicated at the top; the anchoring subunit is indicated on the left. (c) Cell cycle progression when Mps1 is anchored to a Dam1 subunit (indicated on the left) in cells released from an experimentally imposed S-phase arrest. This strategy was used to ensure that the kinetochores formed end-on attachments and loaded Dam1 complex before Mps1 was anchored . Plotted points represent the average values calculated from 2 independent experiments. The source data are shown in Supplementary Table 3. (d) Normalized distribution of Dad4-mcherry on the spindle when Mps1 was anchored to the indicated positions for 1 hour (mean ± s.e.m. n = 43, 34, 28, 36, 73 and 38 cells for Dad1, Dad3, Ask1, Ctrl, Spc34 and Dad2, respectively). Control data is from untreated metaphase cells. Micrographs on the right display the localization of Dad4-mCherry relative to that of Mps1-frb-gfp anchored to the indicated subunits (scale bar ~ 3 μm). (e) The separation between kinetochore clusters in the cells in (d), measured as the separation between maximum intensity pixels in the two Dad4-mCherry puncta in each cell; mean ± 95% confidence interval, n = 43, 16, 16, 25, 72 and 38 cells for Dad1, Dad3, Ask1, Ctrl, Spc34 and Dad2, respectively. Although there is a small decrease in spindle length when Mps1 is anchored at Dad3-C, cell cycle progression is unaffected as seen in (c). (f) Left: Classification of Dam1 complex subunits inferred from the Mps1 anchoring experiments. Right: Activity map of the anchored Mps1 along the length of the kinetochore-microtubule attachment. Arrows from the Dam1 complex depict the proposed orientation of the C-termini of subunits used as anchors. Possible variations in the conformation of the unstructured phosphodomain of Spc105 are also depicted.
Figure 5
Figure 5. The phosphorylation of the Spc105 phosphodomain by Mps1 is sufficient to activate the SAC
(a) Schematic of Spc105120:329: the minimal Spc105 phosphodomain. NLS – Nuclear Localization Signal used to send Spc105120:329 to the nucleus. (b) Cell cycle kinetics following rapamycin addition to anchor the phosphorylatable (solid black line) or non-phosphorylatable Spc105120:329 (solid gray line) to Mps1-C. Dashed black line shows the cell cycle progression of the mad2Δ strain after anchoring Spc105120:329 to Mps1. Plotted points represent the average values calculated from 2 independent experiments. More than 50 cells scored for each time point in each trial. The source data are shown in Supplementary Table 3. (c) Localization of Spc105120:329 or Spc105120:329:6A when anchored to Mps1. Scale bar ~ 3 μm. (d) Strategy to anchor Spc105120:329 at N-Ndc80, and the localization of Spc105120:329 at indicated times after rapamycin addition. Scale bar ~ 3 μm. (e) Recruitment of Mad1 to the kinetochore clusters when Spc105120:329 (top) or Spc105120:329:6A (bottom) is anchored at N-Ndc80. Bars represent mean data pooled from 2 independent experiments. At least 45 cells were analyzed for each sample in each trial. The source data are shown in Supplementary Table 3. Asterisk – known Mad1 localization at the nuclear envelope. Scale bar ~ 3 μm.
Figure 6
Figure 6. Spc105120:329 activates the SAC only when it is anchored in the outer kinetochore
(a) Representative micrographs of asynchronously dividing cells showing the localization of Spc105120:329 and cell-cycle progression as a function of the anchoring position (indicated at the top; scale bar ~ 3 μm). Large-budded cells with < 2 μm separation between kinetochore clusters were characterized as metaphase-arrested cells. (b) Accumulation of metaphase-arrested cells after rapamycin addition, when either Spc105120:329 (solid lines) or its non-phosphorylatable version, Spc105120:329:6A (dashed lines) was anchored at the indicated positions. The experiment was performed once, and more than 70 cells were scored for each time point (source data are shown in Supplementary Table 3). (c) Mad1-mCherry localization after anchoring Spc105120:329 at indicated positions for 1 hour (scale bar ~ 3 μm). The bar graph shows the fraction of metaphase cells that recruit Mad1 to the kinetochores in each case. Bars present average values from 2 independent experiments. Total number of cells analyzed in each case is indicated on top of the bars. (d) Top: Cell cycle progression as in Fig. 6a when a modified version of Spc105 phosphodomain that includes the Glc7 recruitment motif (Spc1052:329, solid lines) or its non-phosphorylatable version (Spc1052:329:6A, dashed line) was anchored at the indicated kinetochore positions. The experiment was performed once. More than 50 cells were scored for each time point and the source data are shown in Supplementary Table 3. Bottom: Micrographs (scale bar ~ 3 μm) and quantification of kinetochore-localized Bub3-mCherry 45 minutes after either Spc105120:329 or Spc1052:329 was anchored at Ask1-C in cells arrested in metaphase using CDC20 repression (mean ± 95% confidence interval from n = 102 and 100 kinetochore clusters analyzed for Spc105120:329 and Spc1052:329 anchoring, respectively). p-values computed using Mann-Whitney test. (e) Map of the SAC activity of the anchored Spc105120:329.
Figure 7
Figure 7. The proximity between the CH-domains of Ndc80 and the phosphodomain of Spc105 within the kinetochore controls SAC signaling
(a) Scatter plot: Proximity ratio measurements for FRET between mCherry-Nuf2 or mCherry-Ndc80 and GFP-Spc105 in attached (metaphase) and unattached (nocodazole-treated) kinetochores. It should be noted N-Ndc80 is connected to the CH-domain via a 113 amino acid long unstructured tail. Data pooled from 3 independent experiments, horizontal bars represent mean ± 95% confidence interval computed from n = 121, 37, 101 and 49 clusters (left to right). p-values were computed using Mann-Whitney test. (b) Cell cycle kinetics after anchoring Spc105120:329 at indicated positions in strains expressing spc105-6A. Plotted points represent average values calculated from 2 independent trials. More than 70 cells scored in each trial and the source data are shown in Supplementary Table 3. Scale bar ~ 3 μm.
Figure 8
Figure 8. The mechanical switch model for attachment-sensitive SAC signaling
(a) Key features of the metaphase architecture of the yeast kinetochore-microtubule attachment (when SAC signaling is off), and their potential roles in executing attachment-dependent SAC signaling. Please note that the schematic displays a possible organization of Spc105 phosphodomain; the actual organization remains unknown. The microtubule-binding activity of this domain is not highlighted. (b–c) The protein architecture of the kinetochore encodes a mechanical switch that controls SAC signaling. The CH-domain of Ndc80 and the phosphodomain of Spc105 act as the two terminals of this switch. It is in the ‘on’ state in unattached kinetochores, because the inherent flexibilities in the Ndc80 complex and Spc105 position the two terminals in close proximity. This allows Mps1 to phosphorylate Spc105 and initiate SAC signaling. Microtubule attachment toggles this switch to its ‘off’ state by physically separating the two terminals (arrows). Mps1 can no longer phosphorylate Spc105. The Dam1 complex, which is recruited to the kinetochore only after end-on microtubule attachment is established, may create a barrier that further hinders the interaction between Mps1 and Spc105. This leads to SAC silencing.

References

    1. Sacristan C, Kops GJ. Joined at the hip: kinetochores, microtubules, and spindle assembly checkpoint signaling. Trends Cell Biol. 2014 - PubMed
    1. Foley EA, Kapoor TM. Microtubule attachment and spindle assembly checkpoint signalling at the kinetochore. Nat Rev Mol Cell Biol. 2013;14:25–37. - PMC - PubMed
    1. Funabiki H, Wynne DJ. Making an effective switch at the kinetochore by phosphorylation and dephosphorylation. Chromosoma. 2013;122:135–158. - PMC - PubMed
    1. McIntosh JR. Structural and mechanical control of mitotic progression. Cold Spring Harb Symp Quant Biol. 1991;56:613–619. - PubMed
    1. Maresca TJ, Salmon ED. Intrakinetochore stretch is associated with changes in kinetochore phosphorylation and spindle assembly checkpoint activity. J Cell Biol. 2009;184:373–381. - PMC - PubMed

Publication types

MeSH terms