. 2015 Jun 4;16(6):12713-36.
doi: 10.3390/ijms160612713.

The Stable Level of Glutamine synthetase 2 Plays an Important Role in Rice Growth and in Carbon-Nitrogen Metabolic Balance

Affiliations

The Stable Level of Glutamine synthetase 2 Plays an Important Role in Rice Growth and in Carbon-Nitrogen Metabolic Balance

Aili Bao et al. Int J Mol Sci. .

Abstract

Glutamine synthetase 2 (GS2) is a key enzyme involved in the ammonium metabolism in plant leaves. In our previous study, we obtained GS2-cosuppressed plants, which displayed a normal growth phenotype at the seedling stage, while at the tillering stage they showed a chlorosis phenotype. In this study, to investigate the chlorosis mechanism, we systematically analyzed the plant growth, carbon-nitrogen metabolism and gene expressions between the GS2-cosuppressed rice and wild-type plants. The results revealed that the GS2-cosuppressed plants exhibited a poor plant growth phenotype and a poor nitrogen transport ability, which led to nitrogen accumulation and a decline in the carbon/nitrogen ratio in the stems. Interestingly, there was a higher concentration of soluble proteins and a lower concentration of carbohydrates in the GS2-cosuppressed plants at the seedling stage, while a contrasting result was displayed at the tillering stage. The analysis of the metabolic profile showed a significant increase of sugars and organic acids. Additionally, gene expression patterns were different in root and leaf of GS2-cosuppressed plants between the seedling and tillering stage. These results indicated the important role of a stable level of GS2 transcription during normal rice development and the importance of the carbon-nitrogen metabolic balance in rice growth.

Keywords: GS2; carbon-nitrogen; chlorosis; gene expression; metabolic profile; rice.


Figures
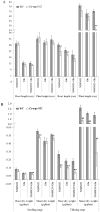
Figure 1
Figure 1
The root length and plant height (A), root dry weight and shoot dry weight (B) in the GS2-cosuppressed plants (Co-sup-GS2) and wild-type plants (WT) at the seedling stage and the tillering stage under N (NH4NO3), G (Gln) and N + G (NH4NO3 + Gln) conditions. Values are the mean ± SD of ten randomly-selected plants. *, ** Significant differences at the level of p = 0.05 and p = 0.01, respectively.
Figure 2
Figure 2
The 15N (15N%) and total nitrogen content (TN%) in the roots, stems and uppermost leaves of the GS2-cosuppressed plants (Co-sup-GS2) and wild-type plants (WT) at 1 h, 3 h, 8 h, 1 day and 3 days after NH4NO3 in the nutrient solution was replaced with 15NH415NO3 during the tillering stage. The values are the means from three biological replicated plant materials.
Figure 3
Figure 3
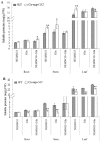
The concentration of soluble proteins in the roots, stems and uppermost leaves of GS2-cosuppressed plants (Co-sup-GS2) and wild-type plants (WT) at the seedling stage (A) and the tillering stage (B) under N (NH4NO3), G (Gln) and N + G (NH4NO3 + Gln) conditions. Values are the mean ± SD from three biological replicated plant materials. *, ** Significant differences at the level of p = 0.05 and p = 0.01, respectively.
Figure 4
Figure 4
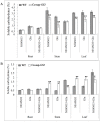
The concentration of soluble carbohydrates in the roots, stems and uppermost leaves of GS2-cosuppressed plants (Co-sup-GS2) and wild-type plants (WT) at the seedling stage (A) and the tillering stage (B) under N (NH4NO3), G (Gln) and N + G (NH4NO3 + Gln) conditions. Values are the mean ± SD from three biological replicated plant materials. *, ** Significant differences at the level of p = 0.05 and p = 0.01, respectively.
Figure 5
Figure 5
The fold change corresponds to the ratio of the concentration of individual metabolites involved in carbon and nitrogen metabolism in the GS2-cosuppressed plants relative to the wild-type plants for the uppermost leaves and roots at the tillering stage under N condition. Red dots indicate increased metabolites, and blue triangles indicate decreased metabolites. Glc, glucose; Suc, sucrose; Fru, fructose; F6P, frutose-6-P; G6P, glucose-6-P; G1P, glucose-1-P; Gal, galactose; Ino, inositol; AA, ascorbic acid; Ara, arabinose; Xyl, xylitol; 3PG, 3-P-glycerate; PEP, phosphoenolpyruvate; Pyr, pyruvate; Ace-CoA, acetyl-CoA; Cit, citrate; Aco, aconitase; KG, ketoglutarate; Succ, succinate; Fum, fumarate; Mal, malate; Oxa, oxaloacetate; Glu, glutamate; Gln, glutamine; Arg, arginine; Pro, proline; Orn, ornithine; GABA, aminobutyric; Asp, aspartate; Asn, asparagine; Ile, isoleucine; Met, methionine; Thr, threonine; Ala, alanine; Val, valine; Leu, leucine; Phe, phenylalanine; Try, tryptophan; Ser, serine; Gly, glycine; Cys, cysteine.
Figure 6
Figure 6
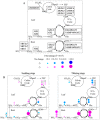
The fold change corresponds to the ratio of the gene expression level in the GS2-cosuppressed plants relative to the wild-type plants. (A) Diagrammatic representation of the key genes involved in the carbon and nitrogen metabolic pathway in rice plants. NRT, nitrate transporter; NR, nitrate reductase; GS, glutamine synthetase; GOGAT, glutamate synthase; RUBISCO, ribulose-1,5-bisphosphate carboxylase/oxygenase; PEPC, phosphoenolpyruvate carboxylase. Prominent changes in the gene expression level in the GS2-cosuppressed plants compared to wild-type plants at the seedling stage and tillering stage under N (B), G (C) and N + G (D) conditions. Red and blue dots indicate up- and down-regulated genes, respectively.
Figure 6
Figure 6
The fold change corresponds to the ratio of the gene expression level in the GS2-cosuppressed plants relative to the wild-type plants. (A) Diagrammatic representation of the key genes involved in the carbon and nitrogen metabolic pathway in rice plants. NRT, nitrate transporter; NR, nitrate reductase; GS, glutamine synthetase; GOGAT, glutamate synthase; RUBISCO, ribulose-1,5-bisphosphate carboxylase/oxygenase; PEPC, phosphoenolpyruvate carboxylase. Prominent changes in the gene expression level in the GS2-cosuppressed plants compared to wild-type plants at the seedling stage and tillering stage under N (B), G (C) and N + G (D) conditions. Red and blue dots indicate up- and down-regulated genes, respectively.
Figure 7
Figure 7
Summary of the differences between the seedling stage and the tillering stage in the GS2 transgenic plant. The symbols ↑ and indicate induction and repression, respectively.

References

    1. Lam H.M., Coschigano K.T., Oliveira I.C., Melo-Oliveira R., Coruzzi G.M. The molecular-genetics of nitrogen assimilation into amino acids in higher plants. Annu. Rev. Plant Physiol. Plant Mol. Biol. 1996;47:569–593. doi: 10.1146/annurev.arplant.47.1.569. - DOI - PubMed
    1. Tabuchi M., Abiko T., Yamaya T. Assimilation of ammonium ions and reutilization of nitrogen in rice (Oryza sativa L.) J. Exp. Bot. 2007;58:2319–2327. doi: 10.1093/jxb/erm016. - DOI - PubMed
    1. Frink C.R., Waggoner P.E., Ausubel J.H. Nitrogen fertilizer: Retrospect and prospect. Proc. Natl. Acad. Sci. USA. 1999;96:1175–1180. doi: 10.1073/pnas.96.4.1175. - DOI - PMC - PubMed
    1. Crawford N.M., Forde B.G. Molecular and developmental biology of inorganic nitrogen nutrition. In: Meyerowitz E., Somerville C., editors. The Arabidopsis Book. American Society of Plant Biologists; Rockville, MD, USA: 2002. - PMC - PubMed
    1. Zheng Z. Carbon and nitrogen nutrient balance signaling in plants. Plant Signal. Behav. 2009;4:584–591. doi: 10.4161/psb.4.7.8540. - DOI - PMC - PubMed

Publication types

MeSH terms

LinkOut - more resources