

Application of Enhanced Sampling Monte Carlo Methods for High-Resolution Protein-Protein Docking in Rosetta
- PMID: 26053419
- PMCID: PMC4459952
- DOI: 10.1371/journal.pone.0125941
Application of Enhanced Sampling Monte Carlo Methods for High-Resolution Protein-Protein Docking in Rosetta
Abstract
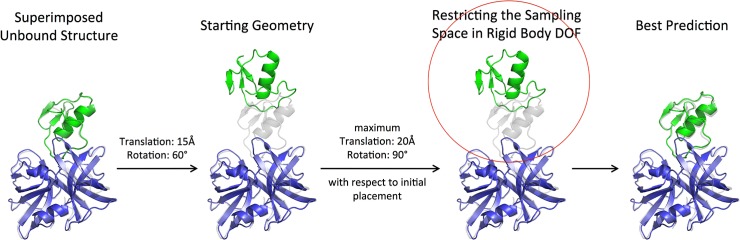
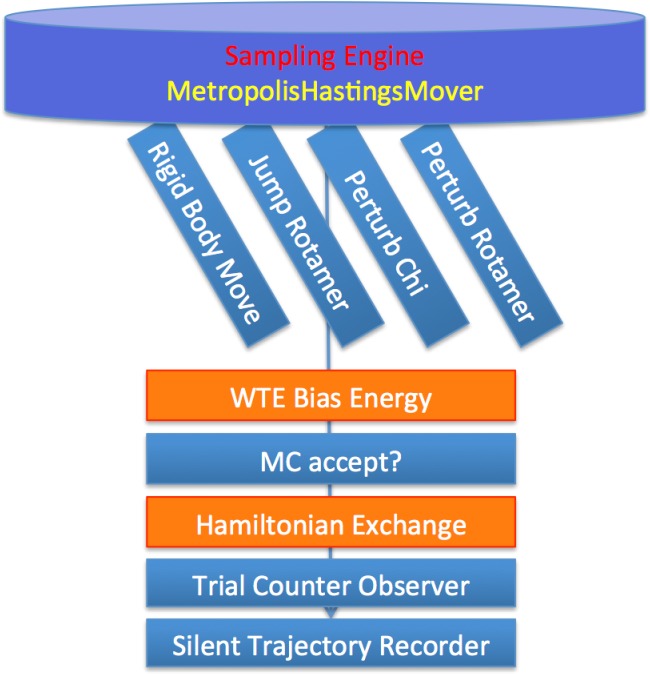
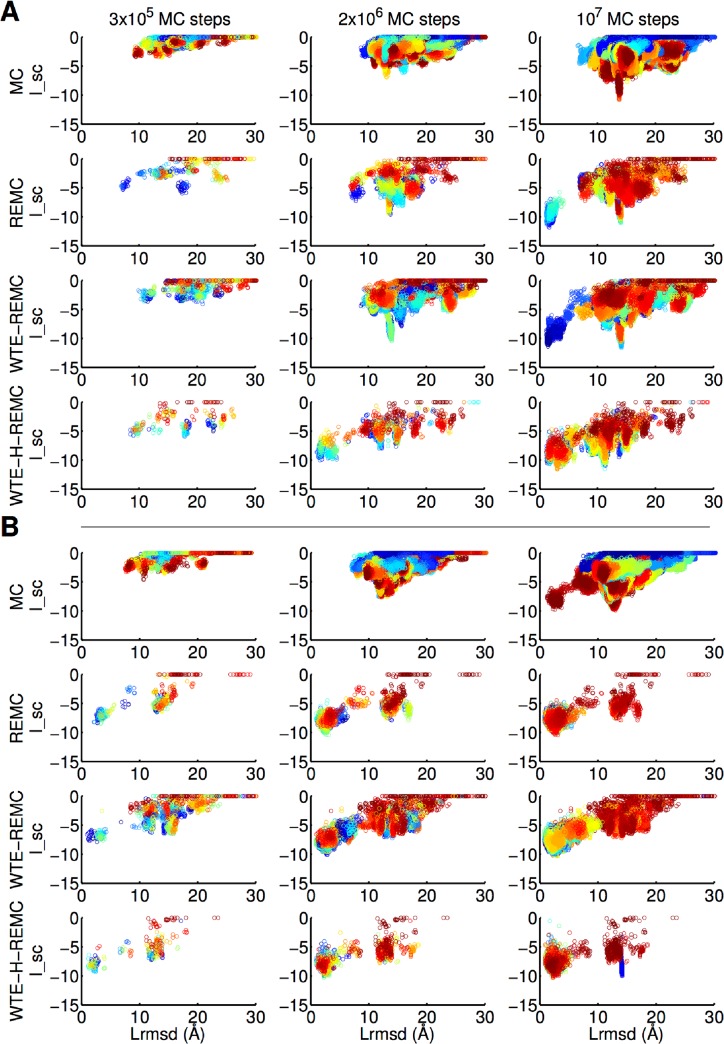
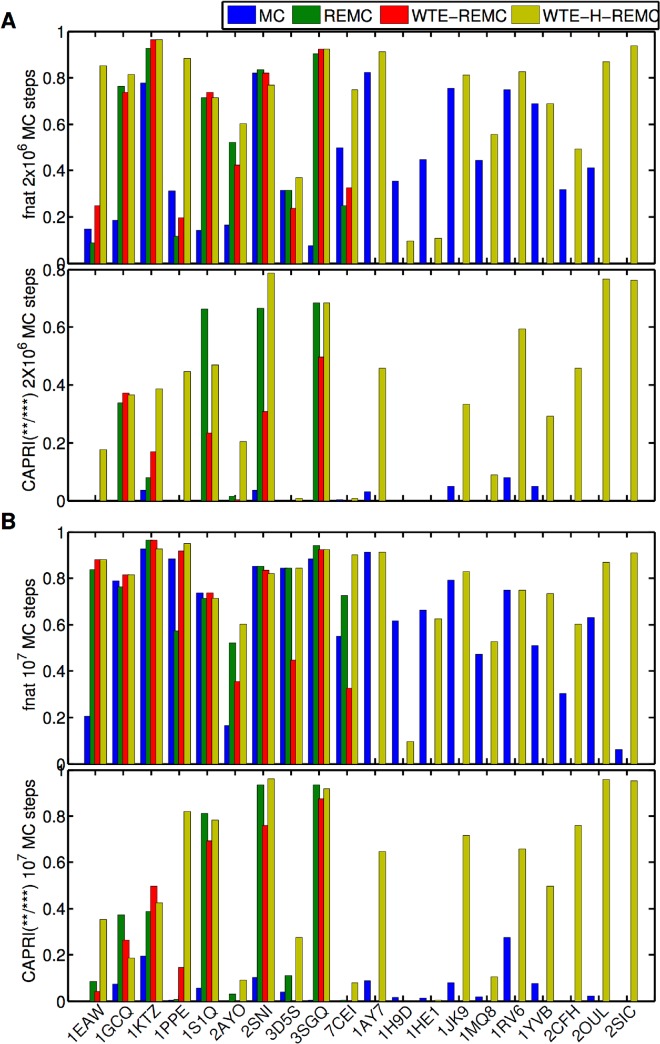
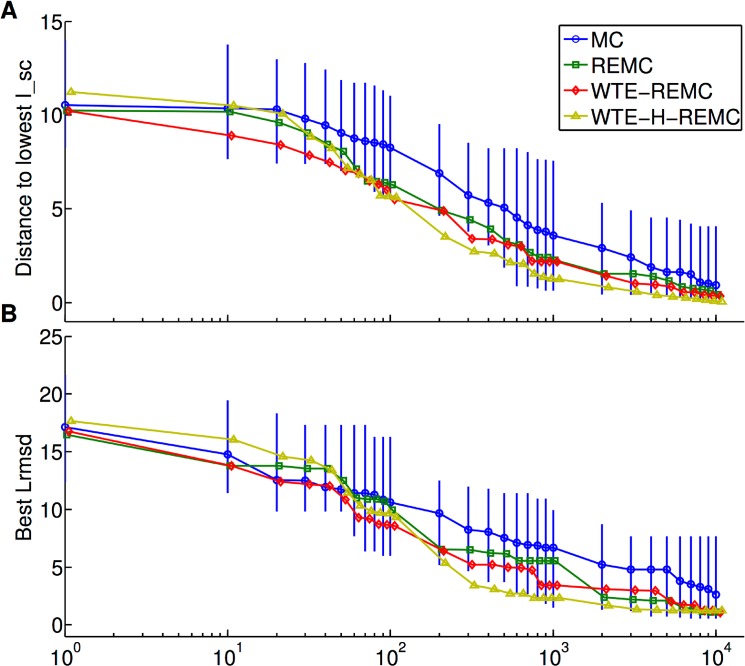
The high-resolution refinement of docked protein-protein complexes can provide valuable structural and mechanistic insight into protein complex formation complementing experiment. Monte Carlo (MC) based approaches are frequently applied to sample putative interaction geometries of proteins including also possible conformational changes of the binding partners. In order to explore efficiency improvements of the MC sampling, several enhanced sampling techniques, including temperature or Hamiltonian replica exchange and well-tempered ensemble approaches, have been combined with the MC method and were evaluated on 20 protein complexes using unbound partner structures. The well-tempered ensemble method combined with a 2-dimensional temperature and Hamiltonian replica exchange scheme (WTE-H-REMC) was identified as the most efficient search strategy. Comparison with prolonged MC searches indicates that the WTE-H-REMC approach requires approximately 5 times fewer MC steps to identify near native docking geometries compared to conventional MC searches.
Conflict of interest statement
Figures
Similar articles
-
Using the multi-objective optimization replica exchange Monte Carlo enhanced sampling method for protein-small molecule docking.BMC Bioinformatics. 2017 Jul 10;18(1):327. doi: 10.1186/s12859-017-1733-6. BMC Bioinformatics. 2017. PMID: 28693470 Free PMC article.
-
Monte Carlo replica-exchange based ensemble docking of protein conformations.Proteins. 2017 May;85(5):924-937. doi: 10.1002/prot.25262. Epub 2017 Feb 16. Proteins. 2017. PMID: 28168752
-
Detecting near-native docking decoys by Monte Carlo stability analysis.Genome Inform. 2007;18:206-14. Genome Inform. 2007. PMID: 18546488
-
Sampling and scoring: a marriage made in heaven.Proteins. 2013 Nov;81(11):1874-84. doi: 10.1002/prot.24343. Epub 2013 Aug 19. Proteins. 2013. PMID: 23775627 Free PMC article. Review.
-
Modeling of Disordered Protein Structures Using Monte Carlo Simulations and Knowledge-Based Statistical Force Fields.Int J Mol Sci. 2019 Jan 31;20(3):606. doi: 10.3390/ijms20030606. Int J Mol Sci. 2019. PMID: 30708941 Free PMC article. Review.
Cited by
-
Distance-based reconstruction of protein quaternary structures from inter-chain contacts.Proteins. 2022 Mar;90(3):720-731. doi: 10.1002/prot.26269. Epub 2021 Nov 2. Proteins. 2022. PMID: 34716620 Free PMC article.
-
Protein-Protein Docking: Past, Present, and Future.Protein J. 2022 Feb;41(1):1-26. doi: 10.1007/s10930-021-10031-8. Epub 2021 Nov 17. Protein J. 2022. PMID: 34787783 Review.
-
Using the multi-objective optimization replica exchange Monte Carlo enhanced sampling method for protein-small molecule docking.BMC Bioinformatics. 2017 Jul 10;18(1):327. doi: 10.1186/s12859-017-1733-6. BMC Bioinformatics. 2017. PMID: 28693470 Free PMC article.
-
Critical Assessment of Methods for Predicting the 3D Structure of Proteins and Protein Complexes.Annu Rev Biophys. 2023 May 9;52:183-206. doi: 10.1146/annurev-biophys-102622-084607. Epub 2023 Jan 10. Annu Rev Biophys. 2023. PMID: 36626764 Free PMC article. Review.
-
Coupling Monte Carlo, Variational Implicit Solvation, and Binary Level-Set for Simulations of Biomolecular Binding.J Chem Theory Comput. 2021 Apr 13;17(4):2465-2478. doi: 10.1021/acs.jctc.0c01109. Epub 2021 Mar 2. J Chem Theory Comput. 2021. PMID: 33650860 Free PMC article.
References
Publication types
MeSH terms
Substances
LinkOut - more resources
Full Text Sources
Other Literature Sources
