. 2015 Jul;47(7):710-6.
doi: 10.1038/ng.3332. Epub 2015 Jun 8.

Recurrent somatic mutations in regulatory regions of human cancer genomes

Affiliations

Recurrent somatic mutations in regulatory regions of human cancer genomes

Collin Melton et al. Nat Genet. 2015 Jul.

Abstract

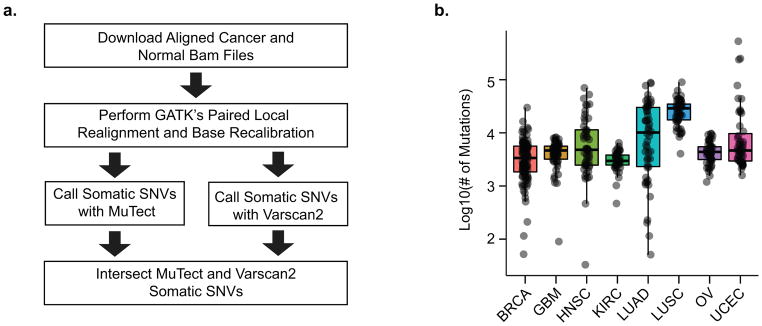
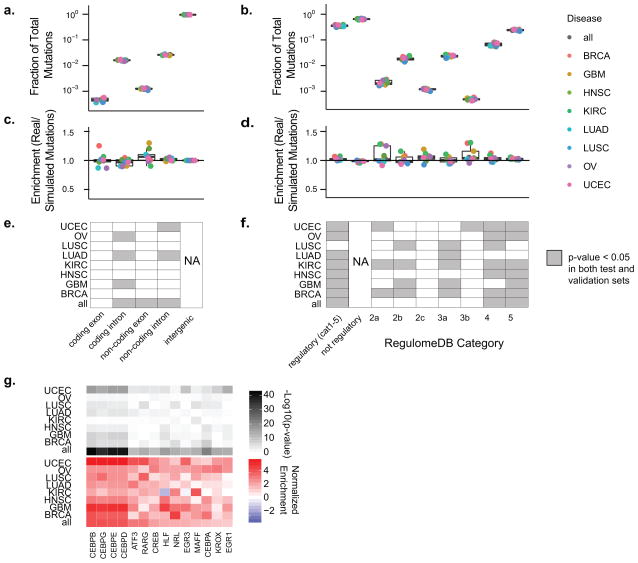
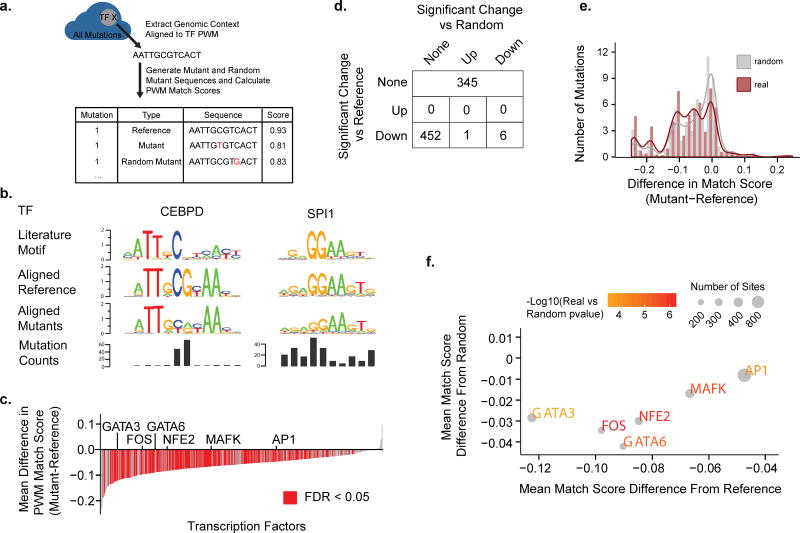
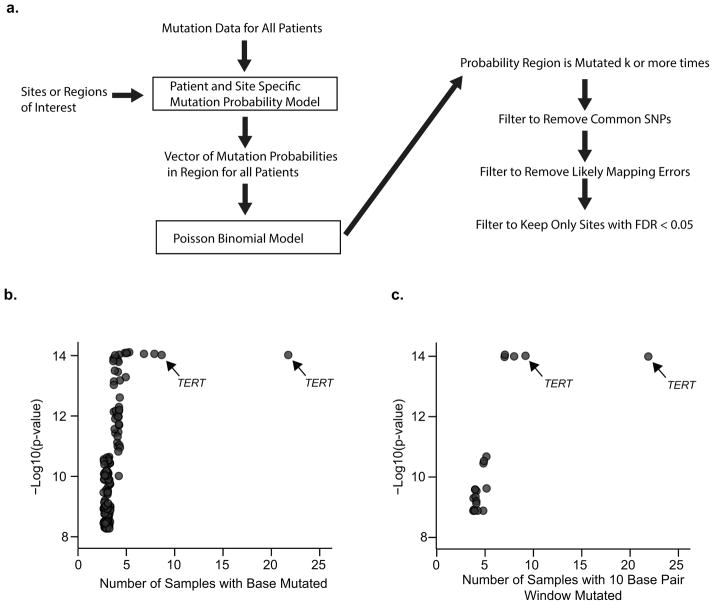
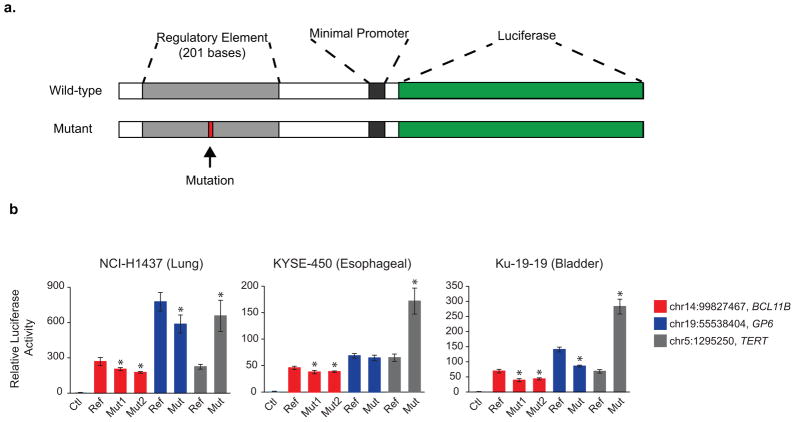
Aberrant regulation of gene expression in cancer can promote survival and proliferation of cancer cells. Here we integrate whole-genome sequencing data from The Cancer Genome Atlas (TCGA) for 436 patients from 8 cancer subtypes with ENCODE and other regulatory annotations to identify point mutations in regulatory regions. We find evidence for positive selection of mutations in transcription factor binding sites, consistent with these sites regulating important cancer cell functions. Using a new method that adjusts for sample- and genomic locus-specific mutation rates, we identify recurrently mutated sites across individuals with cancer. Mutated regulatory sites include known sites in the TERT promoter and many new sites, including a subset in proximity to cancer-related genes. In reporter assays, two new sites display decreased enhancer activity upon mutation. These data demonstrate that many regulatory regions contain mutations under selective pressure and suggest a greater role for regulatory mutations in cancer than previously appreciated.


Conflict of interest statement

Competing Interests Statement

The authors declare no competing financial interests.

Figures

Figure 1
Figure 1
Mutation Calling From Whole Genome Sequencing (A) A schematic of the mutation calling workflow is depicted. (B) The number of mutations found in each cancer is plotted and overlaid with boxplots indicating the observed distribution for cancers of the same type. Upper and lower hinges correspond to 1st and 3rd quartiles. Center corresponds to the median. Whiskers correspond to highest/lowest values within a distance of 1.5 times the IQR from the hinge. BRCA=Breast Invasive Carcinoma, GBM=Glioblastoma Multiforme, HNSC=Head and Neck Squamous Cell Carcinoma, KIRC=Kidney Renal Clear Cell Carcinoma, LUAD=Lung Adenocarcinoma, LUSC=Lung Squamous Cell Carcinoma, OV=Ovarian Serous Cystadenocarcinoma, UCEC=Uterine Corpus Endometrial Carcinoma
Figure 2
Figure 2
Global Analysis of Mutations in Coding and Regulatory Regions (A) Boxplots of the frequency relative to all mutations for each Gencode transcript region type are shown for each cancer type. Overlaid points represent each cancer type. (B) Similar to (A), boxplots of mutations pooled by cancer type are shown for regulatory and non-regulatory regions. Regulatory categories shown are from RegulomeDB. (C) Boxplots depict enrichment analysis of real mutations compared to simulated mutations in various Gencode transcript regions. (D) Similar to (C), boxplots depict enrichment analysis of regulatory region real mutations compared to simulated mutations for mutations annotated with various RegulomeDB scores. (E&F) Plots of sample and annotation (GENCODE transcript region in E and RegulomeDB score in F) pairs with a significant enrichment or depletion in real versus simulated mutations compared to intergenic regions (E) and not regulatory regions (F). Gray denotes P value (two-sided Fisher’s exact test) less than 0.05 in both test and validation sets. (G) Heatmaps of add-one smoothed enrichment and −log10(p-values) (two-sided Fisher’s exact test) are shown for pairs of cancer type and mutations subcategorized by transcription factor binding sites. Only factors that pass significance (FDR < 0.001) in the combined set of all cancer types for test and train are shown.
Figure 3
Figure 3
Effects of Mutations on Transcription Factor Binding Sites (A) An illustration is shown describing the methodology of aligning and generating match scores for mutations contained within transcription factor binding sites. (B) Mutated regions for each transcription factor were aligned to the factor’s PWM and sequence logos were generated. Sequence logos for the literature motif, the aligned reference, and the aligned mutant sequences as well as the mutation counts at each position are shown for two representative transcription factors (CEBPD and SPI1). (C) For each transcription factor the match score to the transcription factor PWM was determined for all the factors mutated sites. Plotted is the mean difference in the match score (y-axis) for each transcription factor (x-axis) between the mutated sites and the reference. Red indicates FDR<0.05. P-value computed by two-sided paired Wilcoxon rank-sum test. (D) A table showing the breakdown of transcription factors that contain sites with match scores that are significantly different than reference and/or significantly different than those of random mutations. (E) A histogram of pooled match scores of factors that are significantly worse than reference and worse than random. (F) For each transcription factor with a significantly worse match score than reference and random the mean difference between the mutant sites and reference (x-axis) is plotted against the mean difference between the mutant sites and random mutant sites (y-axis). The color of the text scales with the −log10(p-value) of the real versus random scores and the size of the point scales with the number of mutant sites.
Figure 4
Figure 4
Identification of Repeatedly Mutated Regulatory Regions (A) Schematic of the significance assessment algorithm. For each regulatory site or window, the probability of k or more cancers containing a mutation in the region is approximated by a Poisson binomial model. Each mutation in each cancer sample is assigned a sample and site-specific mutation probability according to a logistic regression model. This model estimates the probability of mutation conditioned on replication timing, base pair type, transcript annotations, and sample ID. Post analysis filtering is performed to limit false positives. Sites are first filtered to remove common SNPs and likely mapping errors and then subjected to a false discovery rate cutoff of 0.05. (B) Shown is the −log10 of the probability of repeated mutation of individual sites for regulatory regions (y-axis) versus the number of times the site is found mutated (x-axis). (C) Shown is the −log10 of the probability of repeated mutation of 10 base pair windows for regulatory regions versus the number of times the site is found mutated. Arrows point to 2 known regulatory mutations in the TERT promoter.
Figure 5
Figure 5
Functional Validation of Identified Mutated Regions (A) Schematic of the luciferase reporter assays used to assess enhancer activity of the identified mutated regions. (B) Luciferase assay results for the wild-type and mutant versions of three regulatory regions repeatedly mutated in cancers. Assays are performed in NCI-H1437 (Lung), KYSE-450 (Esophageal), and Ku-19-19 (Bladder) cell lines. * represents p<0.05 (two-sided t-test) with 4 replicates. Error bars depict the standard deviation.

References

    1. Hoyert DL, Xu J. Deaths: Preliminary Data for 2011. National Vital Statistics Reports. 2012;61 - PubMed
    1. Howlander, et al. SEER Cancer Statistics Review, 1975–2010. 2013 at < http://seer.cancer.gov/csr/1975_2010/>.
    1. Lifetime Risk (Percent) of Being Diagnosed with Cancer by Site and Race/Ethnicity: Males, 18 SEER Areas, 2008–2010 (Table 1.16) and Females, 18 SEER Areas, 2008–2010 (Table 1.17). at <http://seer.cancer.gov/csr/1975_2010/results_merged/topic_lifetime_risk_diagnosis.pdf>

    1. Lifetime Risk (Percent) of Dying from Cancer by Site and Race/Ethnicity: Males, Total US, 2008–2010 (Table 1.19) and Females, Total US, 2008–2010 (Table 1.20). at <http://seer.cancer.gov/csr/1975_2010/results_merged/topic_lifetime_risk_death.pdf>

    1. Tamborero D, et al. Comprehensive identification of mutational cancer driver genes across 12 tumor types. Sci Rep. 2013;3:2650. - PMC - PubMed

Publication types