. 2015 Jul;47(7):839-46.
doi: 10.1038/ng.3330. Epub 2015 Jun 8.

Statistical colocalization of genetic risk variants for related autoimmune diseases in the context of common controls

Affiliations

Statistical colocalization of genetic risk variants for related autoimmune diseases in the context of common controls

Mary D Fortune et al. Nat Genet. 2015 Jul.

Erratum in

Abstract

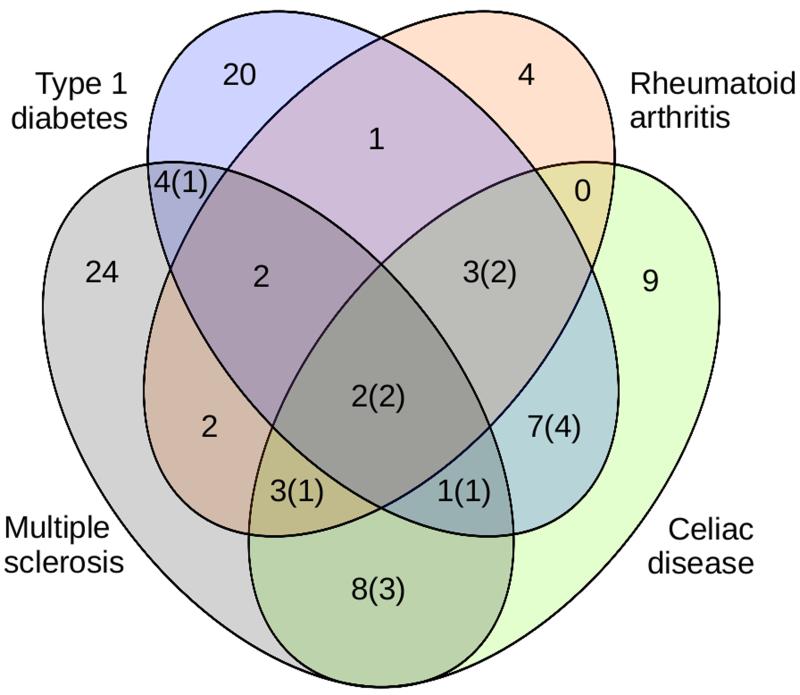
Determining whether potential causal variants for related diseases are shared can identify overlapping etiologies of multifactorial disorders. Colocalization methods disentangle shared and distinct causal variants. However, existing approaches require independent data sets. Here we extend two colocalization methods to allow for the shared-control design commonly used in comparison of genome-wide association study results across diseases. Our analysis of four autoimmune diseases--type 1 diabetes (T1D), rheumatoid arthritis, celiac disease and multiple sclerosis--identified 90 regions that were associated with at least one disease, 33 (37%) of which were associated with 2 or more disorders. Nevertheless, for 14 of these 33 shared regions, there was evidence that the causal variants differed. We identified new disease associations in 11 regions previously associated with one or more of the other 3 disorders. Four of eight T1D-specific regions contained known type 2 diabetes (T2D) candidate genes (COBL, GLIS3, RNLS and BCAR1), suggesting a shared cellular etiology.


Figures

Figure 1
Figure 1
A Venn diagram showing summary of disease assignments to 90 regions which showed association to at least one disease, based upon the results of the Bayesian analysis. In cases where assignment was uncertain, the assignment most supported by the posterior probabilities was used. The numbers in brackets correspond to how many of these regions show evidence of distinct causal variants. Thirty–six regions analyzed did not demonstrate association to any disease within our available data, and so are not included in this figure.
Figure 2
Figure 2
The distribution of η^, the estimated proportionality coefficient, together with its 95% confidence interval. In the case of colocalization, η is the ratio of the effects the region exert upon the two traits. ∣η∣ > 1 corresponds to a stronger effect in Trait 2 than Trait 1. We estimate η by η^. Labels on the x–axis give the traits and regions analyzed; D for T1D, R for RA, C for CEL and M for MS. Note that in some regions, the conditional analysis supports the existence of multiple associated variants: if none of these overlap, then we consider the region to have separate SNP effects. (a) Regions with novel evidence of disease association, in which we believe there to be colocalization present between the novel association and at least one of the existing associations. Regions have been ordered such that η^ estimates the effect size for the novel trait divided by the effect size for the known association. Labels give the novel association being given first. It can be seen that the effect size tends to be smaller in the new disease. (b) Regions with strong evidence of colocalization (P(H4)>0.9). As we would expect, η^ is distributed about 1, which corresponds to the regions having equal effects on each trait. Note that 6q25.3, containing the candidate causal gene TAGAP, has η^<0, indicating opposite effects on the two diseases. Trait 1 is listed first, and trait 2 second.
Figure 3
Figure 3
The 2q33.1 region containing the candidate gene CTLA4. Three potential causal variants are partially shared between T1D, RA and CEL. (a) A Manhattan plot of the region. The blue signal corresponds to the tag rs231775, the green to rs1980422 and the magenta to rs3087243. All other SNPs are colored according to their linkage disequilibrium with these three SNPs. SNPs rs231775 and rs3087243 have r2 = 0.50; all other pairwise r2 < 0.1. (b) Each possible model involving these three SNPs was tested; the four models with highest posterior probabilities, which together encompass over 90% of the total posterior probability, are shown. (c) Effect size estimates (including 95% confidence intervals) of each SNP for each disease for the most likely model. (d) Effect size estimates (including 95% confidence intervals) of each SNP for each disease for the second most likely model.
Figure 4
Figure 4
The 6q23.3 region containing candidate causal gene TNFAIP3. Our results show that T1D, RA and CEL all colocalize, suggesting a single shared causal variant affecting the three diseases; rs6933404 being the most likely SNP. There is also evidence of MS association, driven by a distinct causal variant. Note that this region was associated with MS at genome–wide significant levels in the analysis of the international MS dataset.

References

    1. Cotsapas C, et al. Pervasive sharing of genetic effects in autoimmune disease. PLoS Genet. 2011;7 - PMC - PubMed
    1. Plagnol V, Smyth DJ, Todd JA, Clayton DG. Statistical independence of the colocalized association signals for type 1 diabetes and RPS26 gene expression on chromosome 12q13. Biostatistics. 2009;10:327–334. - PMC - PubMed
    1. Wallace C, et al. Statistical colocalization of monocyte gene expression and genetic risk variants for type 1 diabetes. Hum Mol Genet. 2012;44:1–35. - PMC - PubMed
    1. Wallace C. Statistical testing of shared genetic control for potentially related traits. Genet Epidemiol. 2013;37:802–813. - PMC - PubMed
    1. Giambartolomei C, et al. Bayesian test for colocalization between pairs of genetic association studies using summary statistics. PLoS Genet. 2014;10:e1004383. - PMC - PubMed

Methods-Only References

    1. Onengut–Gumuscu S, et al. Fine Mapping of type 1 diabetes susceptibility loci and evidence for colocalization of causal variants with lymphoid gene enhancers. Nat Genet. 2014 in press. - PMC - PubMed
    1. Cooper JD, et al. Seven newly identified loci for autoimmune thyroid disease. Hum Mol Genet. 2012;21:5202–8. - PMC - PubMed
    1. Raftery AE. Approximate Bayes factors and accounting for model uncertainty in generalised linear models. Biometrika. 1996;83:251–266.
    1. Swafford ADE, et al. An allele of IKZF1 (Ikaros) conferring susceptibility to childhood acute lymphoblastic leukemia protects against type 1 diabetes. Diabetes. 2011;60:1041–4. - PMC - PubMed

Publication types