. 2015 Jul;47(7):746-56.
doi: 10.1038/ng.3291. Epub 2015 Jun 8.

Whole-genome fingerprint of the DNA methylome during human B cell differentiation

Affiliations

Whole-genome fingerprint of the DNA methylome during human B cell differentiation

Marta Kulis et al. Nat Genet. 2015 Jul.

Abstract

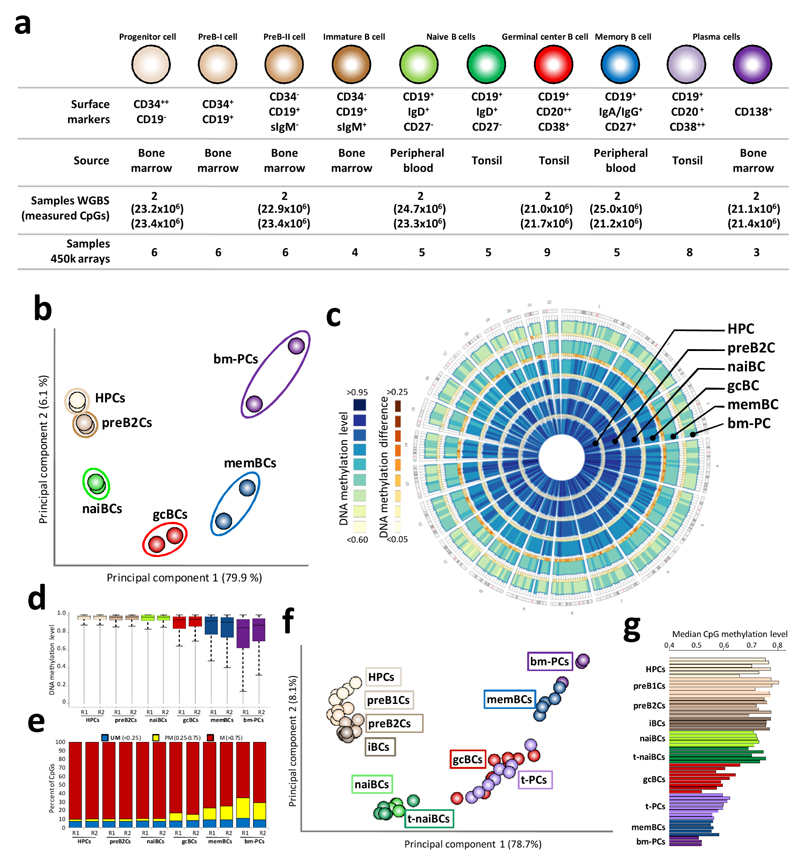
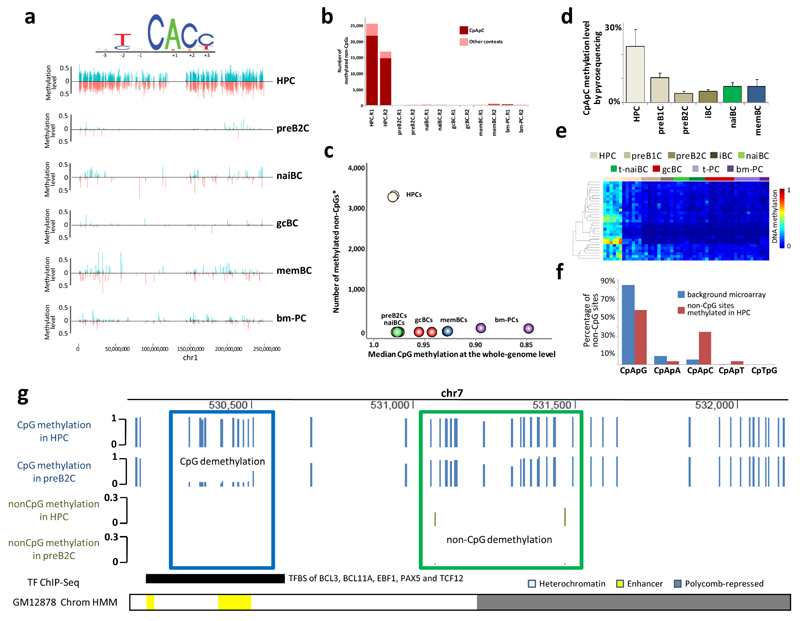
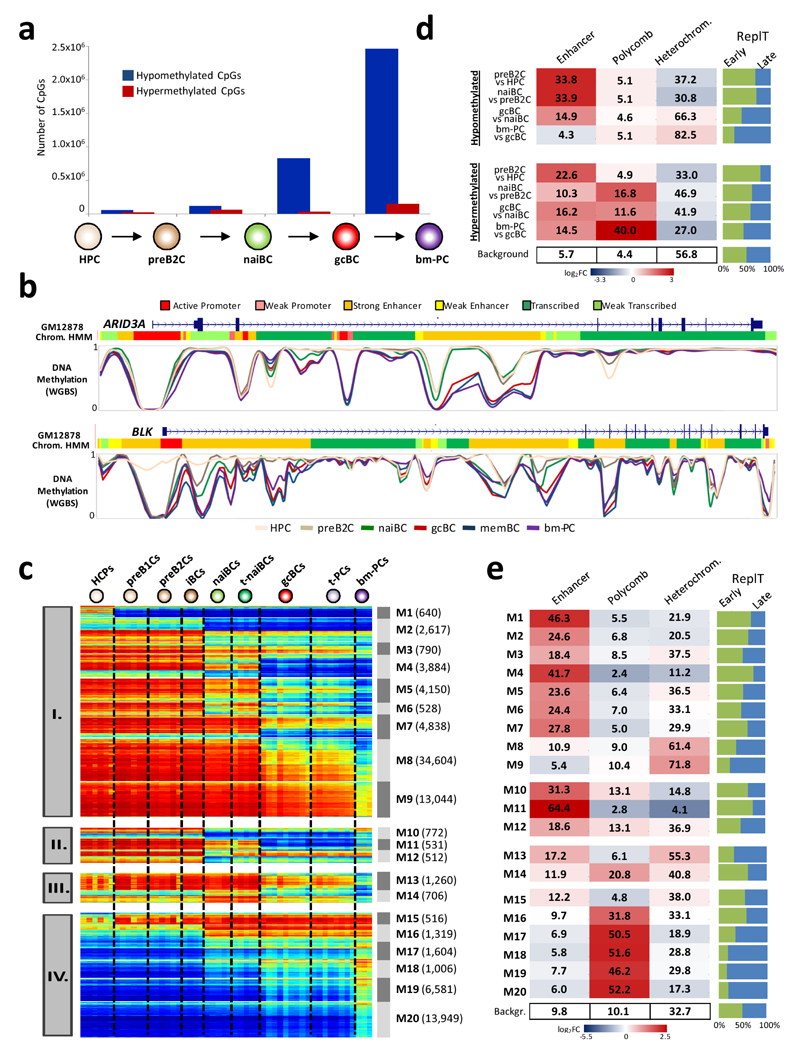
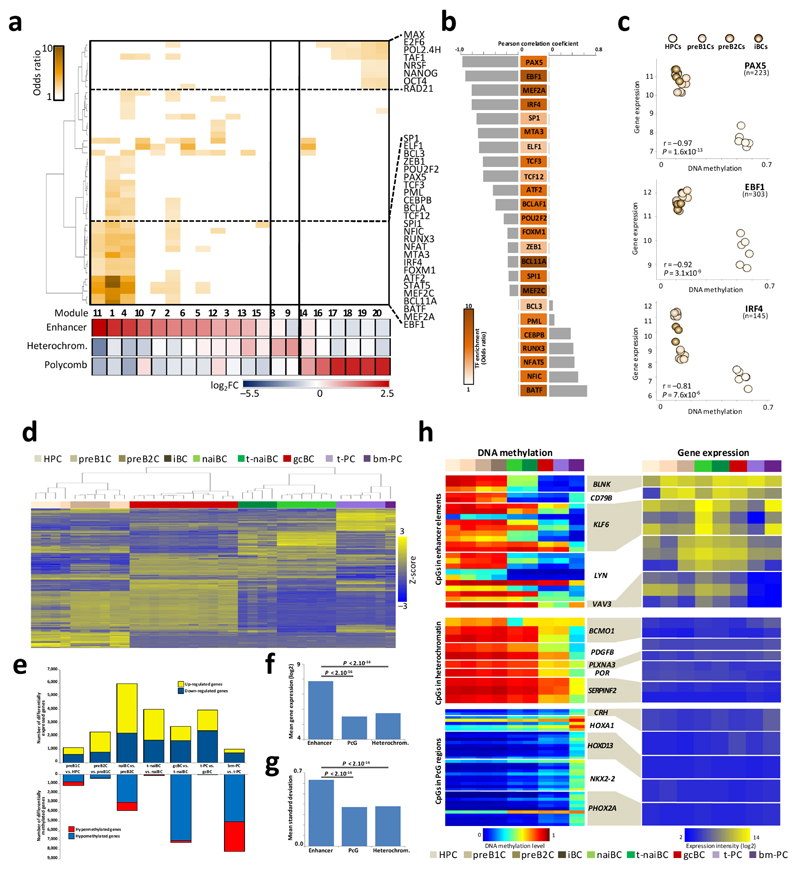
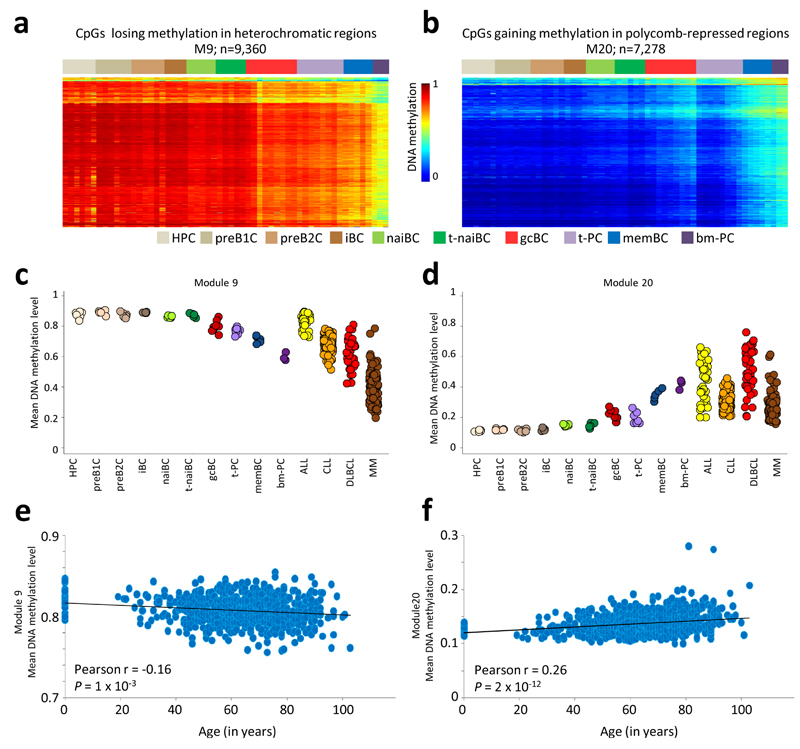
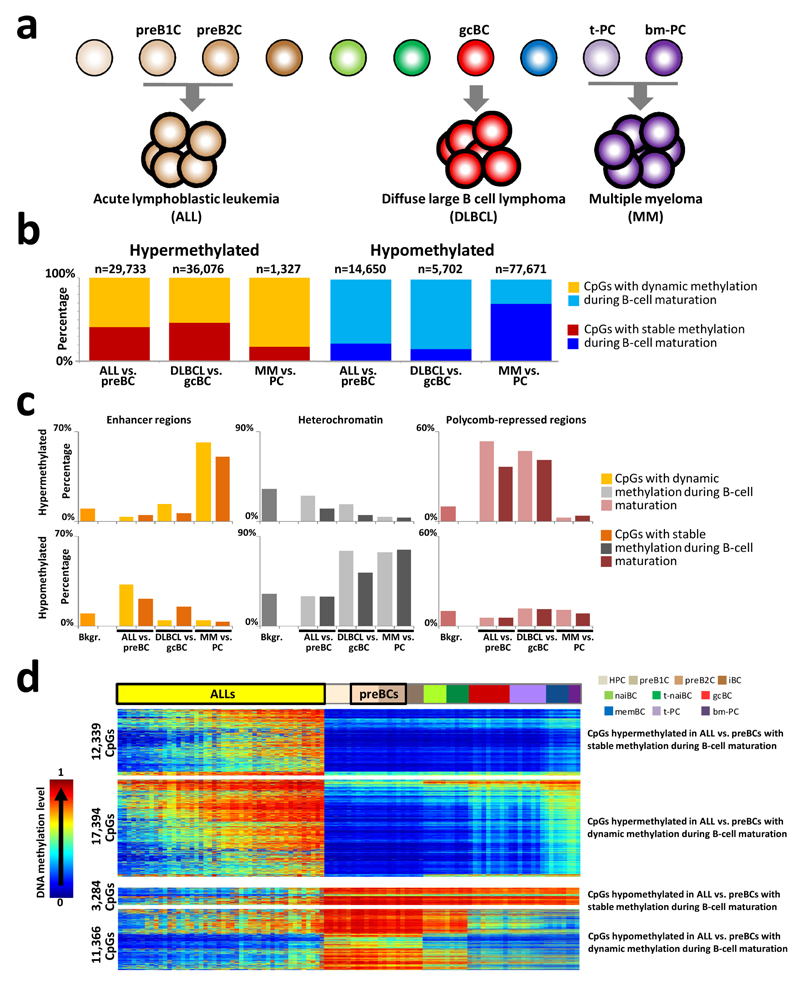
We analyzed the DNA methylome of ten subpopulations spanning the entire B cell differentiation program by whole-genome bisulfite sequencing and high-density microarrays. We observed that non-CpG methylation disappeared upon B cell commitment, whereas CpG methylation changed extensively during B cell maturation, showing an accumulative pattern and affecting around 30% of all measured CpG sites. Early differentiation stages mainly displayed enhancer demethylation, which was associated with upregulation of key B cell transcription factors and affected multiple genes involved in B cell biology. Late differentiation stages, in contrast, showed extensive demethylation of heterochromatin and methylation gain at Polycomb-repressed areas, and genes with apparent functional impact in B cells were not affected. This signature, which has previously been linked to aging and cancer, was particularly widespread in mature cells with an extended lifespan. Comparing B cell neoplasms with their normal counterparts, we determined that they frequently acquire methylation changes in regions already undergoing dynamic methylation during normal B cell differentiation.


Conflict of interest statement

Competing Financial Interest

The authors declare no competing financial interests.

Figures

Figure 1
Figure 1. Analysis of the DNA methylome of different B-cell subpopulations by WGBS and microarrays.
(a) Description of the B-cell subpopulations and techniques used in this study. (b) Unsupervised principal component analysis (PCA) of WGBS data of two biological replicates per cell subpopulation. (c) Circular representation of DNA methylation levels for HPC, preB2C, naiBC, gcBC, memBC and bm-PC measured by WGBS. CpG methylation levels were averaged in 10-Mbp genomic windows and represented as histogram tracks. The heatmap indicates the DNA methylation change with respect to the sample in the next-innermost track. (d) Boxplot summarizing the distribution of DNA methylation levels per sample of the 16.1 million CpGs with methylation estimates in all 12 samples. (e) Global methylation status of samples measured by WGBS. Percentage of methylated (M, in red), partially methylated (PM, in yellow) and unmethylated (UM, in blue) CpGs. (f) Unsupervised PCA of microarray methylation data of all samples used in the study. (g) Median values of DNA methylation data measured by microarrays. HPC: hematopoietic progenitor cell. preB1C: pre-B-I cell. preB2C: pre-B-II cell. iBC: immature B cell. naiBC: naive B cell from peripheral blood. t-naiBC: naive B cell from tonsil. gcBC: germinal center B cell. t-PC: plasma cell from tonsil. memBC: memory B cell from peripheral blood. bm-PC: plasma cell from bone marrow. In panels d and e, R1 and R2 refer to the two biological replicates.
Figure 2
Figure 2. Non-CpG methylation detected during B-cell differentiation.
(a) Browser representation of non-CpG methylation, which takes place mostly in the CpApC sequence context (only chromosome 1 is shown). Methylation in the reverse strand is marked in blue whereas that in the forward strand appears in red. (b) Number of non-CpG sites with non-zero methylation in different B-cell subpopulations detected by WGBS. Methylated cytosines in the CpApC context are marked in dark red and those in other contexts in pale red. (c) Scatter plot showing the numbers of methylated non-CpG sites (*using only the 3,437 non-CpGs with methylation estimates in all 12 samples and methylated in at least one of them) and median CpG methylation levels. In this analysis, 99% of the non-CpGs methylated in one HPC sample were also methylated in the biological replicate. (d) Validation of non-CpG methylation by bisulfite pyrosequencing in two independent biological replicates of each subpopulation. For this analysis, we used a CpApC site (chr2: 85,933,406) shown to be methylated in HPCs by WGBS. (e) Heatmap representation of 26 methylated non-CpGs measured by microarrays (mean methylation = 34.7%). (f) Percentage of methylated non-CpGs in distinct sequence contexts detected by microarrays. (g) Representation of CpG and non-CpG dynamics upon B-cell commitment. CpG methylation is marked in blue and non-CpG methylation in green. Regions with CpG methylation loss (enhancer region, blue box) and non-CpG methylation loss (heterochromatin and polycomb-repressed region, green box) are not coupled.
Figure 3
Figure 3. Dynamic DNA methylation during B-cell differentiation.
(a) Differentially methylated CpGs detected by WGBS considering the two replicates per cell subpopulation (see online methods for an explanation of the criteria). (b) Smoothed DNA methylation data generated by WGBS across the promoter region and gene body of ARID3A and BLK. The DNA methylation pattern of these genes is widely modulated in different B-cell subpopulations, especially in enhancer regions. (c) Heatmap representation of 20 major modules of dynamic CpGs, divided in 4 different patterns, detected by microarrays. The number of CpGs within each module is given in brackets. (d) Chromatin state characterization of differentially methylated CpGs identified by WGBS. (e) Chromatin state characterization of the 20 major modules detected by microarrays. In panels d and e, numbers indicate the percentage of sites located in enhancers, polycomb-repressed regions or heterochromatin. The blue to red color scale represents log2 of enrichment values, with respect to the background. Green and blue bars represent percentages of differentially methylated sites that reside in early- or late-replicating regions, respectively. RepT: replication timing.
Figure 4
Figure 4. Association between DNA methylation and gene expression in different chromatin states.
(a) Heatmap representing significant (P < 0.01) enrichments for transcription factor binding sites (TFBSs) in different methylation modules identified by arrays. Below the heatmap, log2 enrichment for enhancer, heterochromatin and polycomb-repressed regions in each differentially methylated group is represented. (b) Correlation between the expression levels of TFs and the mean methylation levels of their binding sites using samples with available expression and methylation data from the same donors. For this analysis, we analyzed methylation data from module 1 (demethylation upon B-cell commitment) and gene expression data of precursor cells. The white to brown color scale represents the odds ratio for TFBS enrichments. (c) Scatter plots showing the correlation of expression levels of PAX5, EBF1 and IRF4 with the mean methylation of their binding sites in each sample (the number of TFBS associated with CpGs belonging to module M1 is shown below the TF name). (d) Unsupervised cluster analysis of gene expression data using the 687 tags (439 genes) with the highest variability (SD > 2) across the B-cell differentiation process. (e) Differentially expressed genes (upper part) and differentially methylated genes (lower part) in each comparison of adjacent cell subpopulations. (f-g) Mean expression levels (f) and expression variability (g) during B-cell differentiation of genes containing dynamic CpGs targeting enhancers, polycomb-repressed regions and heterochromatin. (h) Heatmaps showing DNA methylation levels (left) and gene expression levels (right) of representative genes with dynamic methylation in enhancers, heterochromatin and polycomb-repressed regions.
Figure 5
Figure 5. DNA methylation changes during B-cell differentiation in the context of cancer and aging.
(a) Heatmap of a subset of CpGs from module M9 that lose methylation in heterochromatin regions. (b) Heatmap of subset of CpGs from module M20 that gain methylation in polycomb-repressed regions. (c-d) Scatter plots representing the mean methylation levels of CpGs in heterochromatin from M9 (c) and CpGs in polycomb-repressed regions from M20 (d) in different B-cell subsets and four types of hematological neoplasms. (e-f) Mean methylation levels of CpGs in heterochromatin from M9 (e) and of CpGs in polycomb-repressed regions from M20 (f) in whole blood samples isolated from donors of different age. ALL: acute lymphoblastic leukemia. CLL: chronic lymphocytic leukemia. DLBCL: diffuse large B-cell lymphoma. MM: multiple myeloma.
Figure 6
Figure 6. DNA methylation changes in various B-cell neoplasms as compared to their normal counterparts.
(a) Differential methylation analysis was performed in three models of lymphoid neoplasms that arise from three distinct maturation stages of B-cell development: ALL vs. precursor B-cells (i.e. preB1C and preB2C), the GCB subgroup of DLBCL vs. gcBC, and MM vs. plasma cells (i.e. t-PC and bm-PC). (b) Barplots showing the proportion of dynamically methylated CpGs in B-cell differentiation that are also differentially methylated in hematological neoplasias as compared to their normal counterparts. (c) Percentage of hypermethylated (upper panels) and hypomethylated (lower panels) CpGs located in enhancers (left), heterochromatin (middle) and polycomb-repressed regions (right). Pale orange, gray and burgundy represent fraction of CpGs that are dynamically methylated during B-cell differentiation while dark shades of the same colors correspond to CpGs with stable methylation throughout B-cell maturation. (d) Heatmap representing differentially methylated CpGs in ALL as compared to precursor B cells in the context of normal B-cell differentiation. ALL: acute lymphoblastic leukemia. DLBCL: diffuse large B-cell lymphoma. MM: multiple myeloma. Bkgr: background of 450k microarray data.

References

    1. Ziller MJ, et al. Charting a dynamic DNA methylation landscape of the human genome. Nature. 2013;500:477–81. - PMC - PubMed
    1. Bernstein BE, Meissner A, Lander ES. The mammalian epigenome. Cell. 2007;128:669–81. - PubMed
    1. Smith ZD, Meissner A. DNA methylation: roles in mammalian development. Nat Rev Genet. 2013;14:204–20. - PubMed
    1. Bergman Y, Cedar H. DNA methylation dynamics in health and disease. Nat Struct Mol Biol. 2013;20:274–81. - PubMed
    1. Bird A. DNA methylation patterns and epigenetic memory. Genes Dev. 2002;16:6–21. - PubMed

Publication types