

Effect of reducing portion size at a compulsory meal on later energy intake, gut hormones, and appetite in overweight adults
- PMID: 26054049
- PMCID: PMC7212075
- DOI: 10.1002/oby.21105
Effect of reducing portion size at a compulsory meal on later energy intake, gut hormones, and appetite in overweight adults
Abstract
Objective: Larger portion sizes (PS) are associated with greater energy intake (EI), but little evidence exists on the appetitive effects of PS reduction. This study investigated the impact of reducing breakfast PS on subsequent EI, postprandial gastrointestinal hormone responses, and appetite ratings.
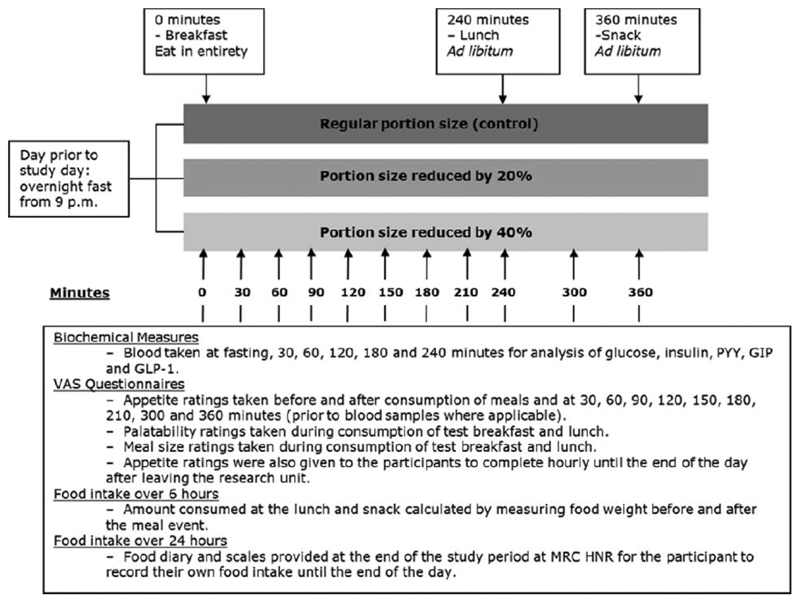
Methods: In a randomized crossover design (n = 33 adults; mean BMI 29 kg/m(2) ), a compulsory breakfast was based on 25% of gender-specific estimated daily energy requirements; PS was reduced by 20% and 40%. EI was measured at an ad libitum lunch (240 min) and snack (360 min) and by weighed diet diaries until bed. Blood was sampled until lunch in 20 participants. Appetite ratings were measured using visual analogue scales.
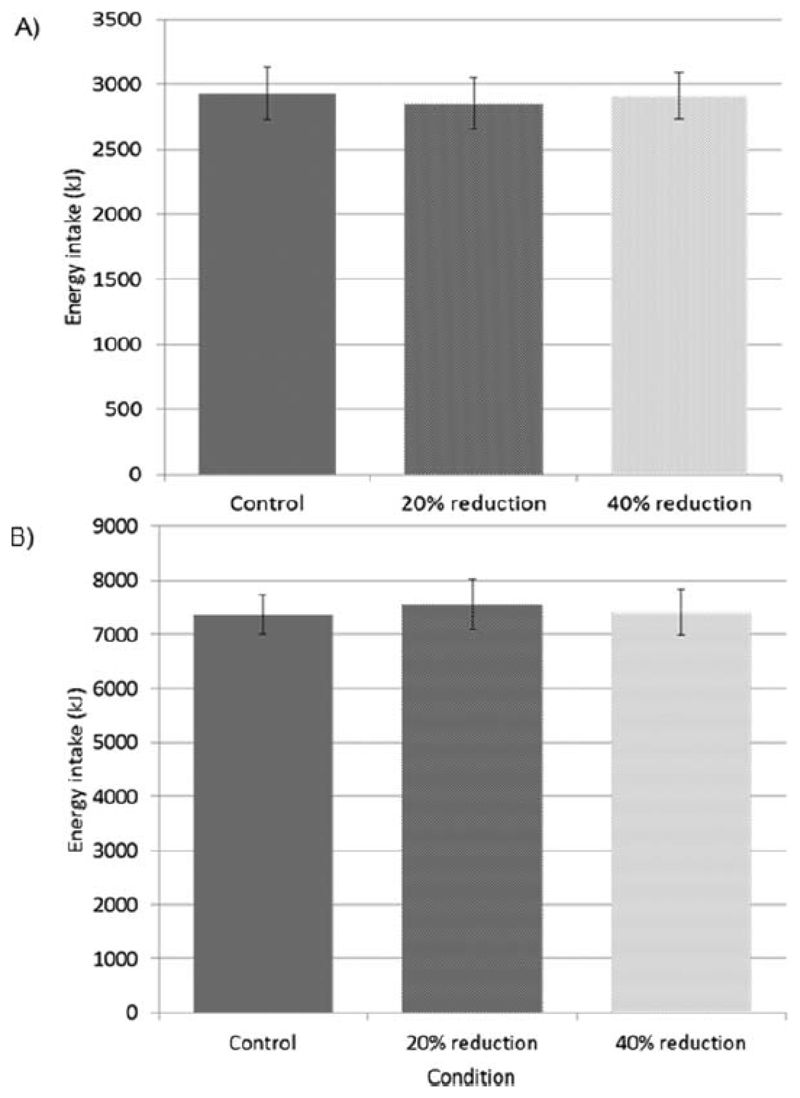
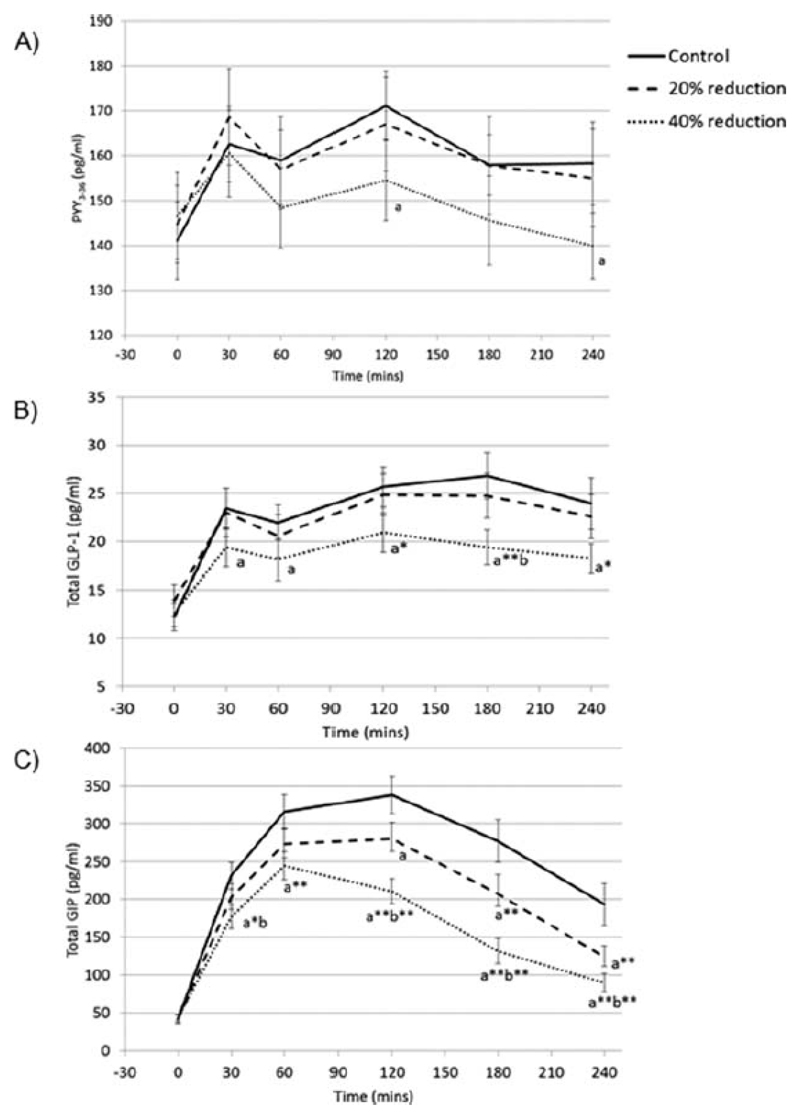
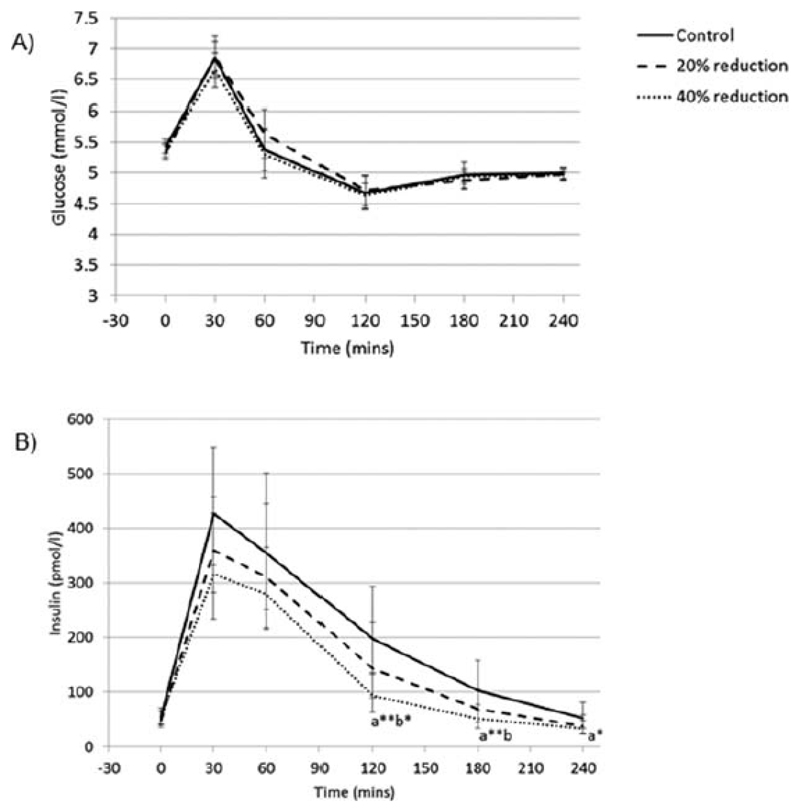
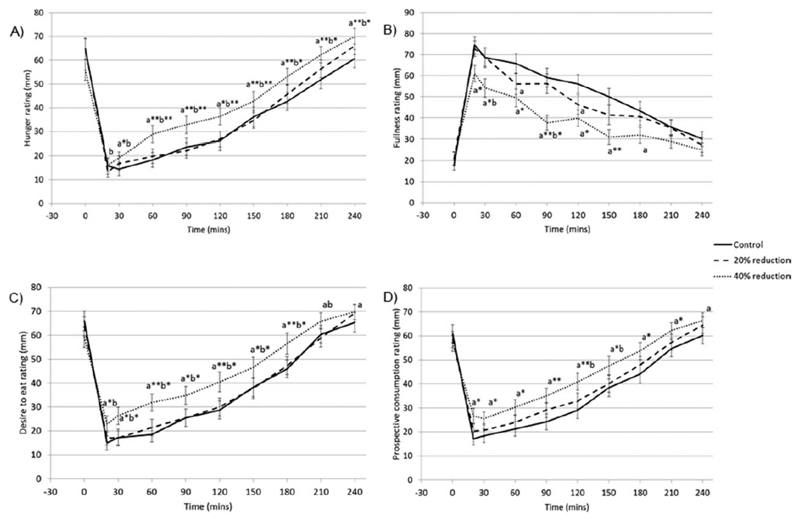
Results: EI at lunch (control: 2,930 ± 203; 20% reduction: 2,853 ± 198; 40% reduction: 2,911 ± 179 kJ) and over the whole day except breakfast (control: 7,374 ± 361; 20% reduction: 7,566 ± 468; 40% reduction: 7,413 ± 417 kJ) did not differ. Postprandial PYY, GLP-1, GIP, insulin, and fullness profiles were lower and hunger, desire to eat, and prospective consumption higher following 40% reduction compared to control. Appetite ratings profiles, but not hormone concentrations, were associated with subsequent EI.
Conclusions: Smaller portions at breakfast led to reductions in gastrointestinal hormone secretion but did not affect subsequent energy intake, suggesting small reductions in portion size may be a useful strategy to constrain EI.
© 2015 The Obesity Society.
Conflict of interest statement
SAJ is the independent Chair of the Department of Health Responsibility Deal Food Network in England, which includes voluntary agreements with industry to reduce the portion size of some food and drinks. No other authors declare a conflict of interest.
Figures
References
-
- Nielsen SJ, Popkin BM. Patterns and trends in food portion sizes, 1977-1998. JAMA. 2003;289(4):450–453. - PubMed
-
- Rolls BJ, Morris EL, Roe LS. Portion size of food affects energy intake in normal-weight and overweight men and women. Am J Clin Nutr. 2002;76(6):1207–1213. - PubMed
-
- Rolls BJ, Roe LS, Meengs JS. The effect of large portion sizes on energy intake is sustained for 11 days. Obesity. 2007;15(6):1535–1543. - PubMed
-
- Prentice A, Jebb S. Energy intake/physical activity interactions in the homeostasis of body weight regulation. Nutr Rev. 2004;62(7):S98–S104. - PubMed
Publication types
MeSH terms
Substances
Grants and funding
LinkOut - more resources
Full Text Sources
Other Literature Sources
