. 2015 Oct:82:164-175.
doi: 10.1016/j.nbd.2015.05.016. Epub 2015 Jun 6.

The developmental evolution of the seizure phenotype and cortical inhibition in mouse models of juvenile myoclonic epilepsy

Affiliations

The developmental evolution of the seizure phenotype and cortical inhibition in mouse models of juvenile myoclonic epilepsy

Fazal Arain et al. Neurobiol Dis. 2015 Oct.

Abstract

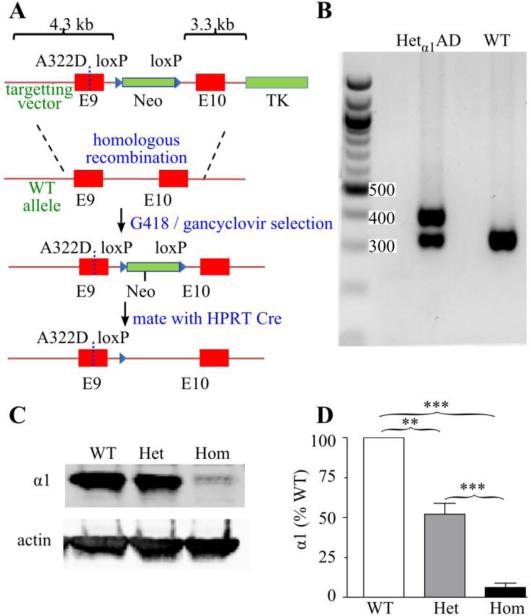
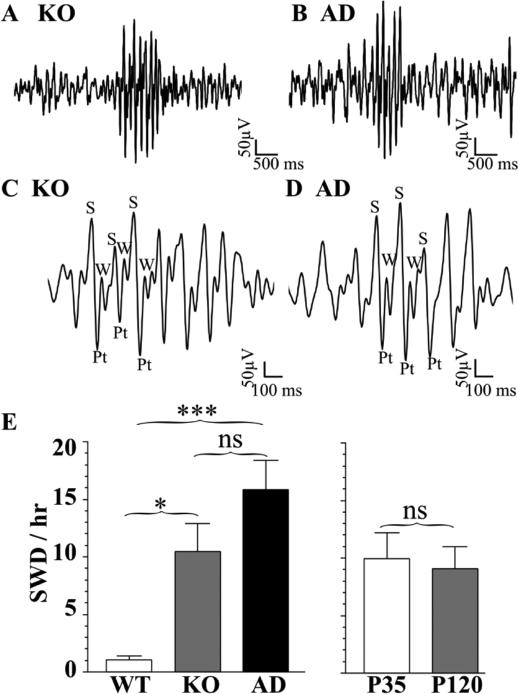
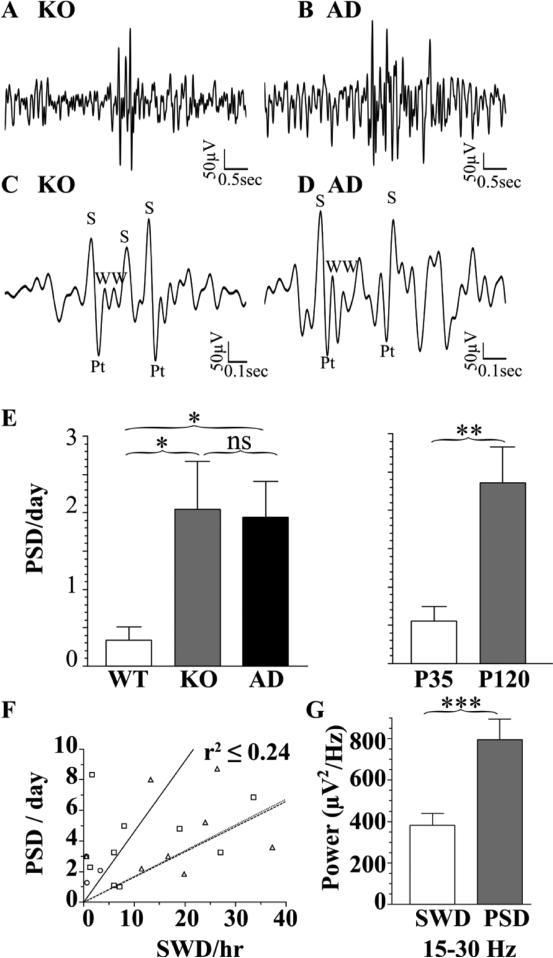
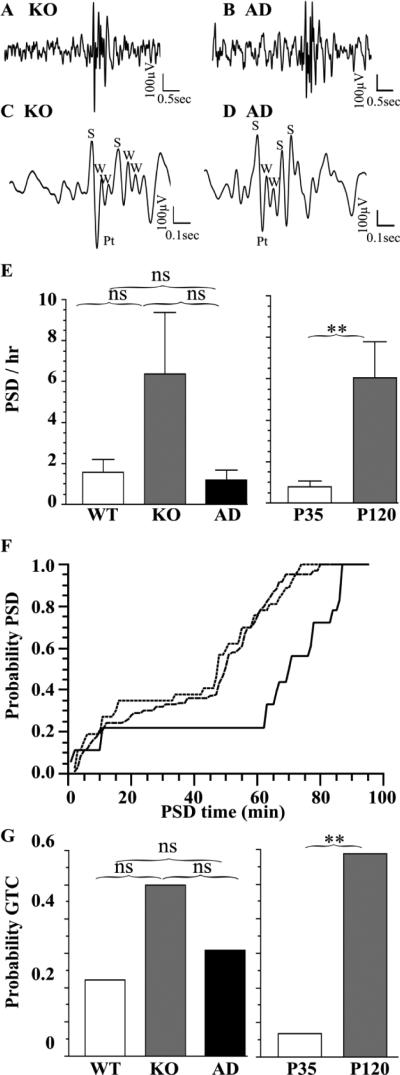
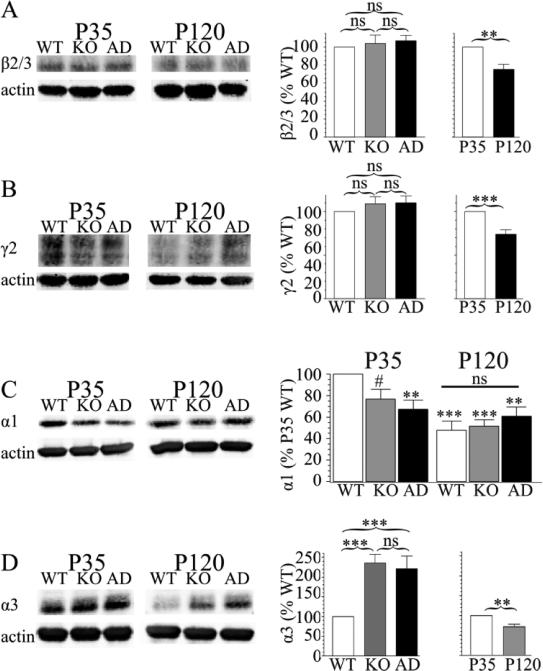
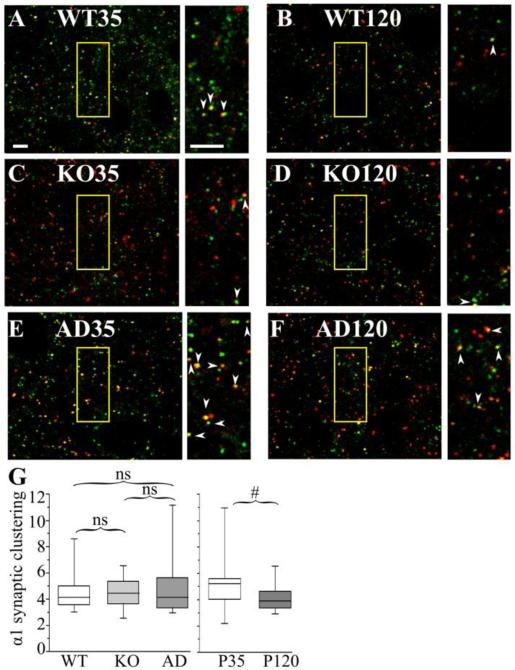
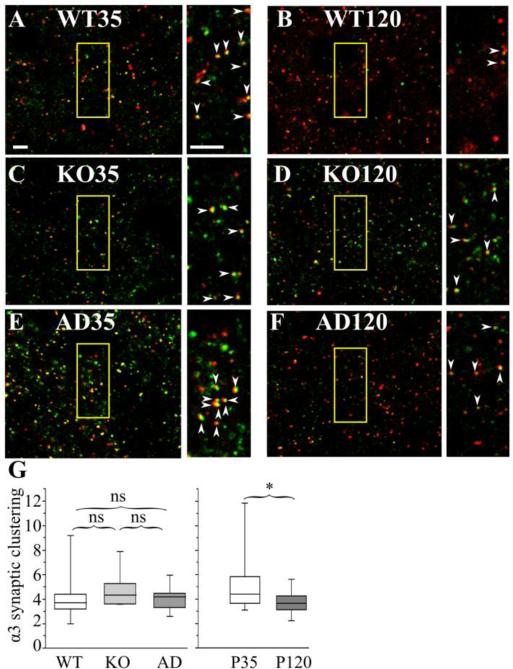
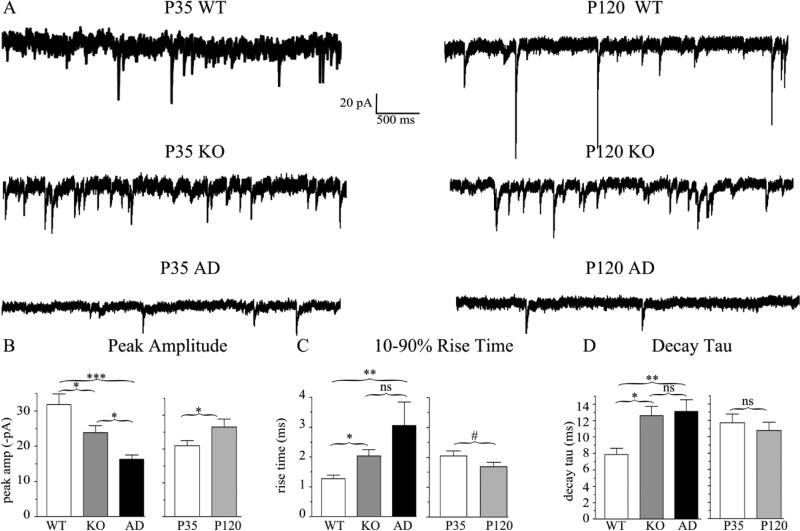
The GABA(A) receptor (GABA(A)R) α1 subunit mutation, A322D, causes autosomal dominant juvenile myoclonic epilepsy (JME). Previous in vitro studies demonstrated that A322D elicits α1(A322D) protein degradation and that the residual mutant protein causes a dominant-negative effect on wild type GABA(A)Rs. Here, we determined the effects of heterozygous A322D knockin (Het(α1)AD) and deletion (Het(α1)KO) on seizures, GABA(A)R expression, and motor cortex (M1) miniature inhibitory postsynaptic currents (mIPSCs) at two developmental time-points, P35 and P120. Both Het(α1)AD and Het(α1)KO mice experience absence seizures at P35 that persist at P120, but have substantially more frequent spontaneous and evoked polyspike wave discharges and myoclonic seizures at P120. Both mutant mice have increased total and synaptic α3 subunit expression at both time-points and decreased α1 subunit expression at P35, but not P120. There are proportional reductions in α3, β2, and γ2 subunit expression between P35 and P120 in wild type and mutant mice. In M1, mutants have decreased mIPSC peak amplitudes and prolonged decay constants compared with wild type, and the Het(α1)AD mice have reduced mIPSC frequency and smaller amplitudes than Het(α1)KO mice. Wild type and mutants exhibit proportional increases in mIPSC amplitudes between P35 and P120. We conclude that Het(α1)KO and Het(α1)AD mice model the JME subsyndrome, childhood absence epilepsy persisting and evolving into JME. Both mutants alter GABA(A)R composition and motor cortex physiology in a manner expected to increase neuronal synchrony and excitability to produce seizures. However, developmental changes in M1 GABA(A)Rs do not explain the worsened phenotype at P120 in mutant mice.

Keywords: Brain; Confocal microscopy; Electroencephalography; Electrophysiology; Immunofluorescence; Patch-clamp; Western blot.


Figures

Figure 1
Figure 1. Construction and characterization of Hetα1AD mice
A) Schematic of the construction of the Hetα1AD mice. Gabra1 exons are shown in red, selection cassettes (Neo = neomycin, TK = thymidine kinase) are green, and loxP sequences are blue triangles. The BAC targeting vector (top) shows the position of the A322D substitution (dotted line in exon 9). The targeting vector was introduced into the Gabra1 chromosome by homologous recombination and successful incorporations were selected by G418 / ganciclovir treatment. The neomycin cassette was removed by Cre-lox recombination leaving a single loxP sequence. B) Agarose gel of genotyping PCR products showing 324 bp (wild type allele) and 407 bp (mutant allele) products in Hetα1AD (Het) mice and only 324 bp products in wild type (WT) mice. C-D) Western blots of cortical protein from P15 mice show that compared with wild type mice, Hetα1AD mice express 52 ± 7% (P = 0.001) and Homα1AD mice express 6 ± 3% (P < 0.001 vs WT and Hetα1KO) the amount of α1 subunit protein. ** = P < 0.01, *** = P < 0.001
Figure 2
Figure 2. Spontaneous SWDs in Hetα1KO and Hetα1AD mice at P35 and P120
Sample SWDs from Hetα1KO (KO, A, C) and Hetα1AD mice (AD, B, D). When depicted on an expanded time scale (C, D), the SWDs from both mutant genotypes of mice exhibit the typical rodent SWD morphology with rhythmic spikes (S), positive transients (Pt), and waves (W). Two factor ANOVA revealed no interaction between genotype with age on SWD incidence (P = 0.857). However, there was a significant effect of genotype (E) on SWD incidence with a significantly higher SWD incidence in Hetα1KO mice (10.5 ± 2.4 SWD/hr, N = 18, P = 0.012) and Hetα1AD mice (15.8 ± 2.6 SWD/hr, N = 24, P < 0.001) compared with wild type mice (WT, 1.1 ± 0.3 SWD/hr, N = 20). There was no significant difference in SWD incidence between Hetα1KO and Hetα1AD mice (P = 0.189). There was also no effect of age on SWD incidence with 10.0 ± 2.2 SWD/hr, in P35 mice (N = 30) and 9.1 ± 1.9 SWD/hr in P120 mice (P = 0.628, N = 32). ns = nonsignificant, * = P < 0.05, *** = P < 0.001
Figure 3
Figure 3. Spontaneous PSDs in Hetα1KO and Hetα1AD mice at P35 and P120
Sample PSDs from Hetα1KO (KO, A, C) and Hetα1AD mice (AD, B, D) show waveforms that differ in morphology and duration from the SWDs (Fig 2). Depiction on an expanded time scale (C, D) reveals that the PSDs are composed of multiple, high frequency, irregular spikes (S) positive transients (Pt), and waves (W). The multiple spikes and waves during the PSDs resulted in an increased high frequency (15-30 Hz) spectral density in PSDs relative to SWDs (G, N = 50 SWDs and N = 49 PSDs). Quantification of PSD incidence (E) shows that, compared with wild type (WT, 0.3 ± 0.2 PSD/day, N = 22), there were more frequent PSDs in Hetα1KO mice (2.1 ± 0.6 PSD/day, P = 0.020, N = 18) and Hetα1AD mice (1.9 ± 0.47 PSD/day, P = 0.016, N = 27). In addition, there were more frequent PSDs at P120 (2.4 ± 0.47 PSD/day, P = 0.001, N =33) than P35 (0.56 ± 0.19 PSD/day, N = 34). There was no significant difference between Hetα1KO and Hetα1AD PSD incidence and no interaction between genotype and age. For each P120 mouse, the SWD incidence is plotted against the PSD incidence in F; there is no substantial correlation between SWDs and PSDs (WT, circles, solid line, r2 =0.20, Hetα1KO, squares, dashed line, r2 =0.24, Hetα1AD triangles, dotted line, r2 = 0.24). ns = nonsignificant , * = P < 0.05, ** = P < 0.01
Figure 4
Figure 4. PTZ-evoked PSDs and GTCs in Hetα1KO and Hetα1AD mice at P35 and P120
PTZ-evoked PSDs from Hetα1KO (KO, A, C) and Hetα1AD mice (AD, B, D) show a similar morphology to spontaneous PSDs (Fig 3). Depiction on an expanded time scale (C, D) reveals that the PTZ-evoked PSDs are composed of irregular spikes (S) positive transients (Pt), and waves (W). There is no significant difference (E, P ≥ 0.103) in PTZ-evoked PSD among wild type (1.51 ± 0.61 PSD/hr, N = 9), Hetα1KO (6.95 ± 3.14 PSD/hr, N = 10), and Hetα1AD (2.64 ± 0.79 PSD/hr, N = 13). The P120 mice had a significantly higher PSD frequency (6.3 ± 1.8 PSD/hr, N = 17, P = 0.006) than P35 mice (0.69 ± 0.26 PSD/hr, N = 15). Genotype did alter the PSD latency relative to the time from first PTZ injection (F) with Hetα1KO mice (dashed line) and Hetα1AD mice (dotted line) having shorter PSD latencies than wild type mice (solid line, P < 0.001). G) The probability of a PTZ-evoked GTC was greater in P120 mice (0.588, P = 0.002) was greater than in P35 mice (0.067), but there was no significant effect of genotype on PTZ-evoked GTCs. ns = nonsignificant, ** = P < 0.01
Figure 5
Figure 5. Effects of Gabra1 disruption and development on GABAAR subunit expression
Western blots of frontal cortex protein depict the effects of age and genotype on GABAAR subunit protein expression. For each subunit, the P35 and P120 samples are taken from the same gel and are presented with the same brightness and contrast settings; they are shown with a separation because these samples were not run on adjacent lanes of the same gel. Sample size (N) is nine gels for β2/3, γ2, and α3 subunits and eight gels for α1 subunit; all are from three mice of each age and genotype. There was no effect of genotype on β2/3 subunit expression (A, Hetα1KO 104 ± 9.4%, Hetα1AD 107 ± 6.0%, P ≥ 0.677) or γ2 subunit expression (B, Hetα1KO 109 ± 8.0%, Hetα1AD 110 ± 7.8%, P ≥ 0.585), but, at P120, there was reduced expression of β2/3 subunit (A, 75 ± 5.9%, P < 0.001) and γ2 subunit (B, 74 ± 5.0%, P < 0.001). There was a significant interaction between age and genotype in α1 subunit expression (C, P = 0.001). At P35, there was reduced α1 subunit expression in Hetα1KO (77 ± 9%, #P = 0.077) and Hetα1AD (67 ± 8%, P = 0.002), although the reduction in Hetα1KO mice was not statistically significant. At P120, wild type cortex had reduced α1 subunit protein expression (48 ± 8%, P < 0.001) than P35 wild type mice. Similarly, compared with P35 wild type mice, there was reduced α1 subunit expression in P120 Hetα1KO (56 ± 6%, P < 0.001) and Hetα1AD (61± 9%, P = 0.007) cortex. However, at P120, there was no difference in α1 subunit expression among wild type, Hetα1KO, and Hetα1AD cortex (ns, P ≥ 0.463). For α3 subunit expression (D), both Hetα1KO (243 ± 42%, P < 0.001) and Hetα1AD (223 ± 44%, P < 0.001) had increased α3 subunit expression; there was no difference in α3 subunit expression between Hetα1KO and Hetα1AD cortex (P = 0.992). There was reduced α3 subunit protein expression at P120 (68 ± 6%, P = 0.002). ns = nonsignificant, ** = P < 0.01, *** = P < 0.001.
Figure 6
Figure 6. The effects of Gabra1 disruption and age on the association of α1 subunit with gephyrin clusters in layer II/III motor cortex
Confocal microscopic images show P35 (A, C, E) and P120 (B, D, F) wild type (WT, A, B), Hetα1KO (KO, C, D), and Hetα1AD (AD, E,F) layer II/III motor cortices stained with antibodies directed to α1 subunit (red), and gephyrin (green). The field of view enclosed in the yellow boxes is shown on an expanded scale next to each image. The arrowheads show full or partial overlap (yellow) between gephyrin and the α1 subunit. G) Box plots depict the α1 synaptic cluster ratios with the box length extending from the 25th to 75th percentile and the whiskers extending from the 5th to 95th percentile. The median is marked by the horizontal line. There was no significant difference in synaptic cluster ratio among wild type (median 4.2, 1st-3rd quartile 3.6 – 5.0, N = 14), Hetα1KO (median 4.5, 1st-3rd quartile 3.7 – 5.3, N = 14), and Hetα1AD (median 4.1, 1st-3rd quartile 3.3 – 5.6, N = 14). The synaptic cluster ratio was reduced at P120 (median 3.9, 1st-3rd quartile 3.4 – 4.7, N = 24) relative to P35 (median 5.2, 1st-3rd quartile 4.0 – 5.6, N = 19), although this difference was not statistically significant (#P = 0.053) Scale bars = 3 μm. ns = nonsignificant.
Figure 7
Figure 7. The effects of Gabra1 disruption and age on the association of α3 subunit with gephyrin clusters in layer II/III motor cortex
Confocal microscopic images of P35 (A, C, E) and P120 (B, D, F) wild type (WT, A, B), Hetα1KO (KO, C, D), and Hetα1AD (AD, E, F) layer II/III motor cortices stained with antibodies directed to α3 subunit (red), and gephyrin (green). The field of view enclosed in the yellow boxes is shown on an expanded scale next to each image. The arrowheads show full or partial overlap (yellow) between gephyrin and the α3 subunit. G) Box plots depict the α3 synaptic cluster ratios with the box length extending from the 25th to 75th percentile and the whiskers extending from the 5th to 95th percentile. The median is marked by the horizontal line. There was no significant difference (P ≥ 0.095) in synaptic cluster ratio among wild type (median 3.7, 1st-3rd quartile: 3.2-4.4, N = 14), Hetα1KO (median 4.4, 1st-3rd quartile: 3.7-5.2, N = 14), or Hetα1AD (median 4.2, 1st-3rd quartile: 3.3-4.5, N = 14). The synaptic cluster ratio was significantly reduced (P = 0.015) at P120 (median 3.7, 1st-3rd quartile: 3.1-4.3, N = 24) relative to P35 (median 4.4, 1st-3rd quartile: 3.7-5.8, N = 19), Scale bars = 3 μm. ns = nonsignificant, * = P < 0.05.
Figure 8
Figure 8. mIPSC peak amplitudes and current kinetic timecourse are altered in Hetα1KO and Hetα1AD cortex
A) Sample mIPSC traces obtained from P35 (left) and P120 (right) wild type, Hetα1KO, and Hetα1AD layer II/III pyramidal neurons in the motor cortex. B) Compared to wild type (−31.9 ± 3.0 pA), the magnitude of peak mIPSC amplitude was decreased in Hetα1KO (−23.8 ± 2.1pA, P = 0.037) and Hetα1AD cortex (−16.3 ± 1.3 pA, P < 0.001). The difference in mIPSC amplitude between Hetα1KO and Hetα1AD was statistically significant (P = 0.034). The magnitude of mIPSC peak current amplitudes increased from P35 (−21.0 ± 1.6 pA) to P120 (−26.5 ± 2.4 pA, P = 0.030) without any significant interaction between genotype and age. C) The mIPSC 10-90% rise times were greater in Hetα1KO (2.0 ± 0.2 ms, P = 0.010 vs. wild type), and Hetα1AD (3.1 ± 0.8 ms, P < 0.001 vs. wild type) than wild type neurons (1.3 ± 0.1 ms). The differences in rise times between Hetα1KO and Hetα1AD neurons (P = 0.677) and P35 (2.0 ± 0.2 ms) and P120 (1.7 ± 0.1 ms, # P = 0.079) mIPSCs were not statistically significant. D) Compared with wild type neurons (7.9 ± 0.8 ms), the decay τ, was increased in Hetα1KO (12.6 ± 1.1 ms, P = 0.021) and Hetα1AD (13.1 ± 1.4 ms, P = 0.007).There was no significant difference between the values of decay τ at P35 (11.7 ± 1.1 ms) and P120 (10.8 ± 1.0 ms, P = 0.492). Sample sizes (neurons recorded) were N = 18 wild type, 18 Hetα1KO, 19 Hetα1AD, 26 P35, and 29 P120. * = P < 0.05, ** = P < 0.01, *** = P < 0.001, ns = nonsignificant.

References

    1. Akman O, Demiralp T, Ates N, Onat FY. Electroencephalographic differences between WAG/Rij and GAERS rat models of absence epilepsy. Epilepsy Res. 2010;89:185–193. - PubMed
    1. Arain FM, Boyd KL, Gallagher MJ. Decreased viability and absence-like epilepsy in mice lacking or deficient in the GABAA receptor alpha1 subunit. Epilepsia. 2012;53:e161–e165. - PMC - PubMed
    1. Badawy RA, Vogrin SJ, Lai A, Cook MJ. Patterns of cortical hyperexcitability in adolescent/adult-onset generalized epilepsies. Epilepsia. 2013;54:871–878. - PubMed
    1. Bartolini E, Pesaresi I, Fabbri S, Cecchi P, Giorgi FS, Sartucci F, et al. Abnormal response to photic stimulation in Juvenile Myoclonic Epilepsy: An EEG-fMRI study. Epilepsia. 2014 - PubMed
    1. Benarroch EE. GABAA receptor heterogeneity, function, and implications for epilepsy. Neurology. 2007;68:612–614. - PubMed

Publication types

MeSH terms

Substances