. 2016 Feb;27(2):509-19.
doi: 10.1681/ASN.2014121208. Epub 2015 Jun 8.

CKD Stimulates Muscle Protein Loss Via Rho-associated Protein Kinase 1 Activation

Affiliations

CKD Stimulates Muscle Protein Loss Via Rho-associated Protein Kinase 1 Activation

Hui Peng et al. J Am Soc Nephrol. 2016 Feb.

Abstract

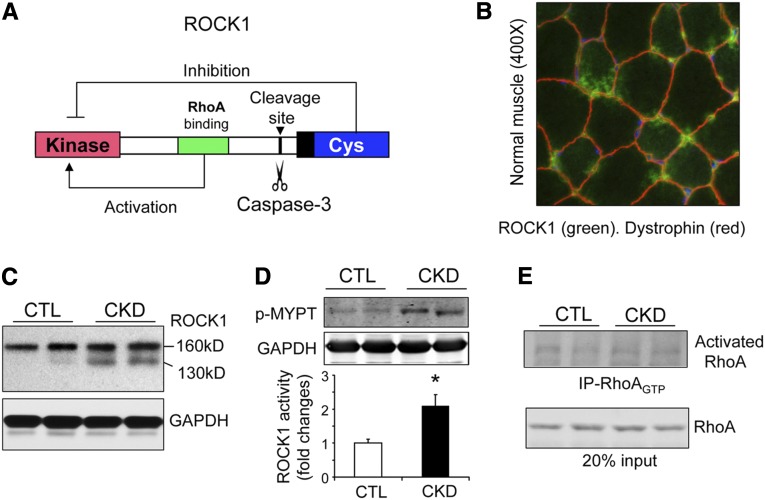
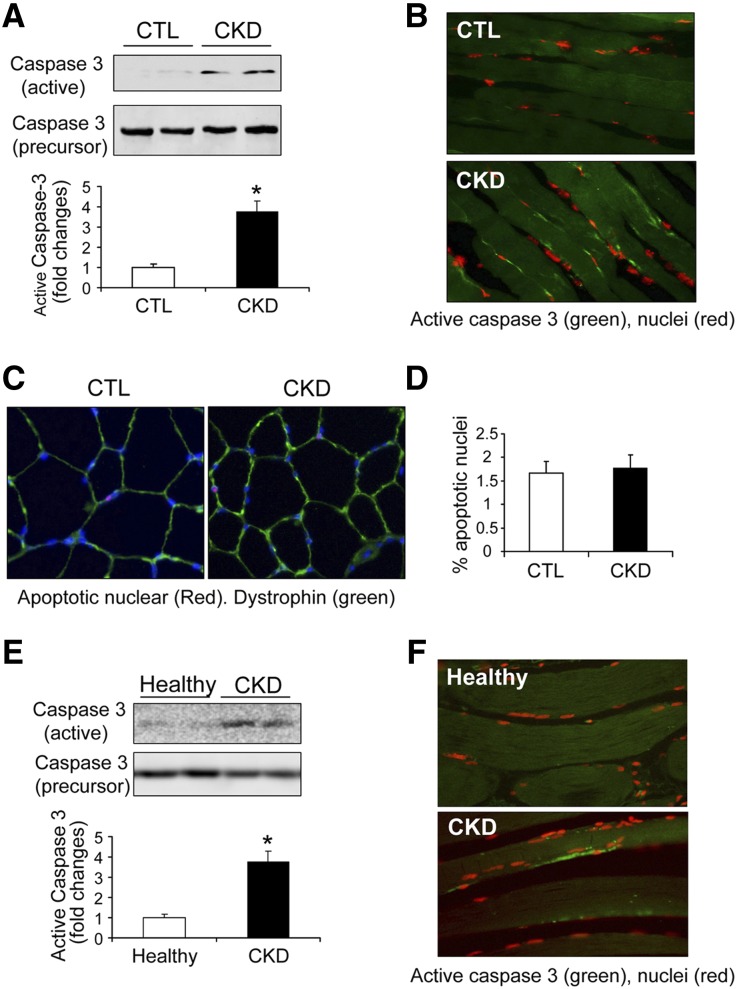
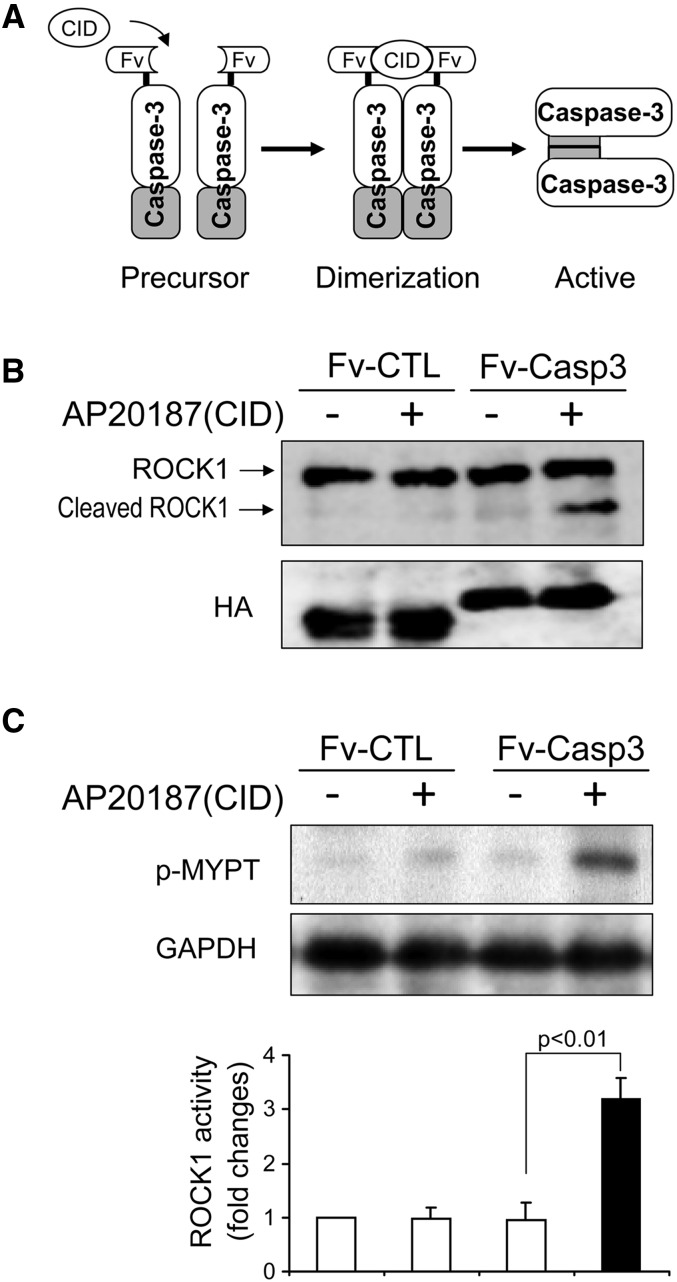
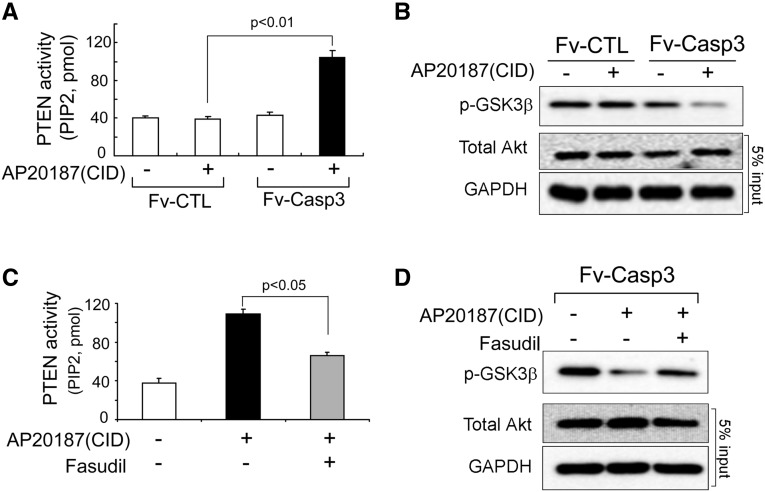
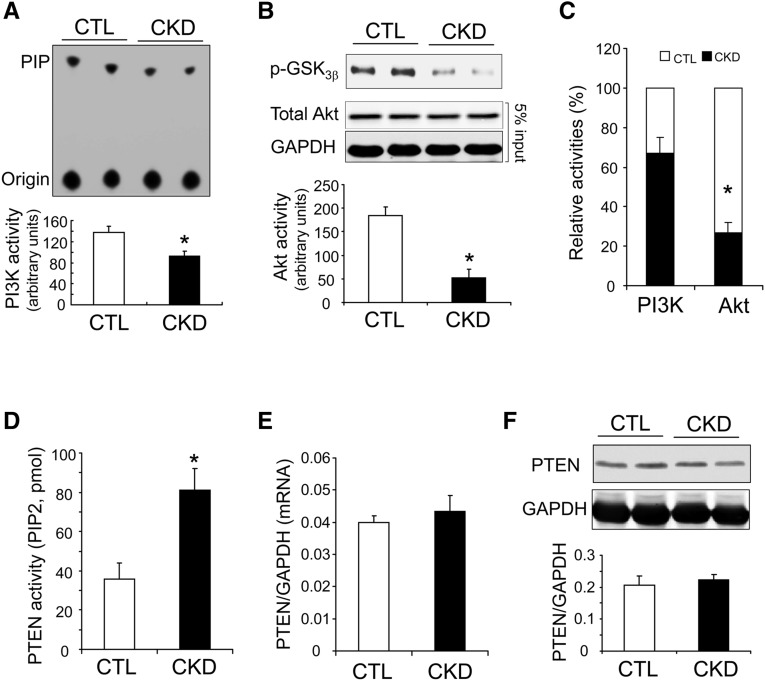
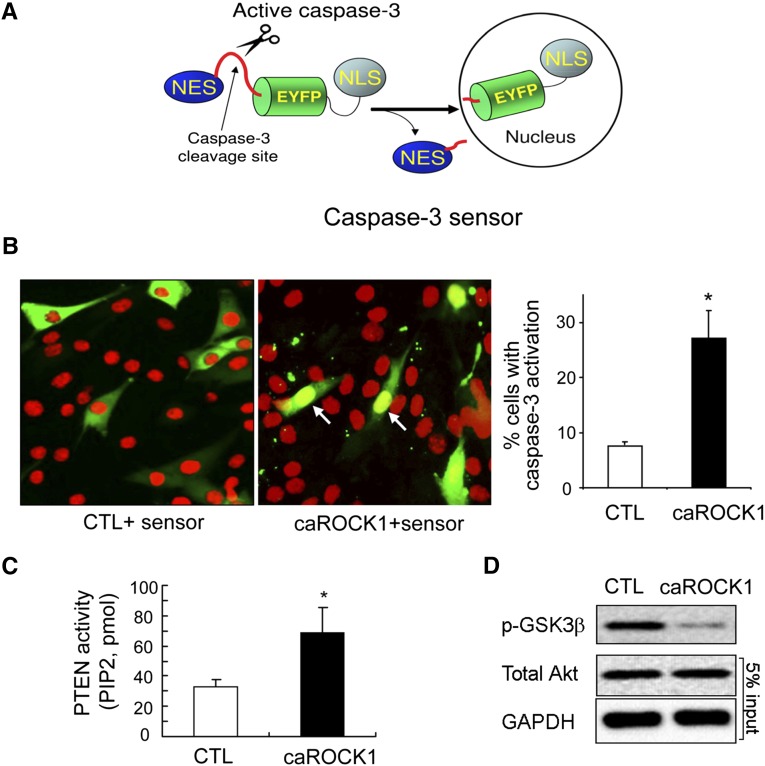
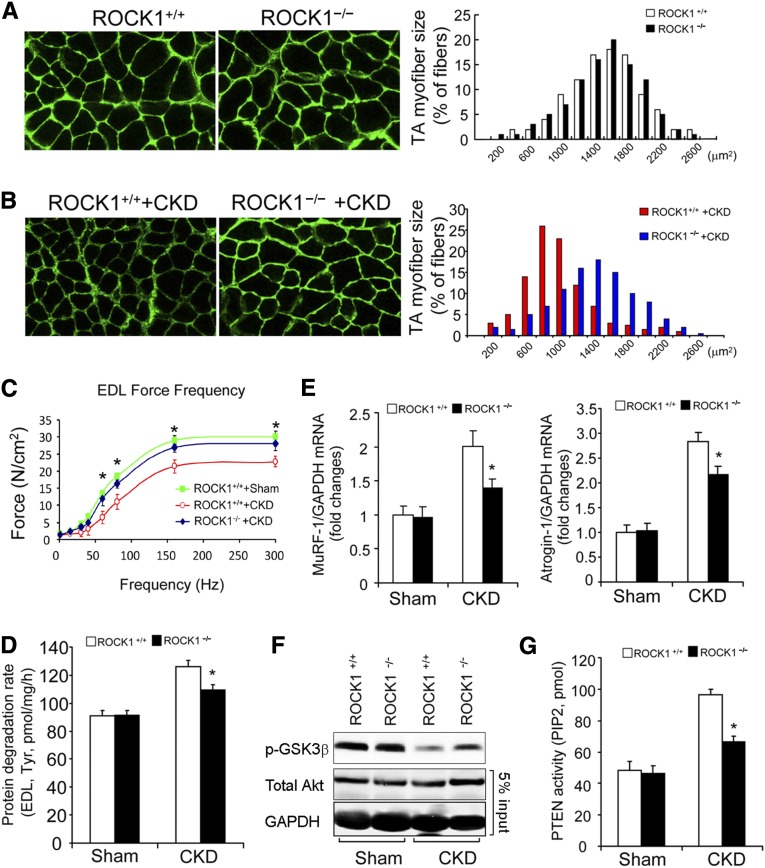
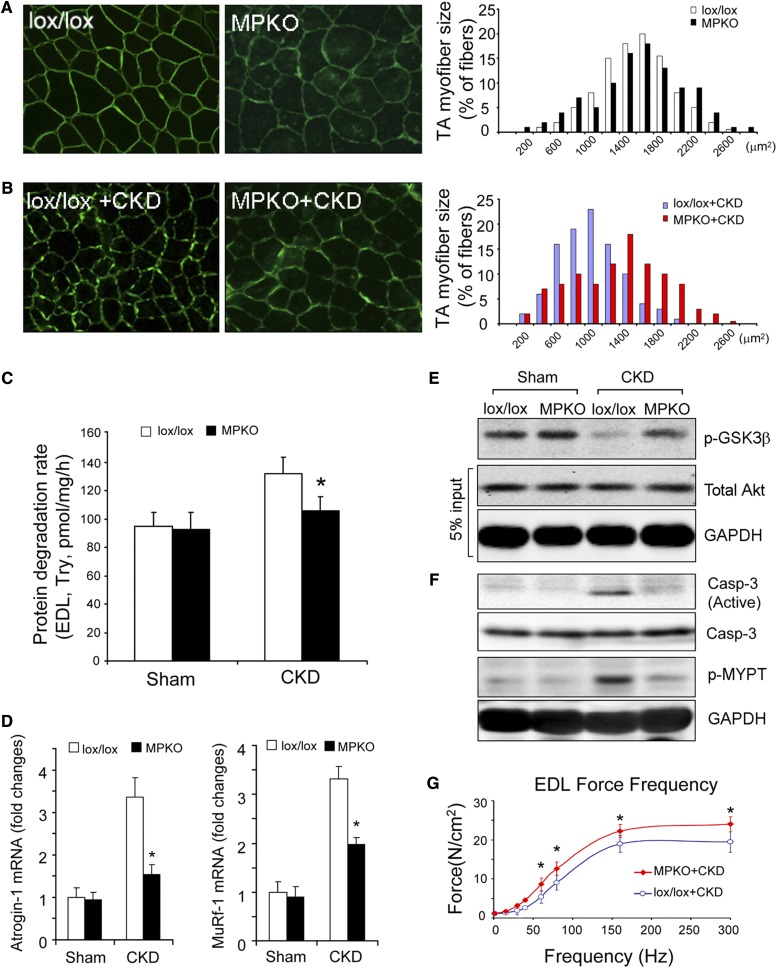
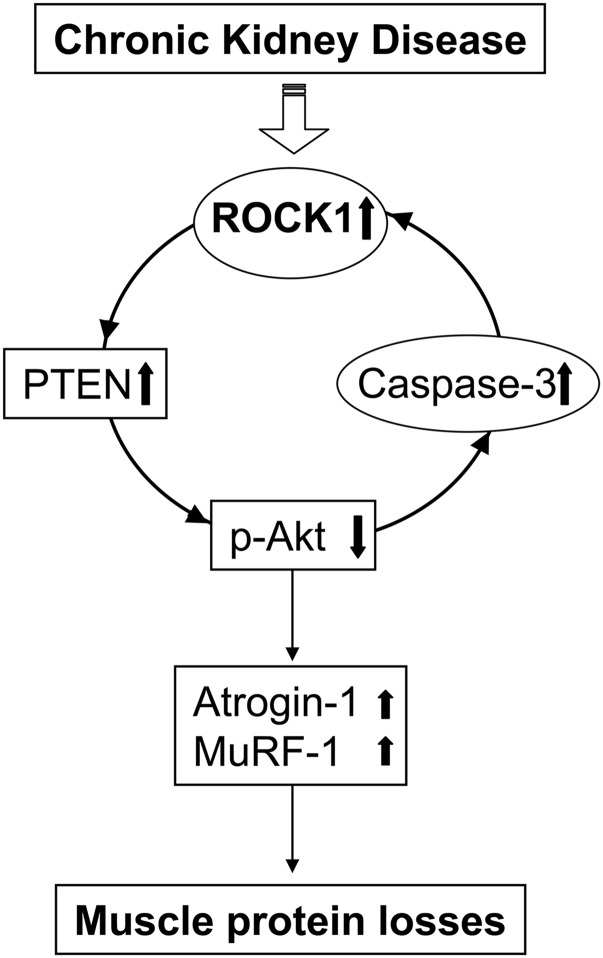
In patients with CKD, muscle wasting is common and is associated with morbidity and mortality. Mechanisms leading to loss of muscle proteins include insulin resistance, which suppresses Akt activity and thus stimulates protein degradation via the ubiquitin-proteasome system. However, the specific factors controlling CKD-induced suppression of Akt activity in muscle remain undefined. In mice with CKD, the reduction in Akt activity in muscle exceeded the decrease in upstream insulin receptor substrate-1-associated phosphatidylinositol 3-kinase activity, suggesting that CKD activates other pathways that suppress Akt. Furthermore, a CKD-induced increase uncovered caspase-3 activity in muscle in these mice. In C2C12 muscle cells, activated caspase-3 cleaves and activates Rho-associated protein kinase 1 (ROCK1), which enhances the activity of phosphatase and tensin homolog (PTEN) and reduces Akt activity. Notably, constitutive activation of ROCK1 also led to increased caspase-3 activity in vitro. In mice with either global ROCK1 knockout or muscle-specific PTEN knockout, CKD-associated muscle proteolysis was blunted. These results suggest ROCK1 activation in CKD and perhaps in other catabolic conditions can promote loss of muscle protein via a negative feedback loop.

Keywords: cell signaling; chronic kidney disease; metabolism.


Figures

Figure 1.
Figure 1.
ROCK1 is activated in muscles of mice with CKD. (A) A structural diagram of ROCK1. When RhoA is bound to the Rho domain (green), it activates ROCK1. Alternatively, caspase-3 can remove the inhibitory Cys domain (blue) to activate ROCK1 constitutively. (B) Immunofluorescent staining of ROCK1 in myofibers of a normal mouse. Original magnification ×400. (C) ROCK1 protein levels were assessed by western blots in skeletal muscles of control (CTL) and CKD mice. Note the 130-kD fragment of cleaved ROCK1 is present in muscle of CKD mice. (D) ROCK1 activity assay revealed that the phosphorylation of MYPT (p-MYPT) increased in muscles of CKD mice (*P<0.01; n=5). (E) RhoA activity assay demonstrated that CKD does not activate RhoA in muscle.
Figure 2.
Figure 2.
CKD activates caspase-3 in skeletal muscles. (A) Representative western blots of active caspase-3 (19 kD) and caspase-3 precursor (32 kD) in muscles from control (CTL) and CKD mice. CKD increases active caspase-3 by 3.7-fold (*P<0.01; n=5). (B) Immunofluorescent staining of active caspase-3 (green) in muscles of CTL and CKD mice. Nuclei were visualized with propidium iodide (red). (C) and (D) TUNEL assay of myofibers of CTL and CKD mice. Apoptotic nuclei (arrow) were rarely seen in muscles of CTL and CKD mice. Blue represents DAPI, and green represents dystrophin staining. Apoptotic nuclei were not significantly increased in muscles of mice with CKD versus CTL results (n=5). (E) Representative western blots of active caspase-3 and caspase-3 precursor in human muscle samples. The active caspase-3 was significantly increased in muscles of patients with CKD (*P<0.05; n=3–5). (F) Immunofluorescent staining of active caspase-3 (green) in muscles of healthy patients and patients with CKD. Red staining (propidium iodide) indicates nuclei.
Figure 3.
Figure 3.
Caspase-3 activation leads to increased activity of ROCK1. (A) Diagram of a chemical inducible activation caspase-3 (M-Fv-Casp 3). A plasmid expressing a caspase-3 precursor protein fused to a chemically inducible dimerization (CID) domain. The chemical, AP20187, can induce caspase-3 precursors to form a dimmer becoming active caspase-3. Plasmids with deletion caspase-3 precursor deletion (M-Fv-CTL) serve as control (CTL). Both plasmids contain a hemagglutinin tag (HA tag). (B) Addition of AP20187 (CID) triggers an activation of caspase-3, which cleaves ROCK1 to yield an active, 130-kD ROCK1 in C2C12 myoblasts. Western blot of HA tag indicates equal transfection in each group. (C) ROCK1 activity was evaluated by the level of phosphorylated MYPT (p-MYPT) (n=3).
Figure 4.
Figure 4.
In C2C12 cells, ROCK1 activates PTEN, which impairs Akt activity. (A) PTEN activity assay indicates that caspase-3 activation stimulates PTEN activity (mean±SEM, n=3). (B) Akt activity was measured by the level of phosphorylated GSK3β from cells with or without caspase-3 activation. (C) Increased PTEN activity stimulated by caspase-3 is blunted by the ROCK1 inhibitor (fasudil) (mean±SEM, n=3). (D) Western blot reveals Akt activity is higher after ROCK1 inhibitor was added despite activation of caspase-3.
Figure 5.
Figure 5.
CKD stimulates PTEN activity, which contributes to the suppression of Akt in muscles of mice with CKD. (A) In muscles of CKD mice, IRS-1–associated PI3K activity is significantly decreased (*P<0.05; versus controls, n=5). (B) Akt activity assay revealed that CKD suppresses Akt activity in mouse muscles (*P<0.01; versus controls, n=5). (C) CKD suppresses Akt activity more than it lowers IRS-1–associated PI3K activity (*P<0.01 versus controls; n=5). (D) PTEN activity assay indicates that CKD stimulates PTEN activity in muscles (*P<0.05, versus controls, n=5). (E) PTEN mRNA levels (quantitative RT-PCR). (F) PTEN protein level. (F) PTEN protein levels (western blot) were comparable in muscles of CTL mice and mice with CKD (n=5).
Figure 6.
Figure 6.
Constitutively active ROCK1 (caROCK1) activates caspase-3 and impairs Akt phosphorylation in C2C12 cells. (A) Structural diagram of the caspase-3 sensor, which was used to detect cytosol caspase-3 activation. EYFP was fused with a nuclear export signal (NES) at its N-terminus and a nuclear localization signal (NLS) at the C-terminus. A caspase-3–specific cleavage site was inserted between NES and EYFP. When caspase-3 is activated, it removes NES from EYFP, and the NSL drives EYFP translocation into the nucleus. (B) C2C12 cells were cotransfected with plasmids expressing the caspase-3 sensor or a caROCK1. Cotransfection of galactosidase and the caspase-3 sensor severed as control (CTL). With ROCK1 activation, EYFP was accumulated in the nuclei indicating caspase-3 activation occurred in the cytoplasm. The caspase-3 activity was also evaluated by the percentage of transfected cells exhibiting nuclear EYFP; at least 100 transfected cells were counted in each experiment (*P<0.01, mean±SEM, n=3). Green represents EYFP-fusion protein; red represents propidium iodide stain of nuclei. (C) PTEN activity assay showed that caROCK1 induces PTEN activation (*P<0.05, mean±SEM, n=3). (D) Representative western blot showing diminished Akt activity in cells transfected with caROCK1.
Figure 7.
Figure 7.
ROCK1 null suppresses CKD-induced muscle proteolysis. (A) In the TA muscles of sham-operated, ROCK+/+ and ROCK1 KO mice, the myofibers sizes were assessed as a distribution of the myofibers’ CSA (n=3, approximately 300 myofibers were measured in each mouse). (B) Leftward-shift of distribution of the myofibers’ CSA in TA muscles of ROCK+/+ mice with CKD was prevented in ROCK1−/− mice with CKD (n=5, approximately 300 myofibers in muscle of each mouse were examined). (C) CKD impairs the contractile function of EDL muscles of ROCK+/+ mice. The decreased contractile force caused by CKD was improved in ROCK1−/− mice despite CKD (mean±SEM, *P<0.05, ROCK1−/− +CKD versus ROCK1+/+ +CKD; n=3–5 in each group). (D) Rates of protein degradation, assessed by tyrosine release isolated EDL muscle, were significantly suppressed in ROCK1 KO mice with CKD (mean±SEM; n=5–7 in each group; *P<0.05 versus ROCK+/++CKD). (E) The expressions of Atrogin-1/MAFbx and MuRF-1 (quantitative RT-PCR) were significantly suppressed in muscles of ROCK1−/− mice with CKD (mean±SEM, *P<0.01 versus ROCK+/+with CKD, n=5). (F) Phosphorylation of Akt was examined by western blotting. CKD suppressed Akt activity in muscles of ROCK+/+ mice. This response was blunted in muscles of ROCK1−/− mice with CKD. (G) PTEN activities in the absences or presence of CKD were examined in gastrocnemius muscles of ROCK+/+ and ROCK1−/− mice. The absence of ROCK1 reduced PTEN activity stimulated by CKD (mean±SEM; *P<0.01 versus ROCK+/+ mice with CKD; n=5).
Figure 8.
Figure 8.
MPKO prevents CKD-induced muscle wasting. (A) The distribution of the myofibers' CSA in TA muscles of lox/lox (control) or MPKO mice were not different identical (n=3, approximately 300 myofibers in each mouse were measured). (B) There was a rightward shift of the CSA distribution in TA muscles of MPKO mice with CKD versus results in lox/lox mice with CKD (n=5, approximately 300 myofibers in each mouse were examined). (C) Rates of protein degradation in EDL muscles of lox/lox and MPKO mice indicated that deletion of PTEN blocked the increase in muscle proteolysis that is stimulated by CKD (n=5 in each group). (D) The mRNA levels of Atrogin-1/MAFbx and MuRF-1 in TA muscles were examined by quantitative RT-PCR. The increased expressions of Atrogin-1/MAFbx and MuRF-1 in muscles lox/lox mice with CKD were blocked in muscles of MPKO mice with CKD (mean±SEM; *P<0.01 versus lox/lox +CKD, n=5). (E) Akt activities were examined in muscles of lox/lox and MPKO mice with or without CKD. In muscles of MPKO mice with CKD, the Akt activity was higher than that of lox/lox mice with CKD. (F) Levels of active caspase-3 and ROCK1 activities were measured in muscles of lox/lox and MPKO mice with or without CKD. MPKO suppresses caspase-3 and ROCK1 activation in muscles of mice with CKD. (G) Reduced contractile force of the EDL muscle caused by CKD was improved in MPKO mice with CKD (mean±SEM; *P<0.05 versus lox/lox +CKD; n=5 in each group).
Figure 9.
Figure 9.
In muscle of mice with CKD, caspase-3/ROCK1/PTEN forms a negative feedback loop that increases muscle proteolysis. The negative feedback loop consists of activation of caspase-3, which activates ROCK1, leading to stimulation of PTEN activity. The increase in PTEN activity suppresses Akt, which stimulates caspase-3 to form a negative feedback loop.

References

    1. Kalantar-Zadeh K, Cano NJ, Budde K, Chazot C, Kovesdy CP, Mak RH, Mehrotra R, Raj DS, Sehgal AR, Stenvinkel P, Ikizler TA: Diets and enteral supplements for improving outcomes in chronic kidney disease. Nat Rev Nephrol 7: 369–384, 2011 - PMC - PubMed
    1. Kopple JD, Wang H, Casaburi R, Fournier M, Lewis MI, Taylor W, Storer TW: Exercise in maintenance hemodialysis patients induces transcriptional changes in genes favoring anabolic muscle. J Am Soc Nephrol 18: 2975–2986, 2007 - PubMed
    1. Cheung WW, Paik KH, Mak RH: Inflammation and cachexia in chronic kidney disease. Pediatr Nephrol 25: 711–724, 2010 - PubMed
    1. Zheng B, Ohkawa S, Li H, Roberts-Wilson TK, Price SR: FOXO3a mediates signaling crosstalk that coordinates ubiquitin and atrogin-1/MAFbx expression during glucocorticoid-induced skeletal muscle atrophy. FASEB J 24: 2660–2669, 2010 - PMC - PubMed
    1. Sandri M, Sandri C, Gilbert A, Skurk C, Calabria E, Picard A, Walsh K, Schiaffino S, Lecker SH, Goldberg AL: Foxo transcription factors induce the atrophy-related ubiquitin ligase atrogin-1 and cause skeletal muscle atrophy. Cell 117: 399–412, 2004 - PMC - PubMed

Publication types