. 2016 Feb;27(2):482-94.
doi: 10.1681/ASN.2014111107. Epub 2015 Jun 8.

Proximal Tubules Have the Capacity to Regulate Uptake of Albumin

Affiliations

Proximal Tubules Have the Capacity to Regulate Uptake of Albumin

Mark C Wagner et al. J Am Soc Nephrol. 2016 Feb.

Abstract

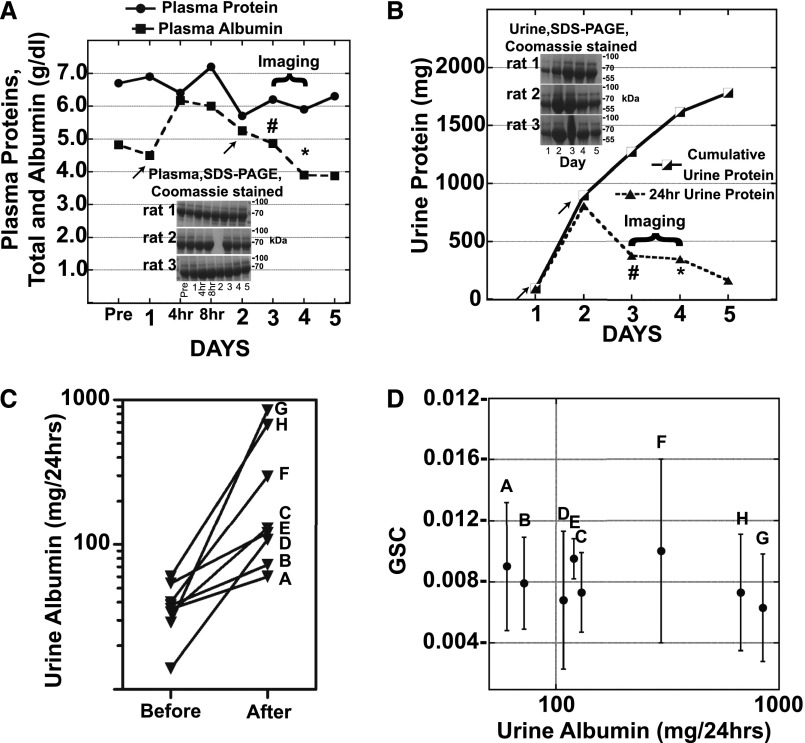
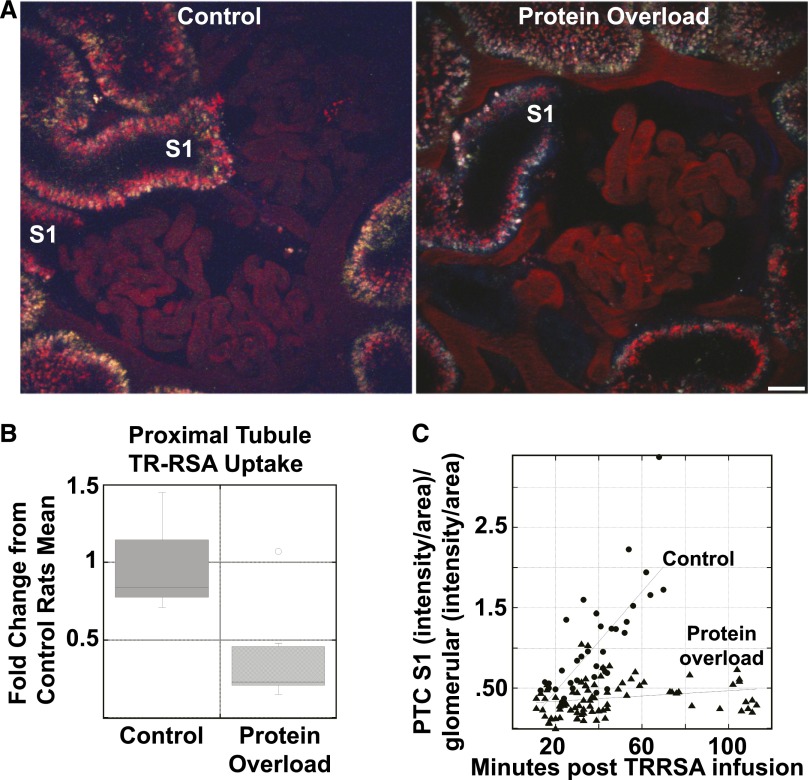
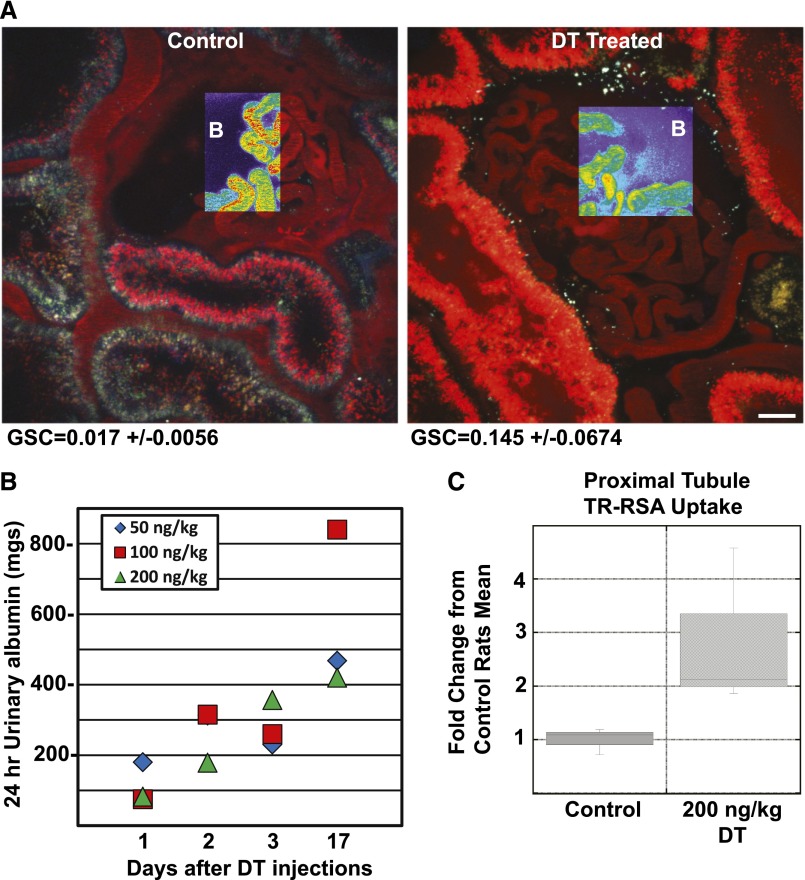
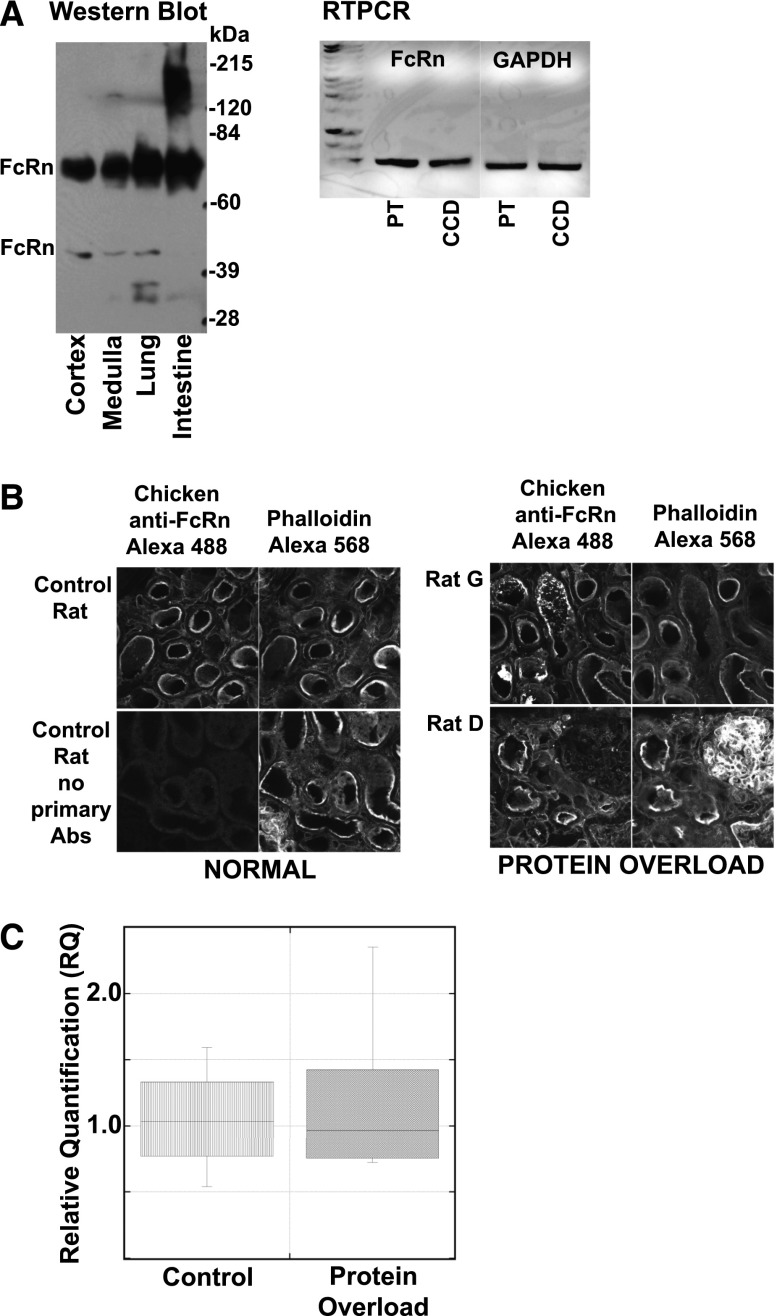
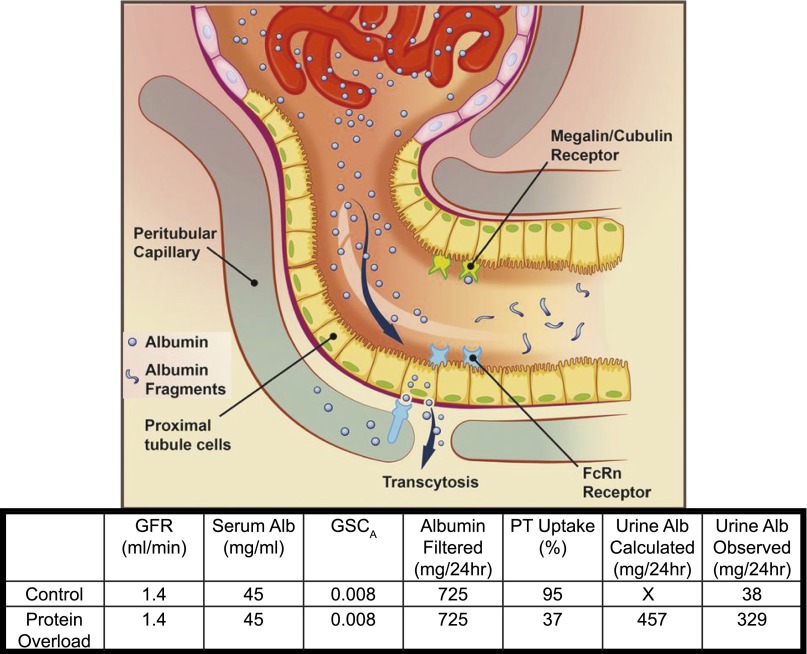
Evidence from multiple studies supports the concept that both glomerular filtration and proximal tubule (PT) reclamation affect urinary albumin excretion rate. To better understand these roles of glomerular filtration and PT uptake, we investigated these processes in two distinct animal models. In a rat model of acute exogenous albumin overload, we quantified glomerular sieving coefficients (GSC) and PT uptake of Texas Red-labeled rat serum albumin using two-photon intravital microscopy. No change in GSC was observed, but a significant decrease in PT albumin uptake was quantified. In a second model, loss of endogenous albumin was induced in rats by podocyte-specific transgenic expression of diphtheria toxin receptor. In these albumin-deficient rats, exposure to diphtheria toxin induced an increase in albumin GSC and albumin filtration, resulting in increased exposure of the PTs to endogenous albumin. In this case, PT albumin reabsorption was markedly increased. Analysis of known albumin receptors and assessment of cortical protein expression in the albumin overload model, conducted to identify potential proteins and pathways affected by acute protein overload, revealed changes in the expression levels of calreticulin, disabled homolog 2, NRF2, angiopoietin-2, and proteins involved in ATP synthesis. Taken together, these results suggest that a regulated PT cell albumin uptake system can respond rapidly to different physiologic conditions to minimize alterations in serum albumin level.

Keywords: albuminuria; glomerular disease; glomerulus; renal proximal tubule cell; tubular epithelium.


Figures

Figure 1.
Figure 1.
Acute albumin overload increases urine albumin but does not result in GSC increases. (A) Plasma SDS-PAGE Coomassie stained gels and the average (n=3, no plasma for rat 2 day 2 gel sample) plasma albumin and total protein in g/dl following two albumin injections (625 mg/100 g/day) on days 1 and 2 (arrows). Rats were evaluated by two-photon microscopy on days 3 or 4, 24 hours (#) or 48 hours (*) after the second injection. Note the rapid increase and return to baseline of serum albumin levels in this model. (B) Daily and cumulative 24 hour urine protein and Coomassie gels are shown. Blood was collected pre- and post-albumin injections and creatinine measured using the Jaffe method with the Pointe 180 QT Analyzer. Urine creatinine was measured and GFR calculated [UCR×UVOL (ml/min)/PCR]. GFR was unaffected by albumin injections. (C) 24 hour total urine albumin is presented for the eight MWF female rats before albumin injections and on the day of imaging after either 24 hours (F–H) or 48 hours (A–E) following the second injection. (D) A scatter plot is presented of the albumin GSC±SD and the 24 hour total urine albumin on the day of imaging. GSC was determined using two-photon microscopy as described earlier. Note the lack of correlation between GSC and urine albumin values.
Figure 2.
Figure 2.
Acute albumin overload results in decreased PT uptake. (A) An intravital microscopy single time point image showing TR-RSA fluorescence in the S1 region of a control and protein overload animal, 20–30 min after TR-RSA infusion. Note the reduced uptake in the protein overload animal. Bar, 20 μm. (B) Box plot showing the quantification of TR-RSA uptake in all surface PTs of control (n=3 rats, 157 fields quantified) and protein overloaded (n=8 rats, 176 fields quantified) rats. This analysis showed a significant reduction in albumin uptake, P<0.01 (KaleidaGraph, Student’s t-test). (C) Quantification of the TR-RSA uptake in only S1 PTC identified reduced uptake in the protein overload animals. Each data point represents an individual measurement from control (n=36 from three rats) or protein overload (n=83 from seven rats) S1 PT. The differences in the slopes of these lines was found to be significant, P<0.001, GraphPad Prism.
Figure 3.
Figure 3.
Damage to podocytes increases albuminuria and results in increased PT albumin uptake. (A) An intravital microscopy single time point image showing TR-RSA fluorescence in the glomerulus and adjacent tubules from a control and DT treated rat (day 5, 200 ng/kg). Note the increased amount of TR-RSA in the tubules following DT treatment. The pseudo-color overlays in a glomerular region clearly show the increase in leakage of the TR-RSA into Bowman’s (B) space in the DT treated rat. This increased leakage correlates with the increased GSA calculated for DT treated rats (GSC=0.145±0.0674, n=3) compared with control untreated rats (GSC=0.017±0.0056, n=3). Bar, 20 μm. (B) DT dose and time response shows a linear increase with 24 hour albuminuria. C. Box plot showing the quantification of TR-RSA uptake in all surface PTs, of control (n=3 rats, 101 fields quantified) and DT treated (n=3 rats, 106 fields quantified) rats. This analysis showed a significant increase in albumin uptake, P=0.05 (Student’s t-test one-tailed equal variance).
Figure 4.
Figure 4.
FcRn location and levels do not correlate with protein overload changes. (A) Western blot of rat tissue (left panel) (kidney cortex, kidney medulla, lung and intestine) with equal amounts of proteins loaded on gel show FcRn is present in both kidney regions. Note, the upper FcRn band corresponds to the mature glycosylated form while the lower band is the immature form., In the right panel, RNA from micro-dissected PT and CCD, kindly provided by Dr. Lisa Satlin, were analyzed using RTPCR for FcRn and GAPDH. This also supports the presence of FcRn in both tubule segments. (B) Immunofluorescent localization of FcRn in control and protein overload (rats G and D) rat kidney cortex. Each section was labeled with the chicken anti FcRn Ab and phalloidin. Sequential laser excitation of each dye prevented any fluorescent crosstalk. Presented images consist of <5 μm z projections showing the same field and planes for both labels. Note that no significant difference was observed following protein overload. (C) FcRn qPCR was performed on RNA isolated from control (n=4) and protein overloaded rats (n=6). Box plot of the RQ results showed no significant difference in expression levels for FcRn, control mean 1.05±0.43 and protein overload mean 1.20±0.63. GAPDH, glyceraldehyde-3-phosphate dehydrogenase; RQ, relative quantification.
Figure 5.
Figure 5.
Mass balance of albumin filtration, PT reabsorption and urinary excretion, 200 g rat. Albumin filtered was calculated by using mean values from this study for GFR, serum albumin and GSC for albumin. Thus calculated 24 hour urinary albumin was determined by the following equation: GFR×1440 minutes×serum albumin (mg/ml)×GSC×(1−%PT uptake). %PT uptake for control was calculated by dividing observed 24 hour albumin by calculated albumin filtered×100. %PT uptake for PO was calculated from mean data in Figure 2B and is very close to observed 24 hour urinary albumin. Note the ability of the PT to down-regulate albumin reabsorption.

Comment in

References

    1. Roscioni SS, Lambers Heerspink HJ, de Zeeuw D: Microalbuminuria: target for renoprotective therapy PRO. Kidney Int 86: 40–49, 2014 - PubMed
    1. Dickson LE, Wagner MC, Sandoval RM, Molitoris BA: The proximal tubule and albuminuria: really! J Am Soc Nephrol 25: 443–453, 2014 - PMC - PubMed
    1. Sandoval RM, Wagner MC, Patel M, Campos-Bilderback SB, Rhodes GJ, Wang E, Wean SE, Clendenon SS, Molitoris BA: Multiple factors influence glomerular albumin permeability in rats. J Am Soc Nephrol 23: 447–457, 2012 - PMC - PubMed
    1. Tenten V, Menzel S, Kunter U, Sicking E-M, van Roeyen CRC, Sanden SK, Kaldenbach M, Boor P, Fuss A, Uhlig S, Lanzmich R, Willemsen B, Dijkman H, Grepl M, Wild K, Kriz W, Smeets B, Floege J, Moeller MJ: Albumin is recycled from the primary urine by tubular transcytosis. J Am Soc Nephrol 24: 1966–1980, 2013 - PMC - PubMed
    1. Birn H, Christensen EI, Nielsen S: Kinetics of endocytosis in renal proximal tubule studied with ruthenium red as membrane marker. Am J Physiol 264: F239–F250, 1993 - PubMed

Publication types