. 2015 Sep;42(10):1562-73.
doi: 10.1007/s00259-015-3087-5. Epub 2015 Jun 9.

The impact of obesity on the relationship between epicardial adipose tissue, left ventricular mass and coronary microvascular function

Affiliations

The impact of obesity on the relationship between epicardial adipose tissue, left ventricular mass and coronary microvascular function

M J Bakkum et al. Eur J Nucl Med Mol Imaging. 2015 Sep.

Abstract

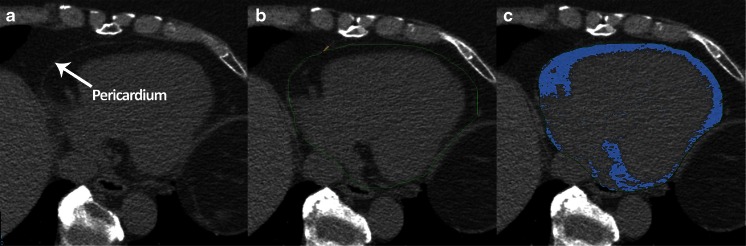
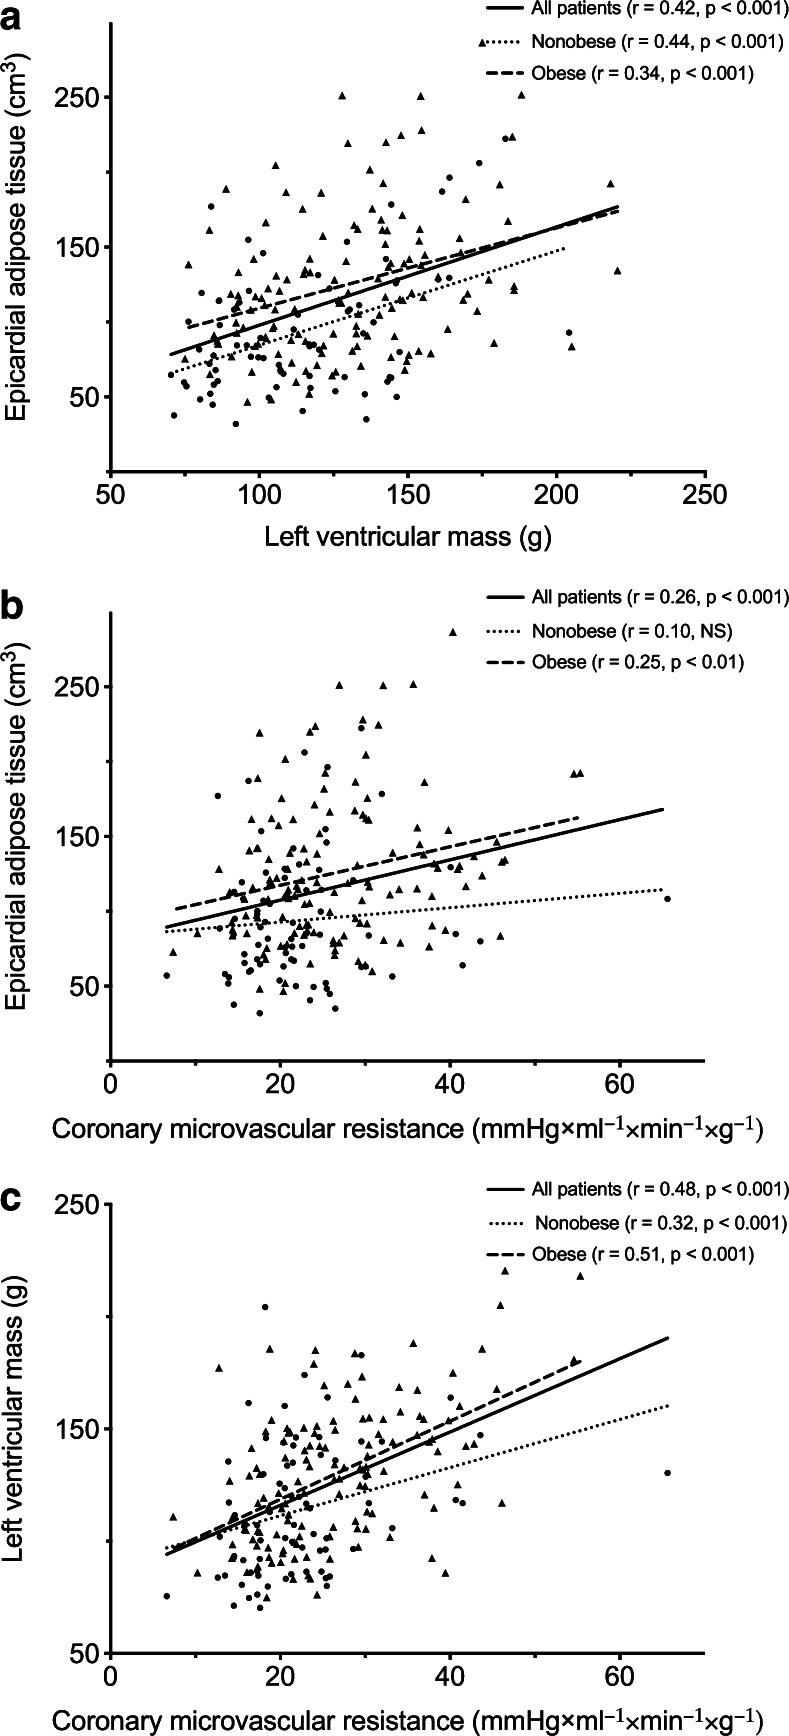
Purpose: Epicardial adipose tissue (EAT) has been linked to coronary artery disease (CAD) and coronary microvascular dysfunction. However, its injurious effect may also impact the underlying myocardium. This study aimed to determine the impact of obesity on the quantitative relationship between left ventricular mass (LVM), EAT and coronary microvascular function.

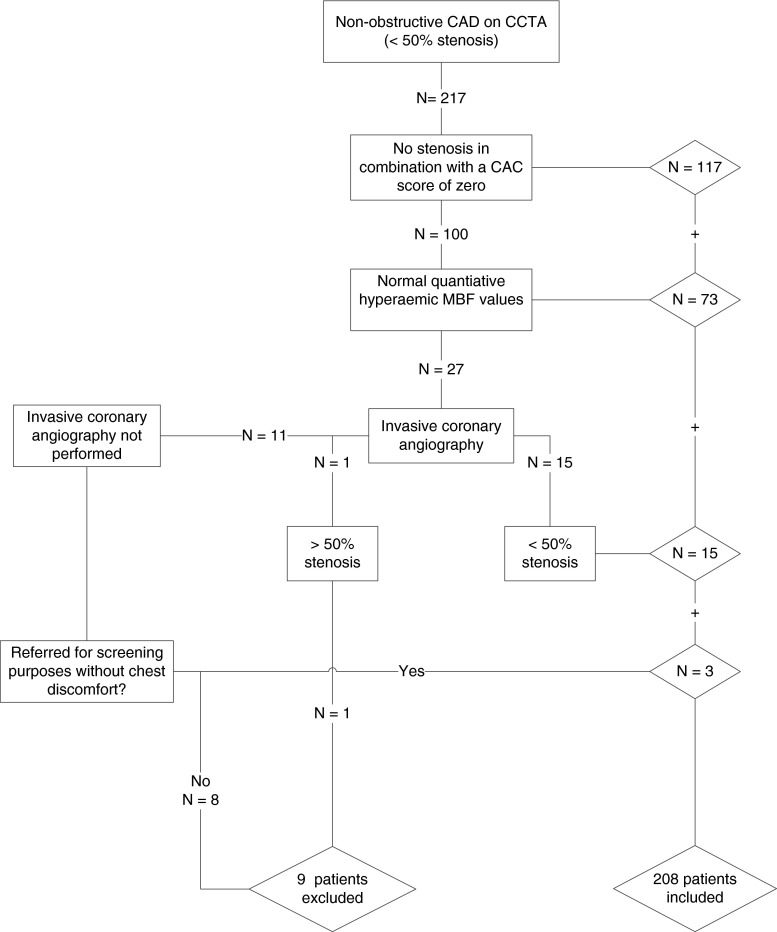
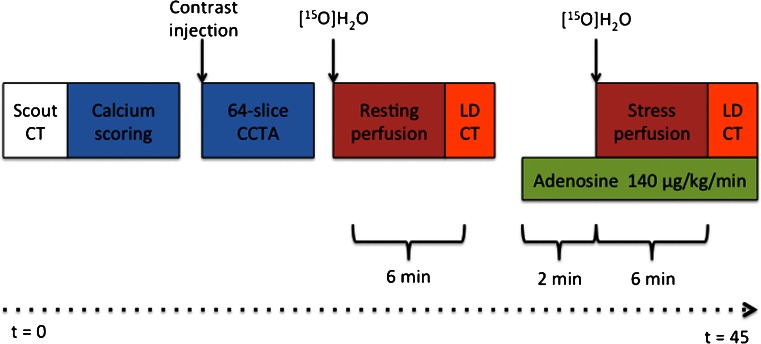
Methods: A total of 208 (94 men, 45 %) patients evaluated for CAD but free of coronary obstructions underwent quantitative [(15)O]H2O hybrid positron emission tomography (PET)/CT imaging. Coronary microvascular resistance (CMVR) was calculated as the ratio of mean arterial pressure to hyperaemic myocardial blood flow.

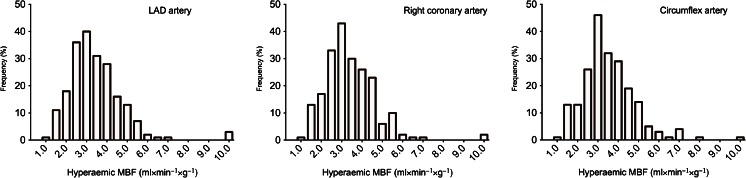
Results: Obese patients [body mass index (BMI) > 25, n = 133, 64 % of total] had more EAT (125.3 ± 47.6 vs 93.5 ± 42.1 cc, p < 0.001), a higher LVM (130.1 ± 30.4 vs 114.2 ± 29.3 g, p < 0.001) and an increased CMVR (26.6 ± 9.1 vs 22.3 ± 8.6 mmHg×ml(-1)×min(-1)×g(-1), p < 0.01) as compared to nonobese patients. Male gender (β = 40.7, p < 0.001), BMI (β = 1.61, p < 0.001), smoking (β = 6.29, p = 0.03) and EAT volume (β = 0.10, p < 0.01) were identified as independent predictors of LVM. When grouped according to BMI status, EAT was only independently associated with LVM in nonobese patients. LVM, hypercholesterolaemia and coronary artery calcium score were independent predictors of CMVR.

Conclusion: EAT volume is associated with LVM independently of BMI and might therefore be a better predictor of cardiovascular risk than BMI. However, EAT volume was not related to coronary microvascular function after adjustments for LVM and traditional risk factors.


Figures

Fig. 1
Fig. 1
Flow diagram of patient inclusion. Steps taken to exclude any obstructive CAD among patients. Patients were included if, in addition to a negative CCTA scan, they exhibited: (1) no calcifications or (2) a normal hyperaemic MBF or (3) a negative invasive coronary angiography or (4) no symptoms. A total of 208 patients were included in the study. CAD coronary artery disease, CCTA coronary computed tomography angiography, CAC coronary artery calcium, MBF myocardial blood flow
Fig. 2
Fig. 2
Hybrid PET/CCTA protocol. After a scout CT for patient positioning a non-contrast (calcium scoring) and contrast-enhanced CT scans were sequentially performed. This was followed by a [15O]H2O PET myocardial perfusion scan in resting conditions and a low-dose CT scan for attenuation correction. A minimum of 10 min after the first dose of [15O]H2O, to allow for radiation decay, an identical PET sequence was commenced for hyperaemic perfusion. Adenosine infusion at 140 μg×kg−1×min−1 was started 2 min before the start of the dynamic PET sequence
Fig. 3
Fig. 3
Example of EAT quantification in one axial slice. The pericardium was identified (a) and traced manually (b). The adipose tissue within the region of interest (indicated in blue) was then automatically quantified and multiplied by the slice thickness (2.5 mm) (c). Summing the EAT of all slices between the pulmonary trunk and lowest slice showing the posterior descending artery gave the total EAT volume. All measurements were performed using Phillips IntelliSpace workstation v5.0 (Philips Healthcare, Best, The Netherlands)
Fig. 4
Fig. 4
Distribution of hyperaemic MBF. Histograms on the distribution of hyperaemic MBF for the left anterior descending (LAD) artery, the right coronary artery and the circumflex coronary artery
Fig. 5
Fig. 5
Correlations between EAT, LVM and CMVR for obese and nonobese patients. a The relation between EAT and LVM. b The relation between EAT and CMVR. c The relation between LVM correlated and CMVR. EAT epicardial adipose tissue, LVM left ventricular mass, CMVR coronary microvascular resistance

References

    1. Levy D, Garrison RJ, Savage DD, Kannel WB, Castelli WP. Prognostic implications of echocardiographically determined left ventricular mass in the Framingham Heart Study. N Engl J Med. 1990;322:1561–1566. doi: 10.1056/NEJM199005313222203. - DOI - PubMed
    1. Friberg P, Allansdotter-Johnsson A, Ambring A, Ahl R, Arheden H, Framme J, et al. Increased left ventricular mass in obese adolescents. Eur Heart J. 2004;25:987–992. doi: 10.1016/j.ehj.2004.03.018. - DOI - PubMed
    1. Turkbey EB, McClelland RL, Kronmal RA, Burke GL, Bild DE, Tracy RP, et al. The impact of obesity on the left ventricle: the Multi-Ethnic Study of Atherosclerosis (MESA) JACC Cardiovasc Imaging. 2010;3:266–274. doi: 10.1016/j.jcmg.2009.10.012. - DOI - PMC - PubMed
    1. Rosito GA, Massaro JM, Hoffmann U, Ruberg FL, Mahabadi AA, Vasan RS, et al. Pericardial fat, visceral abdominal fat, cardiovascular disease risk factors, and vascular calcification in a community-based sample: the Framingham Heart Study. Circulation. 2008;117:605–613. doi: 10.1161/CIRCULATIONAHA.107.743062. - DOI - PubMed
    1. Rabkin SW. Epicardial fat: properties, function and relationship to obesity. Obes Rev. 2007;8:253–261. doi: 10.1111/j.1467-789X.2006.00293.x. - DOI - PubMed

LinkOut - more resources