Review
. 2015 Jul;16(7):409-20.
doi: 10.1038/nrg3950. Epub 2015 Jun 9.

Determinants of the rate of protein sequence evolution

Affiliations
Review

Determinants of the rate of protein sequence evolution

Jianzhi Zhang et al. Nat Rev Genet. 2015 Jul.

Abstract

The rate and mechanism of protein sequence evolution have been central questions in evolutionary biology since the 1960s. Although the rate of protein sequence evolution depends primarily on the level of functional constraint, exactly what determines functional constraint has remained unclear. The increasing availability of genomic data has enabled much needed empirical examinations on the nature of functional constraint. These studies found that the evolutionary rate of a protein is predominantly influenced by its expression level rather than functional importance. A combination of theoretical and empirical analyses has identified multiple mechanisms behind these observations and demonstrated a prominent role in protein evolution of selection against errors in molecular and cellular processes.


Figures

Fig. 1
Fig. 1. The negative correlation between gene expression level and protein evolutionary rate (E-R anticorrelation) exists in all three domains of life
Protein evolutionary rate is measured by the percentage sequence difference between proteins from a focal species and their orthologous proteins from a closely related species. Each gray dot represents one gene and the color (red to light blue) represents density (high to low) of dots such that overplotting is avoided. For each species, the line shows the linear regression whereas ρ is Spearman's rank correlation coefficient. See Supplementary information S2 (box) for the sources of the data used in making the figure.
Fig. 2
Fig. 2. Natural selection against errors in protein translation, folding, and interaction can explain the E-R anticorrelation
The upper part of the figure shows key molecular processes in the production and functioning of proteins and the types of errors generated in these processes. Red stars indicate translational errors. The lower part of the figure shows expected relationships between the expression level of a protein and properties of the protein in relation to the various errors mentioned, providing rationales for the hypotheses that natural selection against molecular errors generates the E-R anticorrelation.
Fig. 3
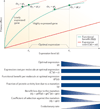
Fig. 3. The expression cost hypothesis of the E-R anticorrelation
Each blue curve represents the benefit of the expression of a gene, whereas the red line shows the cost of expression for each gene. The top half of the figure shows that the benefit and cost of expressing an extra molecule at the optimal expression level are equal. A mutation that reduces protein activity by a fraction q imposes a bigger loss of benefit for the highly expressed gene (dy1) than the lowly expressed gene (dy2). The bottom half of the figure shows the expected relationships between various gene properties and expression level based on the model.

References

    1. Zuckerkandl E, Pauling L. In: Horizons in Biochemistry. Kasha M, Pullman B, editors. New York: Academic Press; 1962. pp. 189–225.
    1. Zuckerkandl E, Pauling L. In: Evolving Genes and Proteins. Bryson V, Vogel HJ, editors. New York: Academic Press; 1965. pp. 97–166. - PubMed
    1. Kimura M. Evolutionary rate at the molecular level. Nature. 1968;217:624–626. - PubMed
    1. Kumar S. Molecular clocks: four decades of evolution. Nat Rev Genet. 2005;6:654–662. - PubMed
    1. Takahata N. Molecular clock: an anti-neo-Darwinian legacy. Genetics. 2007;176:1–6. - PMC - PubMed

Publication types

LinkOut - more resources