. 2016 Jan;127(1):156-168.
doi: 10.1016/j.clinph.2015.04.075. Epub 2015 May 9.

Validation of an automated seizure detection algorithm for term neonates

Affiliations

Validation of an automated seizure detection algorithm for term neonates

Sean R Mathieson et al. Clin Neurophysiol. 2016 Jan.

Abstract

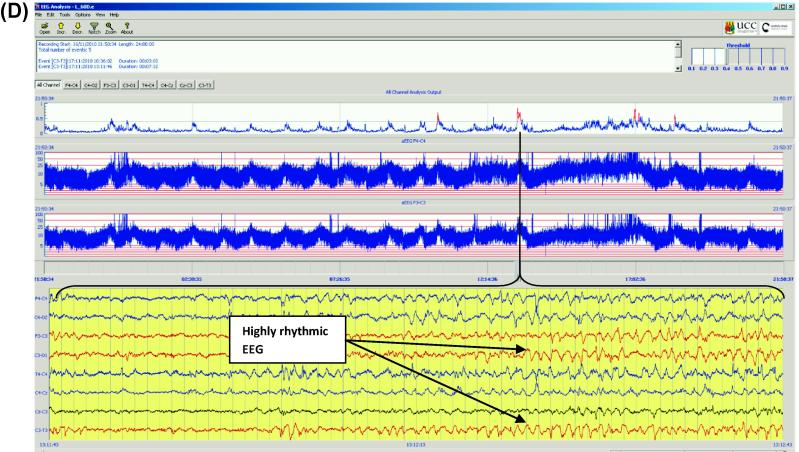
Objective: The objective of this study was to validate the performance of a seizure detection algorithm (SDA) developed by our group, on previously unseen, prolonged, unedited EEG recordings from 70 babies from 2 centres.

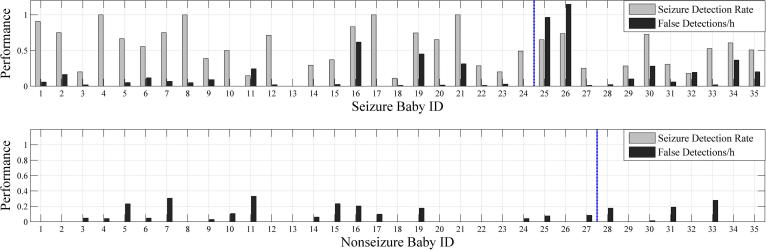
Methods: EEGs of 70 babies (35 seizure, 35 non-seizure) were annotated for seizures by experts as the gold standard. The SDA was tested on the EEGs at a range of sensitivity settings. Annotations from the expert and SDA were compared using event and epoch based metrics. The effect of seizure duration on SDA performance was also analysed.

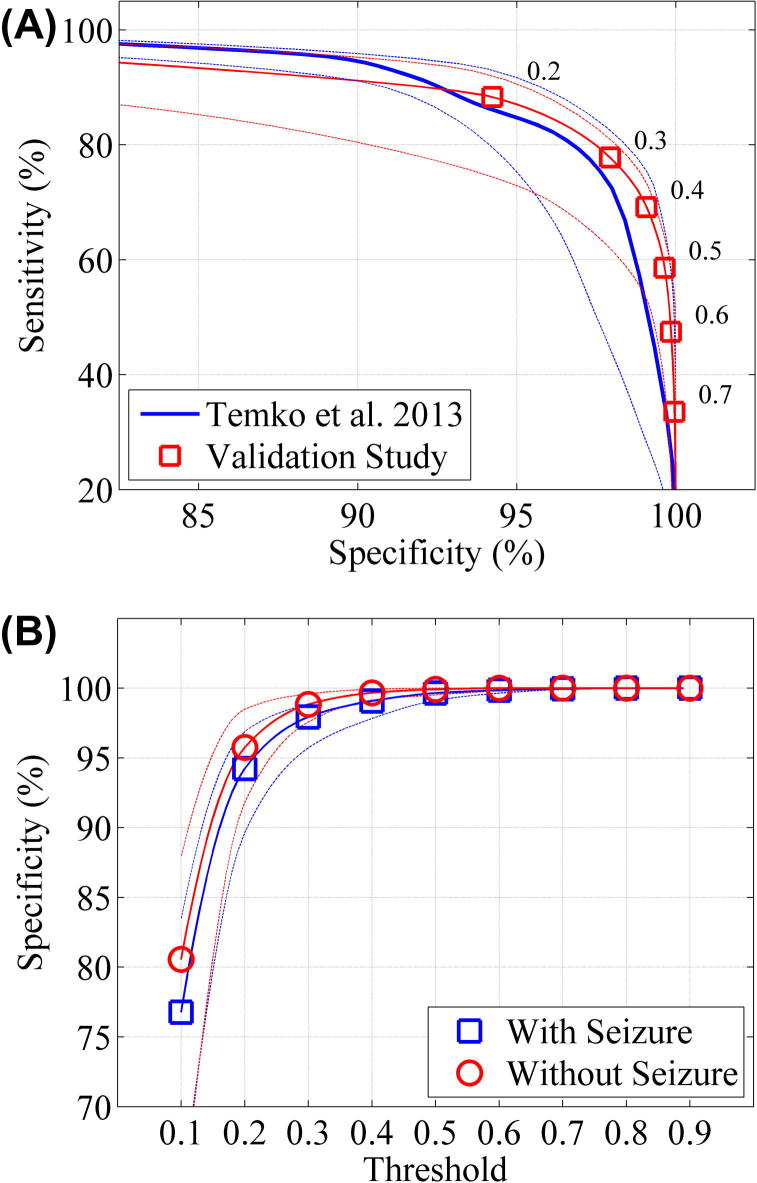
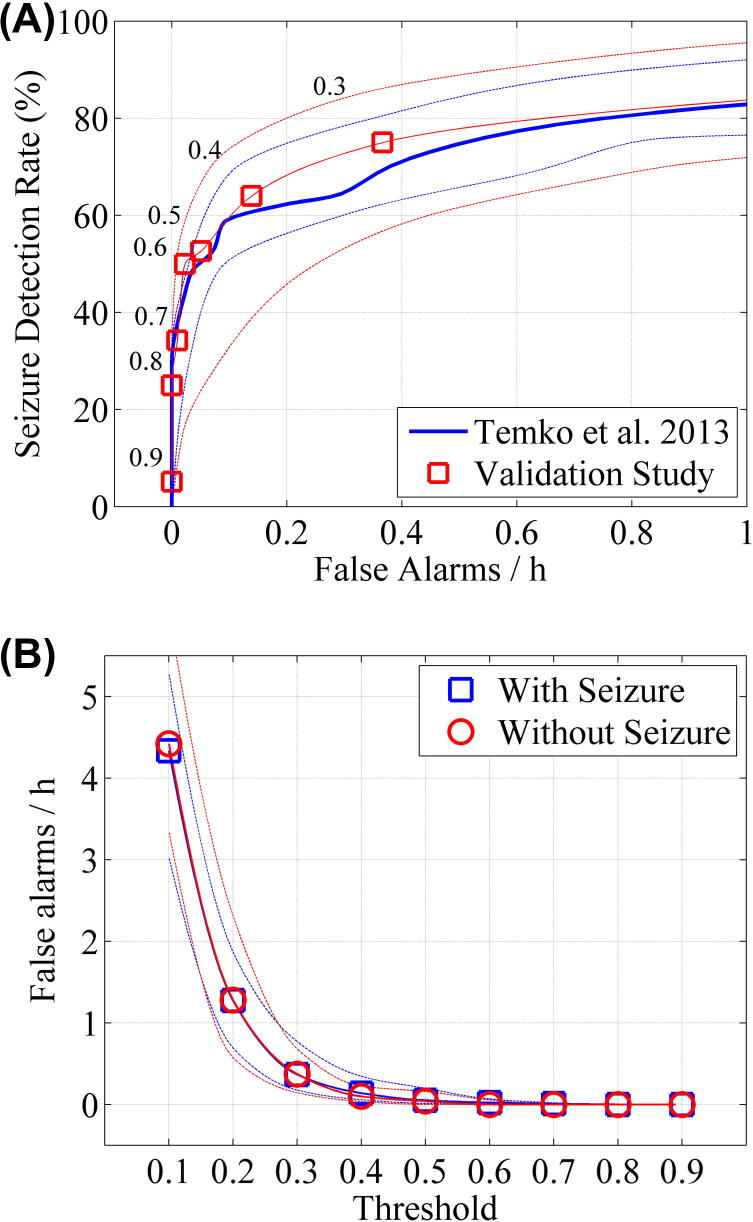
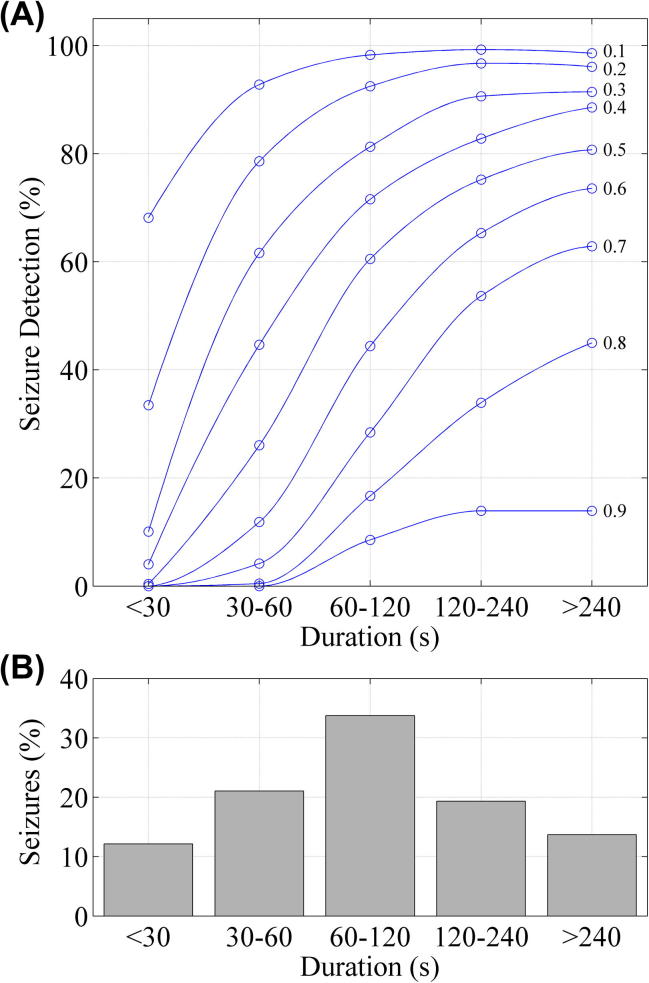
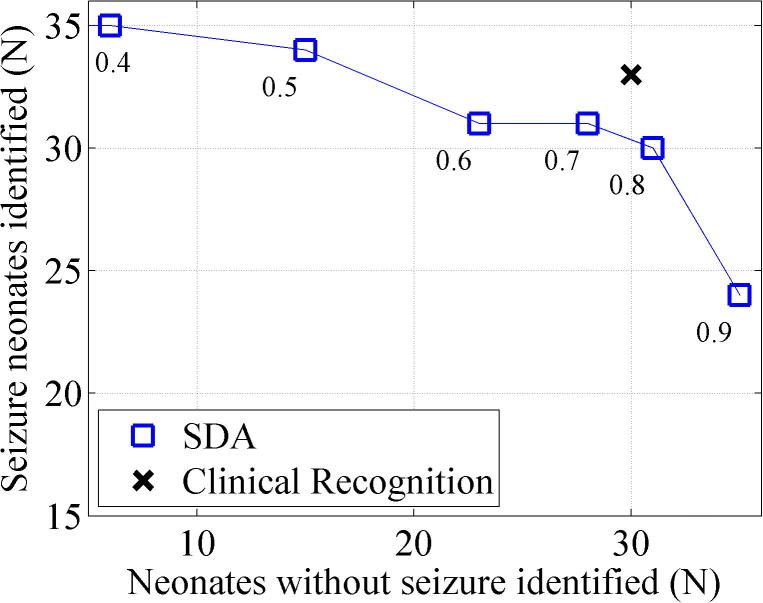
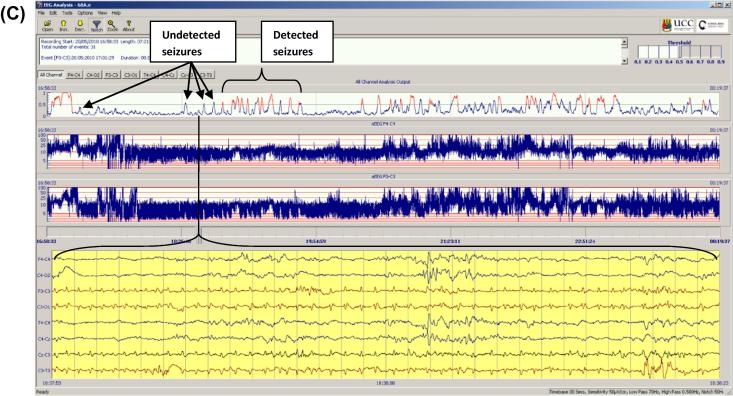
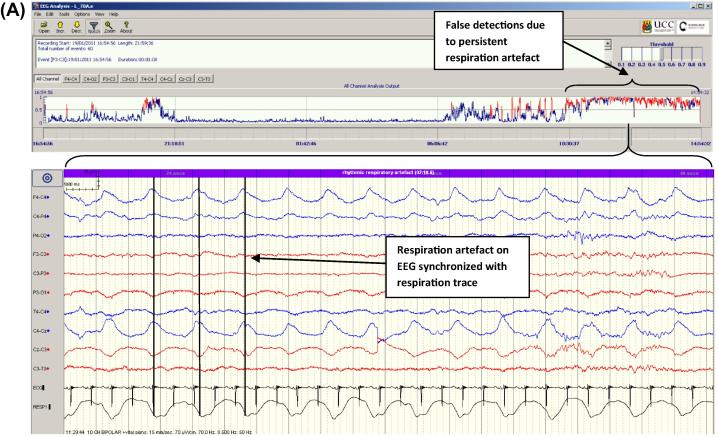
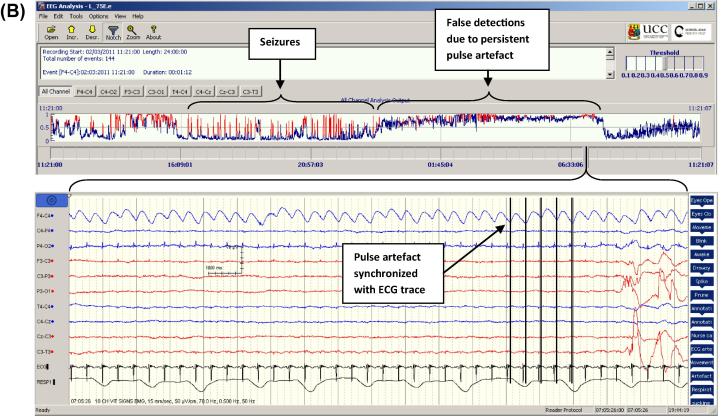
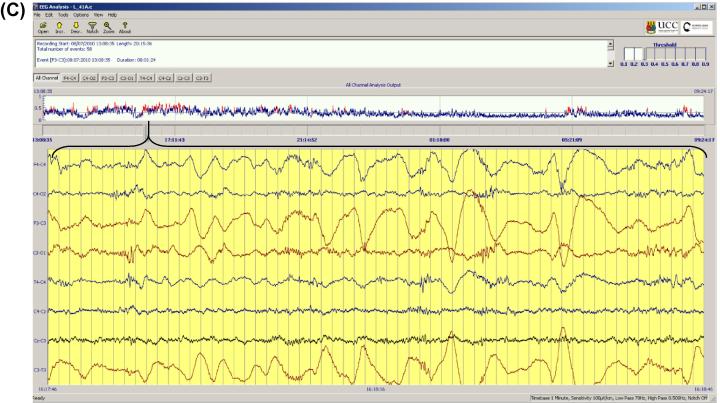
Results: Between sensitivity settings of 0.5 and 0.3, the algorithm achieved seizure detection rates of 52.6-75.0%, with false detection (FD) rates of 0.04-0.36FD/h for event based analysis, which was deemed to be acceptable in a clinical environment. Time based comparison of expert and SDA annotations using Cohen's Kappa Index revealed a best performing SDA threshold of 0.4 (Kappa 0.630). The SDA showed improved detection performance with longer seizures.

Conclusion: The SDA achieved promising performance and warrants further testing in a live clinical evaluation.

Significance: The SDA has the potential to improve seizure detection and provide a robust tool for comparing treatment regimens.

Keywords: Automated seizure detection; Hypoxic-ischaemic encephalopathy; Neonatal EEG; Neonatal neurology; Neonatal seizures.


Figures

Fig. 1
Fig. 1
The SDA incorporated into an EEG viewer. The output of the SDA is a graph of the probability of seizure (upper panel). When a seizure is detected the trace turns red and an annotation is made. The viewer also displays the continuous EEG and aEEG.
Fig. 2
Fig. 2
Temporal and event based assessment of agreement between the annotation of the human expert and the SDA output. S denotes seizure and NS denotes non-seizure. Light/shade in time bar denotes periods of temporal agreement/disagreement: true positives (TP), true negatives (TN), false positives (FP) and false negatives (FN). Markers denote event based agreement: TP and FP. Sensitivity for temporal assessment is 75.0% and specificity for temporal assessment is 75.0%. Sensitivity for event based assessment is 66.7% and a false alarm rate of 1/h.
Fig. 3
Fig. 3
Time based measures (overlap integral) of SDA performance. The broken lines denote the interquartile range. (A) The median receiver operator curves (the trade-off between sensitivity and specificity) of validation set (estimated on babies with seizure, N = 35) compared to ‘leave one out’ cross validation set (Temko et al., 2013). The numbers on the plot relate to the threshold at which the sensitivity and specificity were estimated. (B) The median specificity of the SDA for validation set with respect to SDA threshold, estimated on babies with seizure (N = 35) and babies without seizure (N = 35) in validation study.
Fig. 4
Fig. 4
Event based measures (any overlap) of SDA performance compared to the original LOO cross-validation. The broken lines denote the interquartile range. (A) The trade-off between seizure detection rate and false alarms per hour for babies with seizure (N = 35) in validation study compared to ‘leave one out’ cross validation study (Temko et al., 2013). The numbers on the plot relate to the threshold at which the sensitivity and specificity were estimated. (B) The median false alarm rate with respect to SDA threshold estimated on babies with seizure (N = 35) and babies without seizure (N = 35) in validation study.
Fig. 5
Fig. 5
Seizure detection rates and FDs/h (SDA sensitivity threshold 0.5) for individual babies in the cohort. Note the high false detection rates in seizure babies 25 and 26 due to respiration and pulse artefact. Babies to the left of the vertical line were babies recruited in Cork and those to the right were recruited in London.
Fig. 6
Fig. 6
Analysis of seizure detection rate with respect to seizure duration. (A) SDA performance with respect to seizure duration over nine thresholds. (B) The distribution of seizure durations throughout the concatenated recording.
Fig. 7
Fig. 7
The accuracy of the SDA for the identification of seizure and non-seizure babies at several thresholds. There were 35 neonates with EEG evidence of seizure and 35 neonates without EEG evidence of seizure. Clinical recognition is based on AED administration and is superior to the SDA.
Fig. 8
Fig. 8
Potential of the SDA to support decisions on AED administration. A total of 97 AED administrations were recorded. Of these, 78 were administered concurrently with EEG recording and 53 were concurrent with EEG seizures (seizures occurring in the 90 min prior to AED adminstration). At a threshold of 0.5, 45 (85%) AED administrations concurrent with EEG evidence of seizure and only 6 (24%) of AED administrations with no EEG evidence of seizure would be supported by the SDA.
Fig. 9
Fig. 9
Seizures missed by the SDA. (A) Brief 30 s seizure. 0 of 4 seizures were detected in this record (thr 0.5), though the algorithm output would cause the clinician to interrogate the EEG at various points despite the fact that the fixed threshold was not reached. (B) Subtle, dysrhythmic 2 min seizure with complex morphology, 0 of 1 seizures were detected in this record (thr 0.5). (C) Low amplitude seizure, 31 of 55 seizures were detected in this record (note. Non detected seizures produce clear peaks on the probability trace for interrogation).
Fig. 9
Fig. 9
Seizures missed by the SDA. (A) Brief 30 s seizure. 0 of 4 seizures were detected in this record (thr 0.5), though the algorithm output would cause the clinician to interrogate the EEG at various points despite the fact that the fixed threshold was not reached. (B) Subtle, dysrhythmic 2 min seizure with complex morphology, 0 of 1 seizures were detected in this record (thr 0.5). (C) Low amplitude seizure, 31 of 55 seizures were detected in this record (note. Non detected seizures produce clear peaks on the probability trace for interrogation).
Fig. 10
Fig. 10
Causes of false detection. (A) Respiration artefact. Upper panel shows output from SDA, lower panel shows rhythmic respiration artefact on EEG synchronized with respiration trace (from motion sensor). (B) Pulse artefact synchronized to ECG trace. (C) Sweat artefact with characteristic high amplitude semi-rhythmic slow waves spanning several seconds. (D) Highly rhythmic background EEG occurring in the intermediate sleep phase. Note how periodic episodes of intermediate/quiet sleep indicated by the CFM are coincident with periods of raised seizure probability output on the SDA graph and a highly rhythmic EEG in the lower panel.
Fig. 10
Fig. 10
Causes of false detection. (A) Respiration artefact. Upper panel shows output from SDA, lower panel shows rhythmic respiration artefact on EEG synchronized with respiration trace (from motion sensor). (B) Pulse artefact synchronized to ECG trace. (C) Sweat artefact with characteristic high amplitude semi-rhythmic slow waves spanning several seconds. (D) Highly rhythmic background EEG occurring in the intermediate sleep phase. Note how periodic episodes of intermediate/quiet sleep indicated by the CFM are coincident with periods of raised seizure probability output on the SDA graph and a highly rhythmic EEG in the lower panel.

References

    1. Cherian P.J., Deburchgraeve W., Swarte R.M., De Vos M., Govaert P., Van Huffel S. Validation of a new automated neonatal seizure detection system: a clinician’s perspective. Clin Neurophysiol. 2011;122:1490–1499. - PubMed
    1. Clancy R.R., Legido A. The exact ictal and interictal duration of electroencephalographic neonatal seizures. Epilepsia. 1987;28:537–541. - PubMed
    1. Deburchgraeve W., Cherian P.J., De Vos M., Swarte R.M., Blok J.H., Visser G.H. Automated neonatal seizure detection mimicking a human observer reading EEG. Clin Neurophysiol. 2008;119:2447–2454. - PubMed
    1. Glass H.C., Bonifacio S.L., Shimotake T., Ferriero D.M. Neurocritical care for neonates. Curr Treat Options Neurol. 2011;13:574–589. - PubMed
    1. Glass H.C., Glidden D., Jeremy R.J., Barkovich A.J., Ferriero D.M., Miller S.P. Clinical Neonatal Seizures are Independently Associated with Outcome in Infants at Risk for Hypoxic-Ischemic Brain Injury. J Pediatr. 2009;155:318–323. - PMC - PubMed

Publication types