. 2015 Oct;20(10):1179-87.
doi: 10.1038/mp.2015.74. Epub 2015 Jun 9.

Amyloid-PET predicts inhibition of de novo plaque formation upon chronic γ-secretase modulator treatment

Affiliations

Amyloid-PET predicts inhibition of de novo plaque formation upon chronic γ-secretase modulator treatment

M Brendel et al. Mol Psychiatry. 2015 Oct.

Abstract

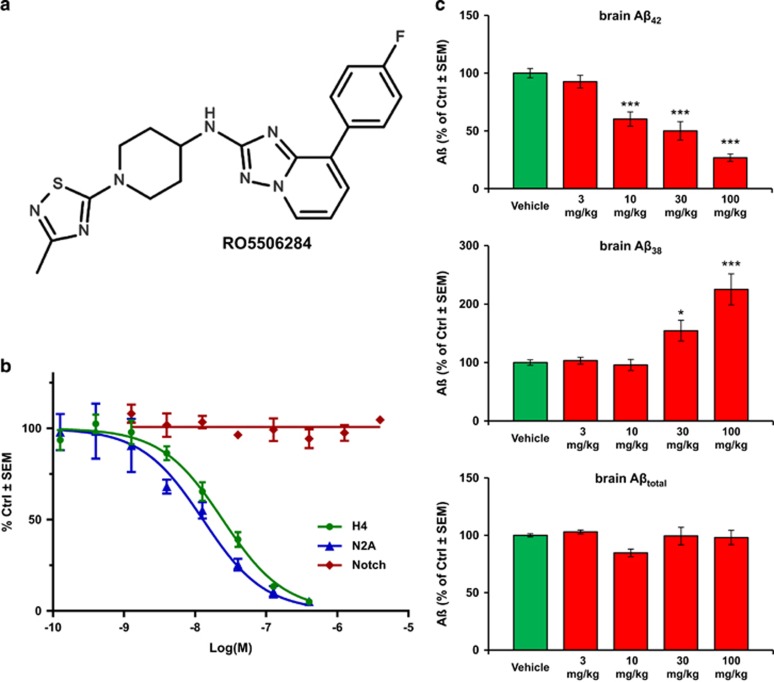
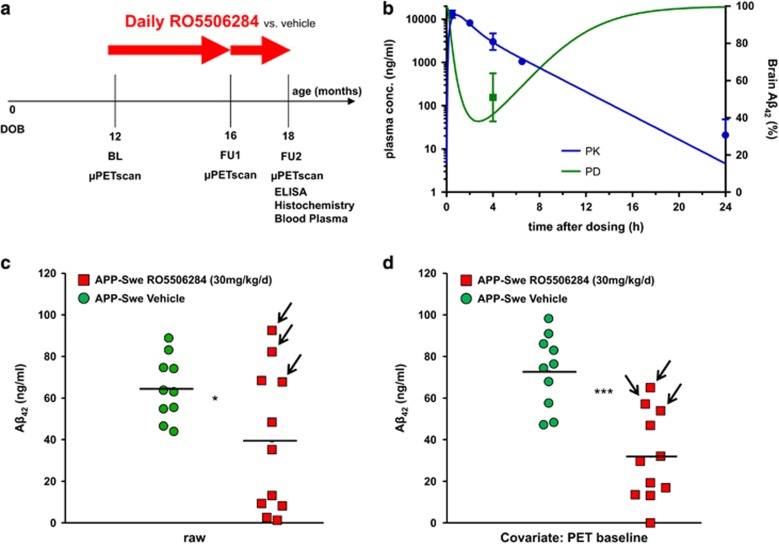
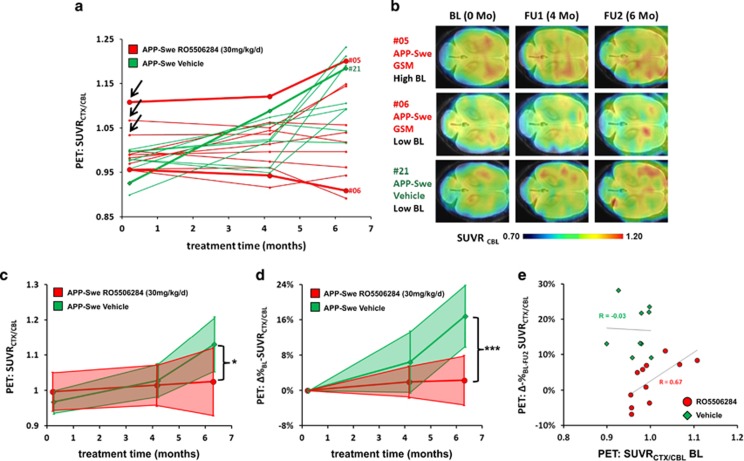
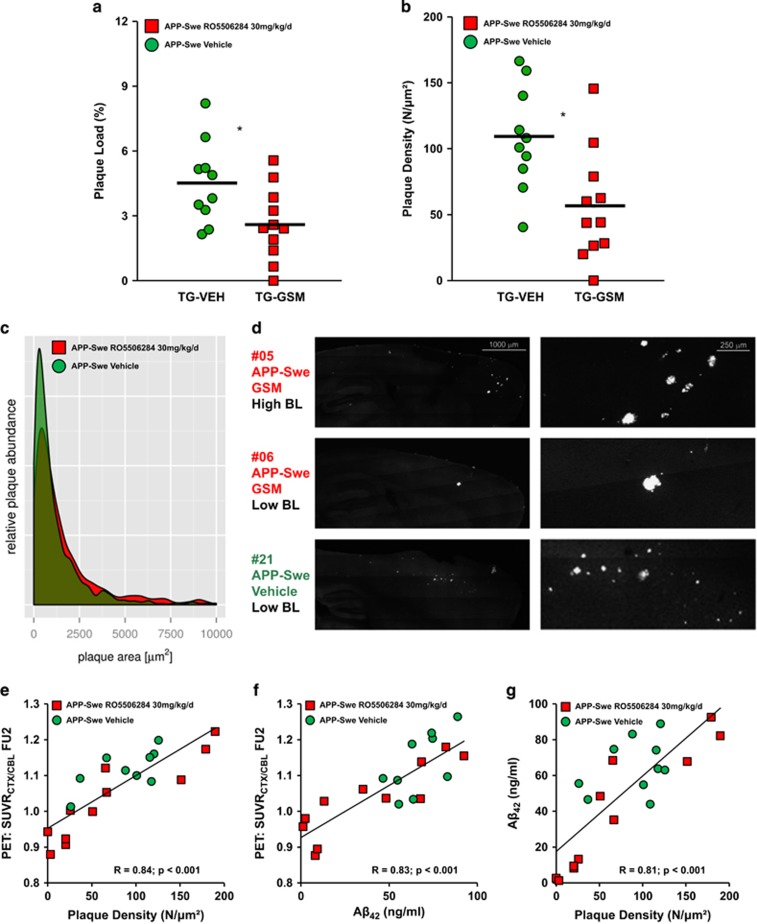
In a positron-emission tomography (PET) study with the β-amyloid (Aβ) tracer [(18)F]-florbetaben, we previously showed that Aβ deposition in transgenic mice expressing Swedish mutant APP (APP-Swe) mice can be tracked in vivo. γ-Secretase modulators (GSMs) are promising therapeutic agents by reducing generation of the aggregation prone Aβ42 species without blocking general γ-secretase activity. We now aimed to investigate the effects of a novel GSM [8-(4-Fluoro-phenyl)-[1,2,4]triazolo[1,5-a]pyridin-2-yl]-[1-(3-methyl-[1,2,4]thiadiazol-5-yl)-piperidin-4-yl]-amine (RO5506284) displaying high potency in vitro and in vivo on amyloid plaque burden and used longitudinal Aβ-microPET to trace individual animals. Female transgenic (TG) APP-Swe mice aged 12 months (m) were assigned to vehicle (TG-VEH, n=12) and treatment groups (TG-GSM, n=12), which received daily RO5506284 (30 mg kg(-1)) treatment for 6 months. A total of 131 Aβ-PET recordings were acquired at baseline (12 months), follow-up 1 (16 months) and follow-up 2 (18 months, termination scan), whereupon histological and biochemical analyses of Aβ were performed. We analyzed the PET data as VOI-based cortical standard-uptake-value ratios (SUVR), using cerebellum as reference region. Individual plaque load assessed by PET remained nearly constant in the TG-GSM group during 6 months of RO5506284 treatment, whereas it increased progressively in the TG-VEH group. Baseline SUVR in TG-GSM mice correlated with Δ%-SUVR, indicating individual response prediction. Insoluble Aβ42 was reduced by 56% in the TG-GSM versus the TG-VEH group relative to the individual baseline plaque load estimates. Furthermore, plaque size histograms showed differing distribution between groups of TG mice, with fewer small plaques in TG-GSM animals. Taken together, in the first Aβ-PET study monitoring prolonged treatment with a potent GSM in an AD mouse model, we found clear attenuation of de novo amyloidogenesis. Moreover, longitudinal PET allows non-invasive assessment of individual plaque-load kinetics, thereby accommodating inter-animal variations.


Conflict of interest statement

CH is an advisor of F. Hoffmann-La Roche. JB, TL and KB are employees of F. Hoffmann-La Roche. PB and AR have received speaking honoraria from Piramal Imaging. The remaining authors declare no conflict of interest.

Figures

Figure 1
Figure 1
(a) Chemical structure of RO5506284 ([8-(4-Fluoro-phenyl)-[1,2,4]triazolo[1,5–a]pyridin-2-yl]-[1-(3-methyl-[1,2,4]thiadiazol-5-yl)-piperidin-4-yl]-amine). (b) In vitro potency of RO5506284 in human H4 and mouse N2A cells overexpressing Swedish mutant APP on Aβ42 secretion; and effect on Notch processing in the HEK293 cell reporter assay. (c) Reduction of brain Aβ42 was determined in an acute study where the animals were killed 4 h post-treatment. Each bar represents the mean of n=5 (n=4 at 100 mg kg−1) animals. Young 3-month old, pre-amyloid Tg mice were used for this study to determine the changes of soluble brain Aβ following acute γ-secretase modulation with RO5506284. A dose-dependent decrease of brain Aβ42 (upper panel) and a corresponding increase of Aβ38 (mid panel) can be observed, without major effect in total Aβ levels (lower panel). *indicates statistically significant at P<0.05; ***indicates statistically significant at P<0.001.
Figure 2
Figure 2
(a) Temporal overview of the chronic GSM treatment arm, lasting from 12 months to 18 months of age, with intermediate Aβ-PET at 16 months of age. (b) PK/PD simulation of brain Aβ42 reduction effect after chronic treatment with 30 mg kg−1 daily of RO5506284. Blue curve indicates the PK simulation based on measured plasma concentrations (blue dots; mean value in ng ml−1±s.d., n=4) after the last oral administration of the chronic treatment. Green curve shows simulated PD response in relation to a daily dose of 30 mg kg−1. Area above the green curve represents the daily brain Aβ42 reduction. Green square (mean value in percentage±s.d., n=10) shows the observed Aβ42 levels after a single dose of 30 mg kg−1. (c) Individual concentration of brain Aβ42 after chronic treatment for 6 months without accounting for individual baseline amyloid levels. Each point represents the biochemically determined amount of Aβ42 in one hemisphere of each transgenic mouse. Red indicates TG-GSM and green indicates TG-VEH mice. Arrows indicate the three animals of the TG-GSM group with elevated PET baseline estimates (>2s.d. above group mean). (d) Individual concentration of brain Aβ42 after chronic treatment for 6 months upon adjustment by the individual baseline amyloid level, as assessed by Aβ-PET. Red indicates TG-GSM and green indicates TG-VEH mice. Arrows indicate the three animals of the TG-GSM group with elevated PET baseline estimates (>2s.d. above group mean). The horizontal line in the middle represents the mean value. *indicates statistically significant at P<0.05; ***indicates statistically significant at P<0.001.
Figure 3
Figure 3
(a) Individual Aβ-PET estimates from baseline (12 months) to termination (18 months). Longitudinal courses of SUVRCTX/CBL for each mouse are depicted by individual lines. Symbols and lines for representative mice #5 and #6 (TG-GSM, red), as well as mouse #21 (TG-VEH, green) are accentuated. (b) Axial slices of Aβ-PET images from mice #5, #6 and #21 at each study point superimposed on an MRI atlas. (c) Absolute SUVRCTX/CBL values for each of the three PET scanning times are shown for TG-GSM (red) and TG-VEH (green) mice. The thick line marks the mean value, whereas the filled area indicates the s.d. for all mice. *indicates statistically significant at P<0.05. (d) Percentage increase of follow-up and termination SUVRCTX/CBL relative to individual baseline values for TG-GSM (red) and TG-VEH (green) mice. The thick line marks the mean value, whereas the filled area indicates the s.d. of all mice. ***indicates statistically significant at P<0.001. (e) Response prediction by means of Aβ-PET. The percentage increase from baseline to termination SUVRCTX/CBL is depicted as a function of the individual baseline value. For the TG-GSM, a low baseline value predicted a lesser increase in amyloidosis during treatment, whereas mice with a high baseline value had a high increase despite treatment. For the TG-VEH, there was a remarkable increase in SUVRCTX/CBL, which was not a function of the individual baseline value. The correlations (r) between the percentage increase and the baseline value are indicated.
Figure 4
Figure 4
(a) Plaque load (%) in both TG groups assessed by methoxy-X04 staining. Each dot represents the histochemically determined plaque load, using Aβ-PET baseline estimate as covariate. Red indicates TG-GSM animals and green shows TG-VEH animals. (b) Plaque density using Aβ-PET baseline estimate as covariate for one hemisphere of each TG mouse. Red indicates TG-GSM animals and green shows TG-VEH animals. The horizontal line in the middle represents the mean value. *indicates statistically significant at P<0.05. (c) Histogram plotting of plaque size revealed a differing distribution between groups of TG mice, with significantly fewer small plaques in the TG-GSM animals (red). (d) Methoxy-X04 staining of representative sagittal slices in the three above mentioned animals, the right panel zooms into the areas with the largest clusters of amyloid plaques in frontal parts of cerebral cortex. (e) Correlation of final Aβ-PET estimates and plaque density shows excellent agreement. Corresponding hemispheres were used from TG-GSM (red squares) and TG-VEH (green circles) animals for this comparison. (f) Correlation of final Aβ-PET estimates and insoluble Aβ42 levels shows excellent agreement. Corresponding hemispheres were used from TG-GSM (red squares) and TG-VEH (green circles) animals for this comparison. (g) Correlation of Aβ42 levels and plaque density shows excellent agreement. Contralateral hemispheres were used from TG-GSM (red squares) and TG-VEH (green circles) animals for this comparison.

References

    1. 1Ziegler-Graham K, Brookmeyer R, Johnson E, Arrighi HM. Worldwide variation in the doubling time of Alzheimer's disease incidence rates. Alzheimers Dement 2008; 4: 316–323. - PubMed
    1. 2Braak H, Braak E. Neuropathological stageing of Alzheimer-related changes. Acta Neuropathol 1991; 82: 239–259. - PubMed
    1. 3Haass C, Selkoe DJ. Soluble protein oligomers in neurodegeneration: lessons from the Alzheimer's amyloid beta-peptide. Nat Rev Mol Cell Biol 2007; 8: 101–112. - PubMed
    1. 4Sun X, Jin L, Ling P. Review of drugs for Alzheimer's disease. Drug Discov Ther 2012; 6: 285–290. - PubMed
    1. 5Reisberg B, Doody R, Stoffler A, Schmitt F, Ferris S, Mobius HJ. Memantine in moderate-to-severe Alzheimer's disease. N Engl J Med 2003; 348: 1333–1341. - PubMed

Publication types

MeSH terms

Substances

Supplementary concepts