. 2014 Dec;4(1):41.
doi: 10.1186/s13550-014-0041-7. Epub 2014 Aug 1.

Imaging VEGF receptor expression to identify accelerated atherosclerosis

Affiliations

Imaging VEGF receptor expression to identify accelerated atherosclerosis

Yared Tekabe et al. EJNMMI Res. 2014 Dec.

Abstract

Background: The biology of the vulnerable plaque includes increased inflammation and rapid growth of vasa vasorum, processes that are associated with enhanced vascular endothelial growth factor (VEGF)/ imaging receptors for VEGF (VEGFR) signaling and are accelerated in diabetes. This study was designed to test the hypothesis that VEGFRs in atherosclerotic plaques with a SPECT tracer scVEGF-PEG-DOTA/(99m)Tc (scV/Tc) can identify accelerated atherosclerosis in diabetes.

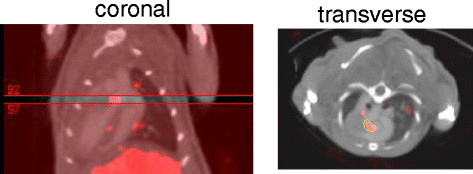
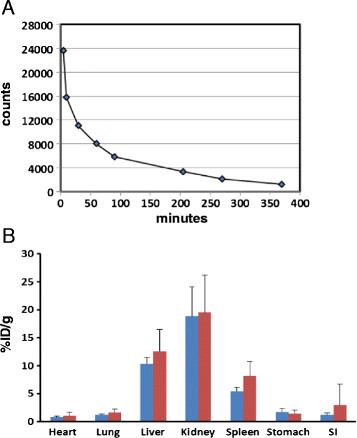
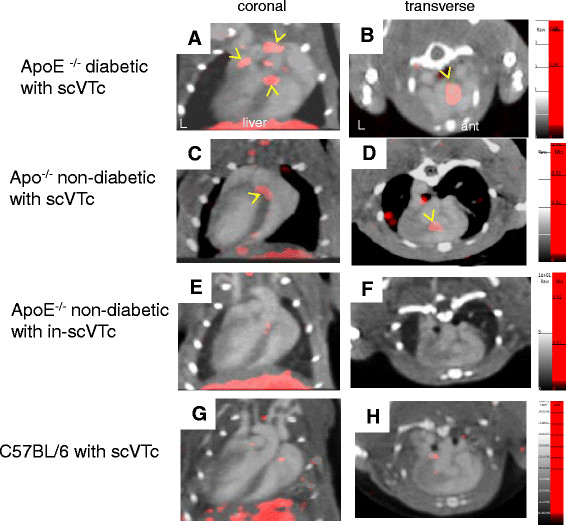
Methods: Male apolipoprotein E null (ApoE(-/-)) mice (6 weeks of age) were made diabetic (n = 10) or left as non-diabetic (n = 13). At 26 to 28 weeks of age, 5 non-diabetic mice were injected with functionally inactivated scV/Tc (in-scV/Tc) that does not bind to VEGF receptors, while 8 non-diabetic and 10 diabetic mice were injected with scV/Tc. After blood pool clearance, at 3 to 4 h post-injection, mice were injected with CT contrast agent and underwent SPECT/CT imaging. From the scans, regions of interest (ROI) were drawn on serial transverse sections comprising the proximal aorta and the percentage of injected dose (%ID) in ROIs was calculated. At the completion of imaging, mice were euthanized, proximal aorta explanted for gamma well counting to determine the percentage of injected dose per gram (%ID/g) uptake and immunohistochemical characterization.

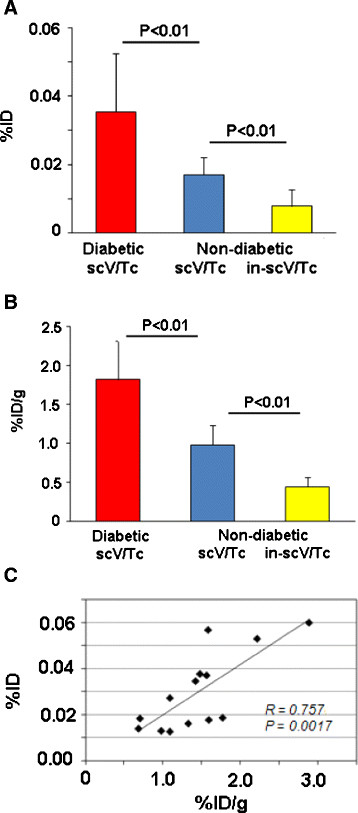
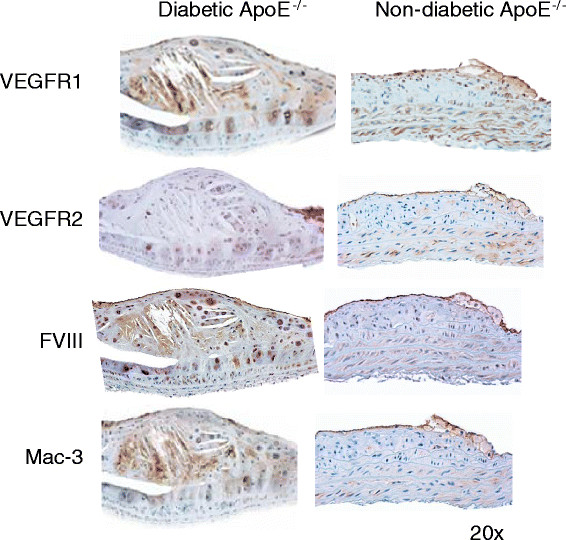
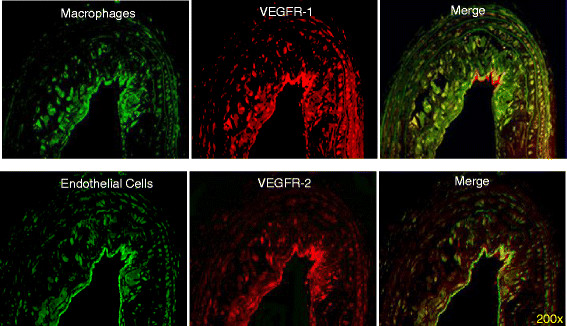
Results: The uptake of scV/Tc in the proximal aorta, calculated from SPECT/CT co-registered scans as %ID, was significantly higher in the diabetic mice (0.036 ± 0.017%ID) compared to non-diabetic mice (0.017 ± 0.005%ID; P < 0.01), as was uptake measured as %ID/g in harvested aorta, 1.81 ± 0.50%ID/g in the diabetic group vs. 0.98 ± 0.25%ID/g in the non-diabetic group (P < 0.01). The nonspecific uptake of in-scV/Tc in proximal aorta was significantly lower than the uptake of functionally active scV/Tc. Immunostaining of the atherosclerotic lesions showed higher expression of VEGFR-1 and VEGFR-2 in the diabetic mice.

Conclusion: These initial results suggest that imaging VEGFR with scV/Tc shows promise as a non-invasive approach to identify accelerated atherosclerosis.


Figures

Figure 1
Figure 1
Method for ROI placement for quantification. Slices comprising the focal uptake (red color table) are identified on the coronal projection, and an ROI is drawn around the uptake on the transverse projection. The counts in this region are converted to mCi using a calibration standard that is loaded into the software.
Figure 2
Figure 2
Blood pool clearance and biodistribution of scV/Tc. A. Blood pool clearance of scV/Tc in diabetic mice. Each time point represents an average of three mice. B. Similar biodistribution of scV/Tc in non-targeted organs in non-diabetic (blue bars) and diabetic (red bars) mice. Bars represent mean ± SD. SI = small intestine.
Figure 3
Figure 3
SPECT/CT imaging of atherosclerotic plaques in diabetic and non-diabetic ApoE−/−mice. Representative coronal (left) and transverse (right) images obtained for diabetic ApoE−/− mouse (A, B), non-diabetic ApoE−/− mouse (C, D) injected with functionally active scV/Tc, for non-diabetic ApoE−/− injected with functionally inactivated in-scV/Tc (E, F) for assessment of nonspecific, not VEGFR-mediated tracer uptake, and C57BL/6 mouse (G, H) injected with scV/Tc for assessment of tracer uptake in non-atherosclerotic, non-diabetic mouse (disease control). The CT contrast outlines the ventricular cavities and arterial vessels. Focal areas of scV/Tc uptake (in red) are found in the aortic arch and proximal brachiocephalic branches in diabetic mice, but are localized mostly to the aortic root in the non-diabetic mouse, and yellow arrows indicate the prominent areas of tracer uptake. No appreciable uptake of tracer localized to vascular territories was seen in the ApoE−/− mice injected with in-scV/Tc or the C57BL/6 mice injected with scV/Tc.
Figure 4
Figure 4
Quantitative analysis of tracer uptake. (A) Average %ID ± standard deviation for uptake of functionally active scV/Tc in diabetic (red bar), non-diabetic (blue bar), and nonspecific (non-VEGFR-mediated) in-scV/Tc uptake in non-diabetic ApoE−/− mice (yellow bar). (B) Average %ID/g for the same groups of mice, as calculated from gamma well counting of harvested aorta. (C) Correlation for %ID vs. %ID/g.
Figure 5
Figure 5
Immunohistochemical characterization of atherosclerotic plaques. Representative aortic tissue sections stained for VEGFR-1, VEGFR-2, FVIII (marker for endothelial cells), and Mac-3 (marker for macrophages) in diabetic and non-diabetic ApoE−/− mice.
Figure 6
Figure 6
Differential expression of VEGFR-1 and VEGFR-2 on endothelial cells and macrophages. Double immunofluorescent staining for VEGFRs and markers of endothelial cells (FVIII) and macrophages (Mac-3). Serial atherosclerotic sections from diabetic mice were double-stained for VEGFR-1 and Mac-3 (upper row) or VEGFR-2 and FVIII (lower row), as indicated. Co-localization is visible on merged images as the yellow color.

References

    1. Kusters DH, Tegtmeier J, Schurgers LJ, Reutelingsperger CP. Molecular imaging to identify the vulnerable plaque–from basic research to clinical practice. Mol Imag Biol. 2012;14:523–533. doi: 10.1007/s11307-012-0586-7. - DOI - PubMed
    1. Quillard T, Libby P. Molecular imaging of atherosclerosis for improving diagnostic and therapeutic development. Circ Res. 2012;111:231–244. doi: 10.1161/CIRCRESAHA.112.268144. - DOI - PMC - PubMed
    1. Laitinen I, Saraste A, Weidl E, Poethko T, Weber AW, Nekolla SG, Leppänen P, Ylä-Herttuala S, Hölzlwimmer G, Walch A, Esposito I, Wester HJ, Knuuti J, Schwaiger M. Evaluation of alphaVbeta3 integrin-targeted positron emission tomography tracer 18 F-galacto-RGD for imaging of vascular inflammation in atherosclerotic mice. Circ Cardiovasc Imag. 2009;2:331–338. doi: 10.1161/CIRCIMAGING.108.846865. - DOI - PubMed
    1. Dimastromatteo J, Broisat A, Perret P, Ahmadi M, Boturyn D, Dumy P, Fagret D, Riou LM, Ghezzi C. In vivo molecular imaging of atherosclerotic lesions in ApoE−/−mice using VCAM-1-specific, 99mTc-labeled peptidic sequences. J Nucl Med. 2013;54:1442–1449. doi: 10.2967/jnumed.112.115675. - DOI - PMC - PubMed
    1. Nahrendorf M, Keliher E, Panizzi P, Zhang H, Hembrador S, Figueiredo JL, Aikawa E, Kelly K, Libby P, Weissleder R. 18F-4V for PET-CT imaging of VCAM-1 expression in atherosclerosis. J Am Coll Cardiol Cardiovasc Imag. 2009;2:1213–1222. doi: 10.1016/j.jcmg.2009.04.016. - DOI - PMC - PubMed

LinkOut - more resources