. 2015 Aug 7;6(22):18905-20.
doi: 10.18632/oncotarget.4305.

Underexpression of LKB1 tumor suppressor is associated with enhanced Wnt signaling and malignant characteristics of human intrahepatic cholangiocarcinoma

Affiliations

Underexpression of LKB1 tumor suppressor is associated with enhanced Wnt signaling and malignant characteristics of human intrahepatic cholangiocarcinoma

Jinghan Wang et al. Oncotarget. .

Abstract

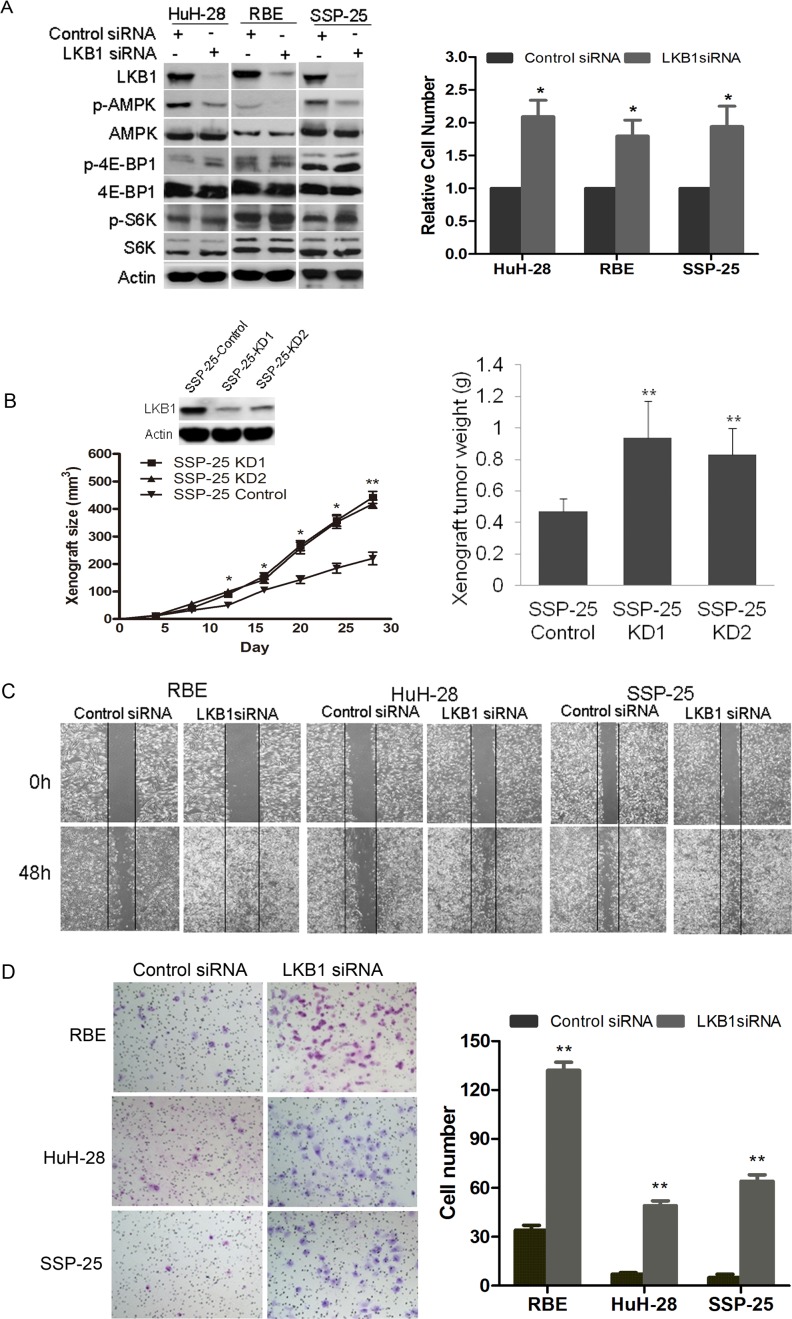
Intrahepatic cholangiocarcinoma (ICC) is a rare and highly aggressive malignancy. In this study, we identified the presence of gene deletion and missense mutation leading to inactivation or underexpression of liver kinase B1 (LKB1) tumor suppressor and excluded the involvement of LKB1 gene hypermethylation in ICC tissues. Immunohistochemical analysis showed that LKB1 was underexpressed in a portion of 326 ICC tissues compared to their adjacent normal tissues. By statistical analysis underexpression of LKB1 in ICC tissues significantly correlated with poor survival and malignant disease characteristics in ICC patients. Moreover, we showed that knockdown of LKB1 significantly enhanced growth, migration, and invasion of three LKB1-competent ICC cell lines. Global transcriptional profiling analysis identified multiple malignancy-promoting genes, such as HIF-1α, CD24, Talin1, Vinculin, Wnt5, and signaling pathways including Hedgehog, Wnt/β-catenin, and cell adhesion as novel targets of LKB1 underexpression in ICC cells. Furthermore, knockdown of LKB1 gene expression dramatically enhanced Wnt/β-catenin signaling in ICC cells, while an inverse correlation between LKB1 and nuclear β-catenin was observed in ICC tissues. Our findings suggest a novel mechanism for ICC carcinogenesis in which LKB1 underexpression enhances multiple signaling pathways including Wnt/β-catenin to promote disease progression.

Keywords: Wnt/β-catenin; global transcriptional profiling; intrahepatic cholangiocarcinoma (ICC); liver kinase B1 (LKB1); recurrence and metastasis.


Conflict of interest statement

CONFLICTS OF INTEREST

The authors declare no conflict of interest.

Figures

Figure 1
Figure 1. Genetic alterations and methylation of LKB1 in cholangiocarcinomas
A. Dual-color fluorescence in situ hybridization (FISH) of cholangiocarcinoma tissues as indicated where green indicates the reference of chromosome 19, and red the LKB1 locus. Upper left: normal diploid (2Red/2Green), upper right: homozygous deletion (0R/2G), lower left: hemizygous deletion (1R/2G) and lower right: polypoid (3G>R). B. Illustrates a second genetic alteration in a representative cholangiocarcinoma tissue with heterozygous LKB1 deletion. Tumor section negative for LKB1 by IHC (x200, upper-left), LKB1-FISH (upper-right), T834A nonsense (lower panel) mutation of exon-6 resulting in a premature stop codon, scale bar: 20 μM. C. Sanger sequencing maps of 9 missense mutations identified in 147 ICC tissue samples. The heterozygous mutated nucleotide was labeled by arrows in the map. D. Measurement of the LKB1 methylation level using pyrosequencing in a representative ICC tissue. The asterisks indicate no residual C at the non-CpG site, ensuring complete bisulfite conversion.
Figure 2
Figure 2. Decreased expression of LKB1 correlates with poor prognosis in cholangiocarcinoma patients
A. Photomicrographs of three representative cholangiocarcinoma sections stained for high, intermediate, and low LKB1 expression ( x 200), scale bar: 20 μM. B. Comparison of relative IHC staining of LKB1 expression in paired ICC tissue samples (N = 326). C. Kaplan-Meier analysis for OS and TTR of patients with different LKB1 expression levels. D. Cox multivariate proportional hazard regression analyses for OS and TTR of 326 ICCs. The variables included in the multivariate analysis were selected by univariate analysis.
Figure 3
Figure 3. Impact of knockdown of LKB1 on growth, migration and invasion of ICC cell lines
A. Western blot analysis of cell lysates of HuH-28 and RBE cells transfected with either LKB1 siRNA or scramble (control) siRNA harvested at 72 h post transfection. Actin serves as loading control, and phosphorylated and total AMPK, 4E-BP1, and S6K were detected with the appropriate antibodies. Effective knockdown of LKB1 in both HuH-28 and RBE cells was verified (left panel). In the right hand panel a histogram of 72h proliferation shows knockdown of LKB1 increased the in vitro proliferation of HuH-28, RBE and SSP-25 cells (*P < 0.05, compared to control siRNA). B. Downregulation of LKB1 promoted the growth of SSP-25 in vivo. Western blot of LKB1 in SSP-25-Control and SSP-25-KD1/2 (control for control shRNA transfected, KD1/2 for LKB1 shRNA1/2 transfected; upper-left); tumor growth curves of SSP-25-Control and SSP-25-KD1/2 (lower-left); quantitative analysis of weight (g) of tumor xenografts (right, **P < 0.01, compared to control shRNA). C. Representative photomicrographs of the wound healing assay at the times indicated in scramble (control) and LKB1 siRNA transfected cells as shown. Vertical black lines indicate the initial extent of the clearing of the cell monolayers. D. Lower surface of Matrigel transwell membranes seeded ICC cells transfected with siRNAs as indicated after 24 h incubation is shown on the left with quantitative analysis of invaded cells shown on the right. Data are shown as mean values graphed for indicated cells on the right (N = 3 replicates per cell type). Error bars show SD ((*P < 0.05, **P < 0.01, compared with control siRNA).
Figure 4
Figure 4. Identification of gene targets and signaling pathways of LKB1 inactivation in ICC by RNAseq analysis and gene set enrichment analysis
Candidates identified by RNAseq analysis of LKB1 siRNA versus control transfected ICC cell lines were validated by A. qRT-PCR analysis and B. Western-blot analysis. qRT-PCR is presented as ratio/fold difference of LKB1 siRNA transfected to control siRNA transfected cells. HIF-1α protein was measured under both normoxia (HIF1α-N, 21% O2) and hypoxia (HIF1α-H, 1% O2 for 18h). C. The list of gene set enriched by knockdown of LKB1 in ICC cells.
Figure 5
Figure 5. GSEA identified the enrichment of Wnt/β-catenin upon knockdown of LKB1 in ICC cells
A. Heat map of relative enrichment scores for Wnt signaling pathway genes in siRNA transfected ICC cells as indicated. Gene signatures are represented in rows (red = significant enrichment of overexpressed genes; green, significant enrichment of under-expressed genes; black, not significant; P < 0.05). ICC cells and conditions are represented in columns (HuC: HuH-28 transfected with control siRNA, HuL: HuH-28 with LKB1 siRNA, RC: RBE with control siRNA, RL: RBE with LKB1 siRNA, SC: SSP-25 transfected with control siRNA, SL: SSP-25 with LKB1 siRNA, 1 for the 1st test, 2 for the 2nd test. B. Enrichment plots of the Wnt/β-catenin gene set in all three LKB1-attenuated ICC lines. C. Western-blot analysis to validate selected proteins involved in Wnt/β-catenin signaling and EMT markers. D. Quantitation of TOPFlash luciferase activity of TCF promoter reporter in ICC cells transfected with control or LKB1 siRNA as indicated (**P < 0.01, compared to control siRNA). E. Double-label fluorescent immunohistochemistry of cells as indicated at 72h posttransfection with LKB1 or control siRNA in the three ICC cells. Blue is DAPI nuclear stain and green is β–catenin. Inserts show magnified areas.
Figure 6
Figure 6. Inverse correlation between LKB1 and nuclear β-catenin in ICC tissues
A. Representative IHC staining of LKB1 and β-catenin (x200) in serial sections, scale bar: 20 μM. Shown are low LKB1 (left), moderate LKB1 (middle) and high LKB1 (right). Inserts indicate magnified areas. B. Regression plot of LKB1 and nuclear β-catenin in 326 patient tissues, analyzed by Spearman's nonparametric correlation test (R = −0.147; P < 0.05).

References

    1. Bridgewater J, Galle PR, Khan SA, Llovet JM, Park JW, Patel T, Pawlik TM, et al. Guidelines for the diagnosis and management of intrahepatic cholangiocarcinoma. J Hepatol. 2014;60:1268–1289. - PubMed
    1. Blechacz B, Gores GJ. Cholangiocarcinoma: advances in pathogenesis, diagnosis, and treatment. Hepatology. 2008;48:308–321. - PMC - PubMed
    1. Palmer WC, Patel T. Are common factors involved in the pathogenesis of primary liver cancers? A meta-analysis of risk factors for intrahepatic cholangiocarcinoma. J Hepatol. 2012;57:69–76. - PMC - PubMed
    1. Andersen JB, Thorgeirsson SS. Genetic profiling of intrahepatic cholangiocarcinoma. Curr Opin Gastroenterol. 2012;28:266–272. - PMC - PubMed
    1. Andersen JB, Spee B, Blechacz BR, Avital I, Komuta M, Barbour A, Conner EA, et al. Genomic and genetic characterization of cholangiocarcinoma identifies therapeutic targets for tyrosine kinase inhibitors. Gastroenterology. 2012;142:1021–1031. e1015. - PMC - PubMed

Publication types

MeSH terms