. 2015 Jun 23;112(25):E3169-78.
doi: 10.1073/pnas.1422594112. Epub 2015 Jun 8.

Regulation by a chaperone improves substrate selectivity during cotranslational protein targeting

Affiliations

Regulation by a chaperone improves substrate selectivity during cotranslational protein targeting

Aileen Ariosa et al. Proc Natl Acad Sci U S A. .

Abstract

The ribosome exit site is a crowded environment where numerous factors contact nascent polypeptides to influence their folding, localization, and quality control. Timely and accurate selection of nascent polypeptides into the correct pathway is essential for proper protein biogenesis. To understand how this is accomplished, we probe the mechanism by which nascent polypeptides are accurately sorted between the major cotranslational chaperone trigger factor (TF) and the essential cotranslational targeting machinery, signal recognition particle (SRP). We show that TF regulates SRP function at three distinct stages, including binding of the translating ribosome, membrane targeting via recruitment of the SRP receptor, and rejection of ribosome-bound nascent polypeptides beyond a critical length. Together, these mechanisms enhance the specificity of substrate selection into both pathways. Our results reveal a multilayered mechanism of molecular interplay at the ribosome exit site, and provide a conceptual framework to understand how proteins are selected among distinct biogenesis machineries in this crowded environment.

Keywords: GTPases; protein biogenesis; ribosome; signal recognition particle; trigger factor.


Conflict of interest statement

The authors declare no conflict of interest.

Figures
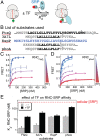
Fig. 1.
Fig. 1.
TF binds to SRP-occupied RNCs and weakens SRP binding. (A) Schematic depiction of the FRET assay to measure RNC–SRP binding. Green dot denotes Cm (donor); red dot denotes BODIPY FL (acceptor). (B) N-terminal sequences of the different substrates used in this study. Bold highlights the hydrophobic core of the signal sequences. Asterisk denotes the position where the amino acid is replaced by the Cm dye. (C and D) Equilibrium titrations for RNC–SRP binding in the presence of increasing TF concentration (indicated as increasing shades of red). The data were fitted to Eq. S2 and yielded the following parameters. (C) Apparent Kd values for RNCFtsQ binding of 1.1 nM, 1.5 nM, 9.2 nM, and 16.6 nM and FRET end points of 0.54, 0.35, 0.29, and 0.17, respectively, with 0 µM, 1 µM, 5 µM, and 30 µM TF present. (D) Apparent Kd values for RNCphoA binding of 17.2 nM, 21.1 nM, 30.3 nM, 28.3 nM, 31.5 nM, 104.5 nM, 106.3 nM, and 131.9 nM and FRET end points of 0.40, 0.41, 0.39, 0.29, 0.21, 0.19, 0.09, and 0.08, respectively, with 0 µM, 0.1 µM, 0.2 µM, 0.5 µM, 1 µM, 2 µM, 5 µM, and 10 µM TF present. (E) Summary of the effect of TF on apparent RNC–SRP binding affinity with the different substrates. The red dashed line denotes the cellular SRP concentration. Error bars are shown but may not be visible. Error bars are SDs from two to three measurements.
Fig. 2.
Fig. 2.
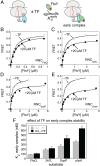
SRP binds TF-occupied RNCs and weakens the binding of TF. (A) Scheme depicting the FRET assay to measure TF binding to RNC. Green dot denotes Cm (donor); red dot denotes BODIPY (acceptor). (B) Fluorescence emission spectra for Cm-labeled RNC (gray), BODIPY-labeled TF (BPY-TF, blue), and Cm-RNC in the presence of unlabeled TF (black) or BPY-TF (red). (C and D) Representative equilibrium titrations for RNC–TF binding in the presence of increasing SRP concentration (indicated as increasing shades of red). The data were fitted to Eq. S2 and yielded the following parameters. (C) Apparent Kd values for TF–RNCFtsQ binding of 2.6 nM, 9.2 nM, 26 nM, and 30 nM and FRET end points of 0.34, 0.21, 0.22, and 0.17, respectively, with 0 nM, 100 nM, 200 nM, and 400 nM SRP present. (D) Apparent Kd values for RNCphoA binding of 5.1 nM, 7.6 nM, 13.1 nM, 20.9 nM, and 19.5 nM and FRET end points of 0.32, 0.33, 0.35, 0.29, and 0.29, respectively, with 0 nM, 100 nM, 200 nM, 400 nM, and 800 nM SRP present. (E) Summary of the effect of SRP on the apparent RNC–TF binding affinity for the different substrates. Error bars are SDs from two to three experiments.
Fig. 3.
Fig. 3.
TF induces formation of a weaker and distorted RNC•SRP•FtsY early complex. (A) Scheme depicting the FRET assay for measuring the formation of the early complex. (BE) Representative equilibrium titrations for formation of the early targeting complex without (○) or with (●) 20 µM TF present for SRP loaded with 450 nM RNCFtsQ (B), 400 nM RNC3A7L (C), 600 nM RNCEspP (D), and 1 µM RNCphoA (E). The data were fitted to Eq. S3 and yielded the following parameters: (B) Kd values of 80 nM and 108 nM and FRET end points of 0.47 and 0.45, respectively, with and without TF; (C) Kd values of 191 nM and 218 nM and FRET end points of 0.47 and 0.37, respectively, with and without TF; (D) Kd values of 266 nM and 428 nM and FRET end points of 0.42 and 0.32, respectively, with and without TF; and (E) Kd values of 358 nM and 640 nM and FRET end points of 0.51 and 0.33, respectively, with and without TF. (F) Summary of the effects of TF on the stability of the early complex formed with the different substrates. Error bars are SDs from 2 to 3 independent experiments.
Fig. 4.
Fig. 4.
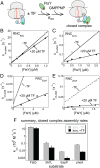
TF selectively slows SRP•FtsY closed complex assembly with the suboptimal cargos. (A) Scheme for the FRET assay to measure the kinetics of SRP•FtsY closed complex assembly (kon). (BE) Representative measurements of association rate constants for SRP•FtsY closed complex assembly in the absence and presence of 20 µM TF, for SRP loaded with 800 nM RNCFtsQ (B), 350 nM RNC3A7L (C), 500 nM RNCEspP (D), and 800 nM RNCphoA (E). The data were fitted to Eq. S4 and yielded the following values of kon: (B) 18.5 × 10⁶ M-1⋅s-1 and 16.2 × 10⁶ M-1⋅s-1 with and without TF present, respectively; (C) 1.45 × 10⁵ M-1⋅s-1 and 0.41 × 10⁵ M-1⋅s-1 with and without TF present, respectively; (D) 8.4 × 10³ M-1⋅s-1 and 1.3 × 10³ M-1⋅s-1 with and without TF present, respectively; and (E) 6.3 × 10⁴ M-1⋅s-1 and 0.71 × 10⁴ M-1⋅s-1 with and without TF present, respectively. (F) Summary of the effect of TF on the rate of SRP•FtsY closed complex assembly with different substrates. Error bars are SDs from two to three independent experiments.
Fig. 5.
Fig. 5.
TF more effectively inhibits SRP function at a longer nascent chain length. (A) Scheme depicting the two steps: binding of SRP to RNC and assembly of the closed targeting complex. (BD) Effects of TF on the apparent binding affinity of SRP to RNCFtsQ (B), RNC3A7L (C), and RNCphoA (D) when the nascent chain is 80–85 residues long (green lines) or 130–135 residues long (red lines). Error bars are SDs from two to three measurements or error estimates from fit of data, whichever is greater. (EG) Effects of 20 µM TF on the assembly kinetics of the closed targeting complex with RNCFtsQ (E), RNC3A7L (F), and RNCphoA (G) when the nascent chains are 130–135 residues long. Representative rate measurements are shown. The rate and equilibrium constants derived from two to three measurements are summarized in Tables 1 and 2.
Fig. 6.
Fig. 6.
TF enhances the specificity of SRP-dependent targeting to ER membrane. (AD) Translocation of 2A8L-pPL (A), 3A7L-pPL (B), EspP-pPL (C), and phoA-pPL (D) by SRP and FtsY (0 nM, 10 nM, 33 nM, 100 nM, and 300 nM) in the absence (○) or presence (●) of 16 µM TF. In each panel, representative gels are shown (Top) with quantification of the gel (Bottom). (E) Summary of translocation efficiencies at saturating FtsY concentrations with and without TF. Error bars are SDs from three to four independent experiments.
Fig. 7.
Fig. 7.
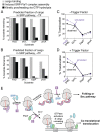
Mathematical simulations and model describing the molecular mechanism of substrate partitioning into the SRP or TF pathway. (A and B) Mathematical simulations of the fraction of substrates that remain in the SRP pathway at different stages without (A) and with (B) TF. Light gray bars denote the fraction of RNC retained at the SRP binding step; dark gray bars denote the fraction of RNC retained after assembly of the closed SRP•FtsY complex; black bars denote the fraction of RNC remaining in the pathway after kinetic proofreading via GTP hydrolysis. (C and D) Comparison of predicted (dashed) and experimentally determined (solid) efficiencies of targeting and translocation of the model substrates by the SRP targeting pathway without (C) and with (D) TF. The values plotted are obtained from Fig. 6E (black bars) and Fig. 7 A and B. (E) TF regulates SRP at three steps: (i) SRP binding to RNC, (ii) targeting of RNC to the membrane via SRP•FtsY assembly, and (iii) removal of SRP from ribosomes when the nascent polypeptide exceeds a critical length.

References

    1. Merz F, et al. Molecular mechanism and structure of Trigger Factor bound to the translating ribosome. EMBO J. 2008;27(11):1622–1632. - PMC - PubMed
    1. Fedyukina DV, Cavagnero S. Protein folding at the exit tunnel. Annu Rev Biophys. 2011;40:337–359. - PMC - PubMed
    1. Ferbitz L, et al. Trigger factor in complex with the ribosome forms a molecular cradle for nascent proteins. Nature. 2004;431(7008):590–596. - PubMed
    1. Lakshmipathy SK, et al. Identification of nascent chain interaction sites on trigger factor. J Biol Chem. 2007;282(16):12186–12193. - PubMed
    1. Schlünzen F, et al. The binding mode of the trigger factor on the ribosome: Implications for protein folding and SRP interaction. Structure. 2005;13(11):1685–1694. - PubMed

Publication types

MeSH terms