. 2015 Jun 23;112(25):7803-8.
doi: 10.1073/pnas.1501897112. Epub 2015 Jun 8.

Host lysozyme-mediated lysis of Lactococcus lactis facilitates delivery of colitis-attenuating superoxide dismutase to inflamed colons

Affiliations

Host lysozyme-mediated lysis of Lactococcus lactis facilitates delivery of colitis-attenuating superoxide dismutase to inflamed colons

Sonia A Ballal et al. Proc Natl Acad Sci U S A. .

Abstract

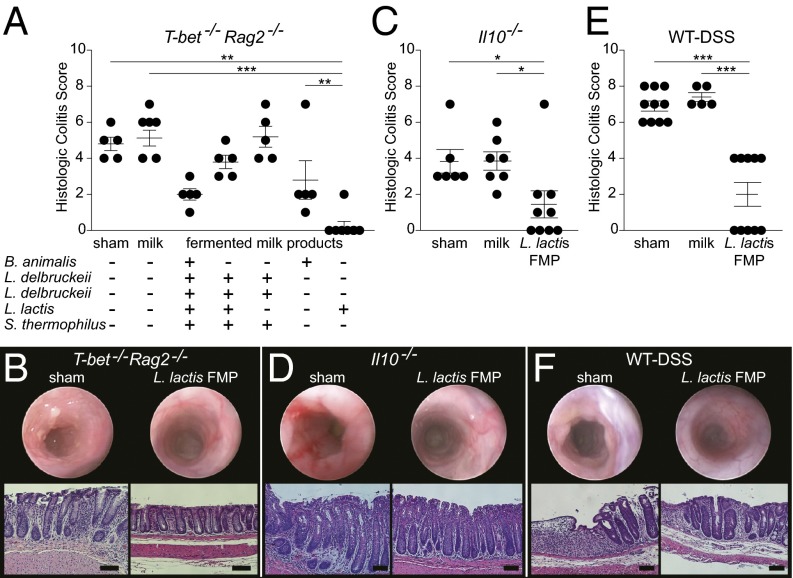
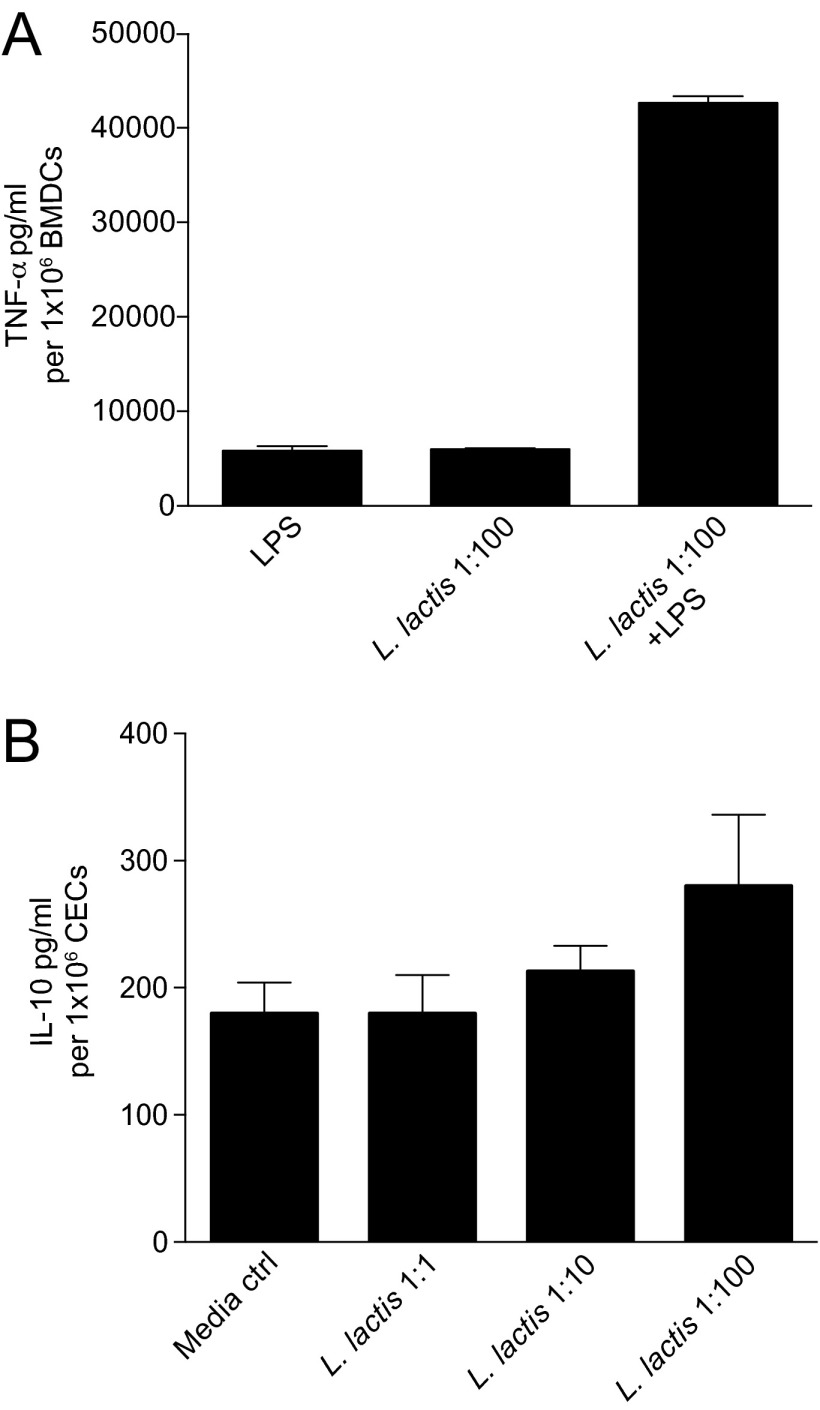
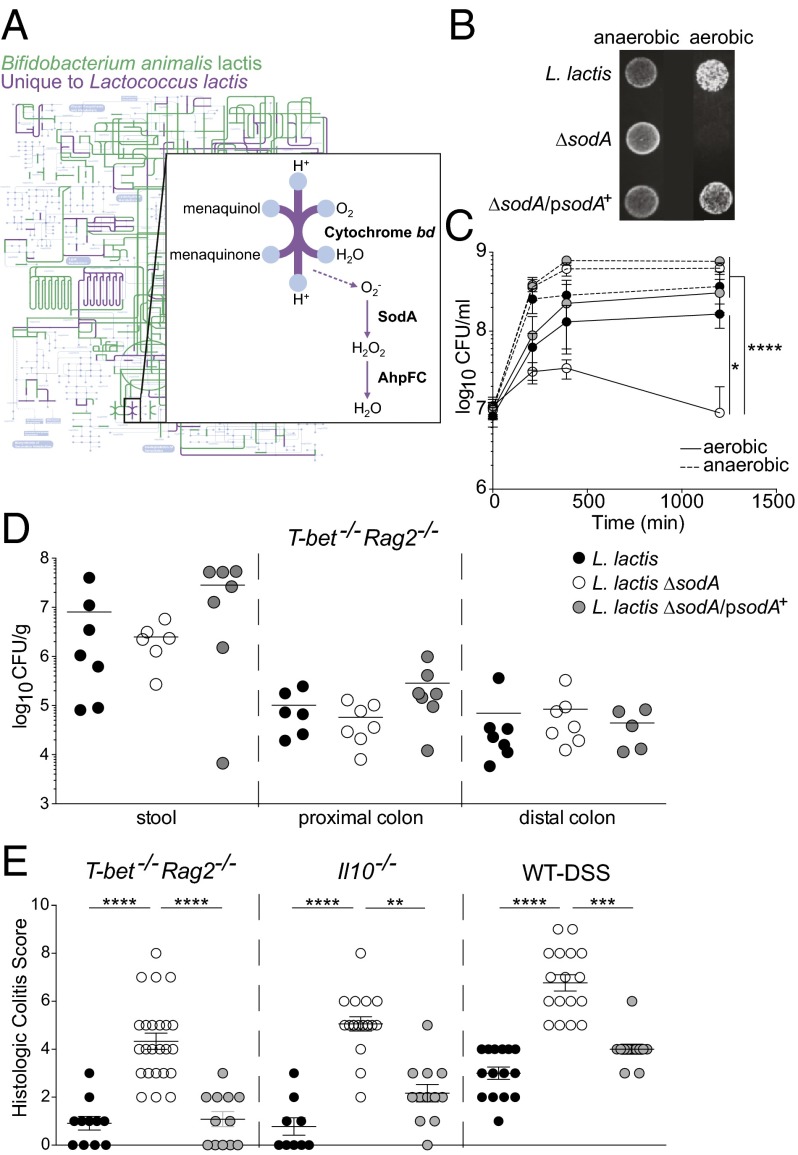
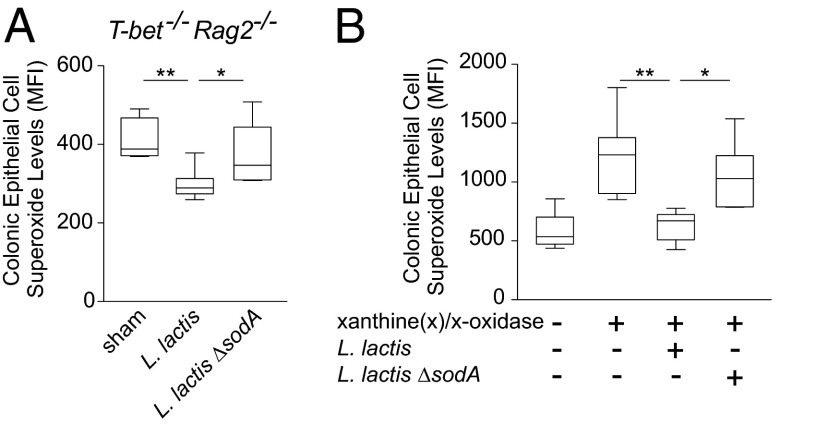
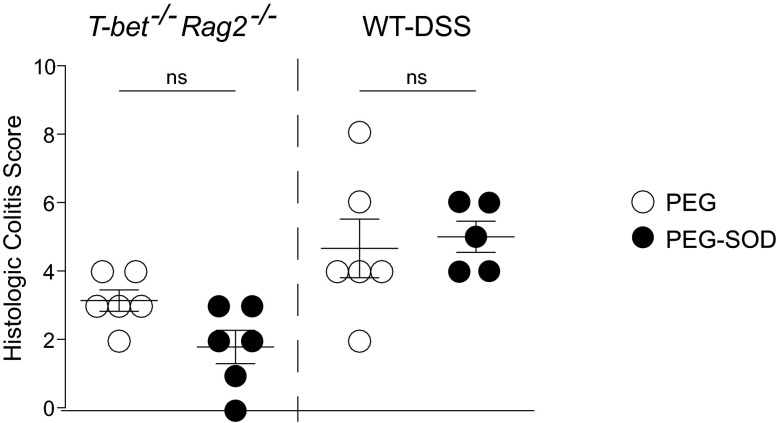
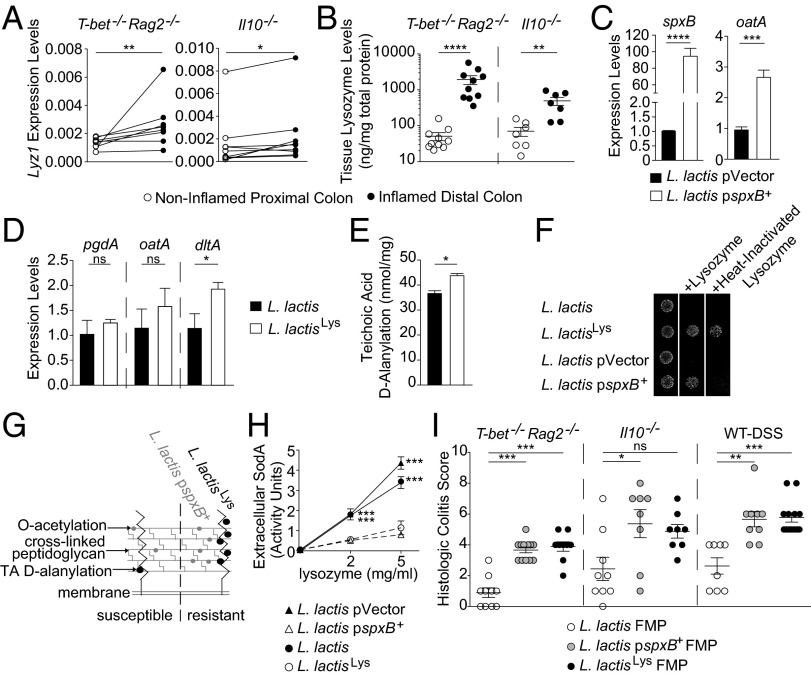
Beneficial microbes that target molecules and pathways, such as oxidative stress, which can negatively affect both host and microbiota, may hold promise as an inflammatory bowel disease therapy. Prior work showed that a five-strain fermented milk product (FMP) improved colitis in T-bet(-/-) Rag2(-/-) mice. By varying the number of strains used in the FMP, we found that Lactococcus lactis I-1631 was sufficient to ameliorate colitis. Using comparative genomic analyses, we identified genes unique to L. lactis I-1631 involved in oxygen respiration. Respiration of oxygen results in reactive oxygen species (ROS) generation. Also, ROS are produced at high levels during intestinal inflammation and cause tissue damage. L. lactis I-1631 possesses genes encoding enzymes that detoxify ROS, such as superoxide dismutase (SodA). Thus, we hypothesized that lactococcal SodA played a role in attenuating colitis. Inactivation of the sodA gene abolished L. lactis I-1631's beneficial effect in the T-bet(-/-) Rag2(-/-) model. Similar effects were obtained in two additional colonic inflammation models, Il10(-/-) mice and dextran sulfate sodium-treated mice. Efforts to understand how a lipophobic superoxide anion (O2 (-)) can be detoxified by cytoplasmic lactoccocal SodA led to the finding that host antimicrobial-mediated lysis is a prerequisite for SodA release and SodA's extracytoplasmic O2 (-) scavenging. L. lactis I-1631 may represent a promising vehicle to deliver antioxidant, colitis-attenuating SodA to the inflamed intestinal mucosa, and host antimicrobials may play a critical role in mediating SodA's bioaccessibility.

Keywords: Lactococcus lactis; colitis; lysozyme; oxidative stress; probiotics.


Conflict of interest statement

Conflict of interest statement: P.V., G.Q., P.G., C.B., M.D., and J.v.H.V. are employees of and hold equity in Danone Nutricia Research. This study was supported by a grant from Danone Nutricia Research, R01CA154426 (National Cancer Institute), K08AI078942 (National Institute of Allergy and Infectious Diseases), a Burroughs Wellcome Career in Medical Sciences Award, and a Searle Scholars Award.

Figures

Fig. 1.
Fig. 1.
L. lactis FMP attenuates colitis in T-bet−/− Rag2−/−, Il10−/−, and DSS-treated BALB/c wild-type mice. (A) Histologic colitis scores from T-bet−/− Rag2−/− mice treated as labeled. Symbols represent data from individual mice from three experiments. (B) Endoscopic distal colon images (Upper) and H&E section photomicrographs from distal colons (Lower) of T-bet−/− Rag2−/− mice treated as labeled. (C) Histologic colitis scores from Il10−/− mice, treated as labeled. Symbols represent data from individual mice from three experiments. (D) Endoscopic distal colon images and H&E section photomicrographs from distal colons of Il10−/− mice treated as labeled. (E) Histologic colitis scores from DSS-exposed mice treated as labeled. Symbols represent data from individual mice from three experiments. (F) Endoscopic distal colon images and H&E section photomicrographs from distal colons of DSS-treated wild-type mice treated as labeled. Error bars indicate mean ± SEM; Kruskal–Wallis test with post hoc Dunn’s comparison test. *P < 0.05, **P < 0.01, and ***P < 0.001. (Scale bars, 100 μm.)
Fig. S1.
Fig. S1.
L. lactis I-1631 does not exhibit typical activities of beneficial microbes. (A) TNF-α levels in isolated mouse bone marrow-derived dendritic cells treated with LPS and/or cocultured with L. lactis I-1631 at a ratio of 1:100 bacterial to dendritic cells. Bars represent mean ± SEM of three independent experiments. (B) IL-10 levels in isolated mouse primary colonic epithelial cells cocultured with L. lactis I-1631 at various ratios of bacterial to epithelial cells. Bars represent mean ± SEM of three independent experiments.
Fig. 2.
Fig. 2.
L. lactis I-1631 ameliorates colitis in a SodA-dependent manner. (A) iPath projection of KEGG metabolic pathways for predicted functions of B. animalis I-2494 (green) and predicted functions present in L. lactis I-1631 and absent from B. animalis I-2494 (purple). The KEGG global map (gray) is in the background layer. (Inset) Details and adaptation of the oxidative phosphorylation pathway present in L. lactis I-1631 and absent from B. animalis I-2494, with superoxide generation indicated by the dashed arrow. (B) Photograph of L. lactis I-1631, the ΔsodA mutant, and the ΔsodA/psodA+ strain grown on plates under anaerobic and aerobic conditions. (C) Growth curves of L. lactis I-1631, the ΔsodA mutant, and the ΔsodA/psodA+ strain grown in milk under anaerobic and aerobic conditions. Data represent mean ± SD; two-way ANOVA with post hoc Bonferroni’s multiple comparison test (MCT). (D) L. lactis I-1631, ΔsodA mutant, and ΔsodA/psodA+ strain enumerations in the stool and large intestine of T-bet−/− Rag2−/− mice. Symbols represent data from individual mice. (E) Histologic colitis scores from T-bet−/− Rag2−/−, Il10−/−, and DSS-exposed mice treated as labeled. Symbols represent data from individual mice from three experiments. Error bars indicate mean ± SEM; Kruskal–Wallis test with post hoc Dunn’s comparison test. *P < 0.05, **P < 0.01, ***P < 0.001, and ****P < 0.0001.
Fig. 3.
Fig. 3.
L. lactis I-1631 reduces primary CEC superoxide levels in vivo and in vitro. (A) Superoxide levels in CECs isolated from T-bet−/− Rag2−/− mice and stained with DHE. T-bet−/− Rag2−/− mice were treated as labeled. Box and whiskers plot; data reflect samples from four experiments; unpaired t test. (B) Superoxide levels in CECs isolated from wild-type mice and stained with DHE. Cells were stimulated with xanthine and xanthine oxidase or unstimulated. Additional treatment with L. lactis I-1631 or L. lactis ΔsodA culture lysates is as labeled. Box and whiskers plot; data reflect six experiments. One-way ANOVA with post hoc Bonferroni’s MCT. *P < 0.05 and **P < 0.01.
Fig. S2.
Fig. S2.
Delivery vehicle of SodA influences its effectiveness in reducing colitis. The graph shows histologic colitis scores (y axis) from T-bet−/− Rag2−/− mice and DSS-treated BALB/c wild-type mice that were fed PEG or PEG coupled to superoxide dismutase at a dose of 13 mg⋅kg−1⋅d−1. Symbols represent data from individual mice from three independent experiments. Error bars indicate mean ± SEM; Mann–Whitney test. ns, not significant.
Fig. 4.
Fig. 4.
Lysozyme-mediated lysis of L. lactis I-1631 is required for colitis attenuation. (A) Colonic tissue lyz1 expression levels from T-bet−/− Rag2−/− and Il10−/− mice. Wilcoxon matched-pairs test (T-bet−/− Rag2−/−; non-Gaussian data distribution); paired t test (Il10−/−). (B) Colonic tissue lysozyme-1 protein levels from T-bet−/− Rag2−/− and Il10−/− mice. Symbols represent data from individual mice from three experiments. Mean ± SEM; Mann–Whitney test. (C and D) mRNA expression levels of genes contributing to lactococcal lysozyme resistance. Mean ± SEM of three experiments; unpaired t test. (E) d-alanylation of teichoic acids in the lysozyme-resistant mutant L. lactisLys and its parent. Mean ± SEM of three experiments; unpaired t test. (F) Lysozyme-resistant L. lactis I-1631 mutants grown on media with lysozyme or heat-inactivated lysozyme. (G) Model of the lactococcal peptidoglycan layer with two lysozyme resistance mechanisms. (H) Extracellular SodA levels of strains grown in lysozyme. Mean ± SEM of three experiments; two-way ANOVA with post hoc Bonferroni’s MCT. (I) Histologic colitis scores from T-bet−/− Rag2−/−, Il10−/−, and DSS-exposed mice treated as labeled. Symbols represent data from individual mice from three experiments. Mean ± SEM; Kruskal–Wallis test with post hoc Dunn’s comparison test. *P < 0.05, **P < 0.01, ***P < 0.001, and ****P < 0.0001; ns, not significant.
Fig. S3.
Fig. S3.
Peptidoglycan structure analysis of L. lactis pspxB+. (A) Representative HPLC profile of muropeptides obtained by mutanolysin digestion of peptidoglycan extracted from L. lactis pspxB+. Red arrows indicate O-acetylated muropeptides. (B) Table listing O-acetylated muropeptides and their respective percent abundances in L. lactis pspxB+ and the plasmid vector control strain. Ac, acetylation; D, d-Asp; Disaccharide, GlcNAc-MurNAc; iGln, α-amidated isoGlu (or γGlu); N, d-Asn; Tetra, disaccharide tetrapeptide (l-Ala-d-iGln-l-Lys-d-Ala); Tri, disaccharide tripeptide (l-Ala-d-iGln-l-Lys). The total percentage of O-acetylated muropeptides was calculated as follows: percentage = Σ monomers (Ac) + 1/2 Σ dimers (Ac) + Σ dimers (2Ac) + 1/3 Σ trimers (Ac). Data represent mean ± SD of three independent culture and media preparations.
Fig. S4.
Fig. S4.
SodA levels in the lysozyme-resistant mutants. (A) Relative mRNA expression levels of sodA in lysozyme-resistant mutants. Bars represent mean ± SEM of three independent experiments. ***P < 0.001; unpaired t test. ns, not significant. (B) Intracellular SodA levels in lysozyme-resistant mutants. Bars represent mean ± SEM of three independent experiments; unpaired t test.
Fig. S5.
Fig. S5.
Peptidoglycan hydrolase activity of select and representative members of the gut microbiota. (Upper) Heat-inactivated M. luteus. (Lower) Heat-inactivated L. lactis. Overnight cultures from the strains listed above the panels were added on top of the agar, and clearing of the agar indicates lysis.
Fig. S6.
Fig. S6.
SOD genomic potential and expression in representative gut microbiomes. (A) Percentage of genomes containing SOD-associated clusters of orthologous groups. Data are grouped along the x axis by their phylogenetic assignment at the phylum level. In parentheses are the numbers of genomes examined per phylum. (B) Putative localization of predicted SOD proteins. Data are grouped along the x axis by phylum. In parentheses are the numbers of genes examined per phylum. (C) Bars depict the proportion of normalized read counts assignable to the annotation (legend) out of all read counts. Data represent RNAseq profiles of five mice colonized with a 20-member consortium across four time points. Counts were normalized to reads per kilobase gene length per million mapped reads. Bars represent mean number of normalized read counts ± SEM.

Comment in

References

    1. Uhlig HH, et al. 2014. The diagnostic approach to monogenic very early onset inflammatory bowel disease. Gastroenterology 147(5):990–1007.e3.
    1. Packey CD, Sartor RB. Interplay of commensal and pathogenic bacteria, genetic mutations, and immunoregulatory defects in the pathogenesis of inflammatory bowel diseases. J Intern Med. 2008;263(6):597–606. - PubMed
    1. Neish AS. Redox signaling mediated by the gut microbiota. Free Radic Res. 2013;47(11):950–957. - PMC - PubMed
    1. Christman JW, Blackwell TS, Juurlink BH. Redox regulation of nuclear factor kappa B: Therapeutic potential for attenuating inflammatory responses. Brain Pathol. 2000;10(1):153–162. - PMC - PubMed
    1. Maloy KJ, Powrie F. Intestinal homeostasis and its breakdown in inflammatory bowel disease. Nature. 2011;474(7351):298–306. - PubMed

Publication types