. 2015 Jun 23;112(25):7731-6.
doi: 10.1073/pnas.1424272112. Epub 2015 Jun 8.

Inference of transcriptional regulation in cancers

Affiliations

Inference of transcriptional regulation in cancers

Peng Jiang et al. Proc Natl Acad Sci U S A. .

Abstract

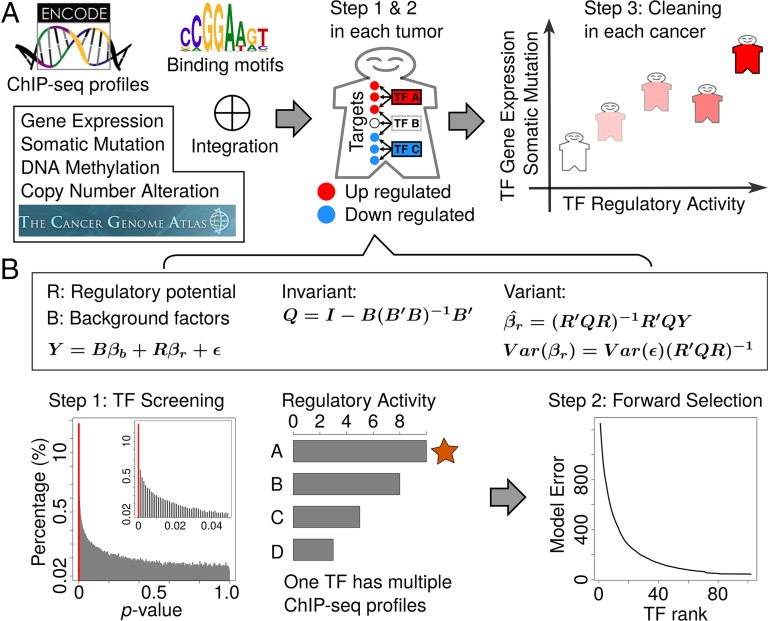
Despite the rapid accumulation of tumor-profiling data and transcription factor (TF) ChIP-seq profiles, efforts integrating TF binding with the tumor-profiling data to understand how TFs regulate tumor gene expression are still limited. To systematically search for cancer-associated TFs, we comprehensively integrated 686 ENCODE ChIP-seq profiles representing 150 TFs with 7484 TCGA tumor data in 18 cancer types. For efficient and accurate inference on gene regulatory rules across a large number and variety of datasets, we developed an algorithm, RABIT (regression analysis with background integration). In each tumor sample, RABIT tests whether the TF target genes from ChIP-seq show strong differential regulation after controlling for background effect from copy number alteration and DNA methylation. When multiple ChIP-seq profiles are available for a TF, RABIT prioritizes the most relevant ChIP-seq profile in each tumor. In each cancer type, RABIT further tests whether the TF expression and somatic mutation variations are correlated with differential expression patterns of its target genes across tumors. Our predicted TF impact on tumor gene expression is highly consistent with the knowledge from cancer-related gene databases and reveals many previously unidentified aspects of transcriptional regulation in tumor progression. We also applied RABIT on RNA-binding protein motifs and found that some alternative splicing factors could affect tumor-specific gene expression by binding to target gene 3'UTR regions. Thus, RABIT (rabit.dfci.harvard.edu) is a general platform for predicting the oncogenic role of gene expression regulators.

Keywords: RNA-binding protein; regulatory inference; transcription factor; tumor profiling.


Conflict of interest statement

The authors declare no conflict of interest.

Figures

Fig. 1.
Fig. 1.
Search transcription factors driving tumor-specific gene expression patterns. (A) The input to RABIT framework includes TF ChIP-seq profiles, recognition motifs, and tumor-profiling datasets. RABIT uses three steps to identify TFs that drive tumor-specific gene expression patterns at both the individual tumor level and the whole cancer-type level. In steps 1 and 2, for each tumor sample, RABIT tests whether the TF target genes are significantly up-regulated or down-regulated compared with the normal controls. In step 3, for each cancer type, RABIT tests whether the TF gene expression and somatic mutation are correlated with the scores of TF regulatory activity on target genes across all tumors and cleans up TFs with poor correlation. (B) In step 1, the efficient Frisch–Waugh–Lovell method of linear regression is applied to test the impact of TFs on target gene regulation after controlling for background factors. A set of TFs with significant regulatory activity is screened. If one TF has several ChIP-seq profiles from different conditions, RABIT only keeps the profile that gives the largest statistical effect of regulatory activity on target genes. In step 2, RABIT further selects a subset of TFs among those screened in step 1 by stepwise forward selection to achieve an optimized model error.
Fig. 2.
Fig. 2.
The landscape of transcriptional regulation in cancer. RABIT calculates the percentage of tumors with TF targets differentially regulated in each cancer type. The upper red triangle represents the percentage of tumors with target genes up-regulated, and the lower blue triangle represents the percentage down-regulated. Only TFs with targets differentially regulated in greater than 50% of tumors in more than two cancer types are shown. The cancer name is displayed by TCGA abbreviation with the platform used for gene expression profiling.
Fig. 3.
Fig. 3.
Reliable performance of RABIT framework. (A) All TFs are classified into three categories by NCI cancer index. The category “Zero” includes all TFs with zero index value. We then ranked the rest of the TFs by their NCI cancer indices and assigned the top half to the “High” category and the lower half to the “Low” category. For each category, we plotted the percentage of tumors with target genes differentially regulated and averaged across all cancer types. The bottom and top of the boxes are the 25th and 75th percentiles (interquartile range). Whiskers on the top and bottom represent the maximum and minimum data points within the range represented by 1.5 times the interquartile range. The P value is computed by the Spearman’s rank correlation test. (B) As the gold standard of cancer-associated TFs, we took TFs annotated as cancer-related in at least two out of four cancer gene databases (NCI Cancer Index, Bushman, COSMIC, and CCGD). The performance of identifying cancer-related TFs is compared among several methods, and the areas under the ROC curve of each method are plotted. (C) For cell lines K562 and HL60, there are gene expression-profiling data profiled by ENCODE and genome-wide CRISPR-screening data available from previous studies. We applied RABIT to infer the TF regulatory impact in shaping the expression patterns in each cell line. The Spearman’s rank correlations between the TF regulatory activity scores and the CRISPR-screening scores are calculated, and the P values of the correlation test are attached after each correlation ratio. The result is shown for the K562 cell. (D) The CRISPR correlation result is shown for the HL60 cell.
Fig. 4.
Fig. 4.
The landscape of posttranscriptional regulation in cancer. (A) As an example of RNA-binding protein (RBP) motif clusters, there are five motifs with similar binding preference of GCAUG. We grouped them together as cluster 9. (B) The percentage of tumors with RBP motif target genes differentially regulated is shown for each cancer type in the same way as Fig. 2. Each RBP motif cluster is labeled with the consensus sequence of centroid motif averaged among all members, followed with RBP name or cluster index if there are multiple members. Besides the TCGA data result, we also included METABRIC breast tumor data and Rembrandt and Gravendeel glioma data results for comparison. (C) The GBM patients are ordered by the levels of target down-regulation of motif cluster 9. The top half of patients are classified as “High,” and the bottom half are classified as “Low.” The overall survival days are plotted by a Kaplan–Meier curve, and the P value is estimated by the Weibull model, with age and sex as background factors.

References

    1. Hanahan D, Weinberg RA. Hallmarks of cancer: The next generation. Cell. 2011;144(5):646–674. - PubMed
    1. Ell B, Kang Y. Transcriptional control of cancer metastasis. Trends Cell Biol. 2013;23(12):603–611. - PMC - PubMed
    1. Lee TI, Young RA. Transcriptional regulation and its misregulation in disease. Cell. 2013;152(6):1237–1251. - PMC - PubMed
    1. Chen HZ, Tsai SY, Leone G. Emerging roles of E2Fs in cancer: An exit from cell cycle control. Nat Rev Cancer. 2009;9(11):785–797. - PMC - PubMed
    1. Halasi M, Gartel AL. Targeting FOXM1 in cancer. Biochem Pharmacol. 2013;85(5):644–652. - PubMed

Publication types