. 2015 Jul 7;112(27):8373-8.
doi: 10.1073/pnas.1504971112. Epub 2015 Jun 8.

Pre-TCR ligand binding impacts thymocyte development before αβTCR expression

Affiliations

Pre-TCR ligand binding impacts thymocyte development before αβTCR expression

Robert J Mallis et al. Proc Natl Acad Sci U S A. .

Abstract

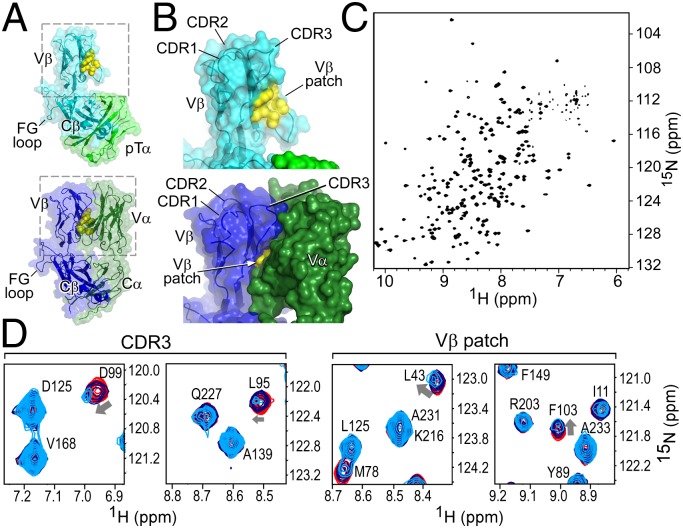
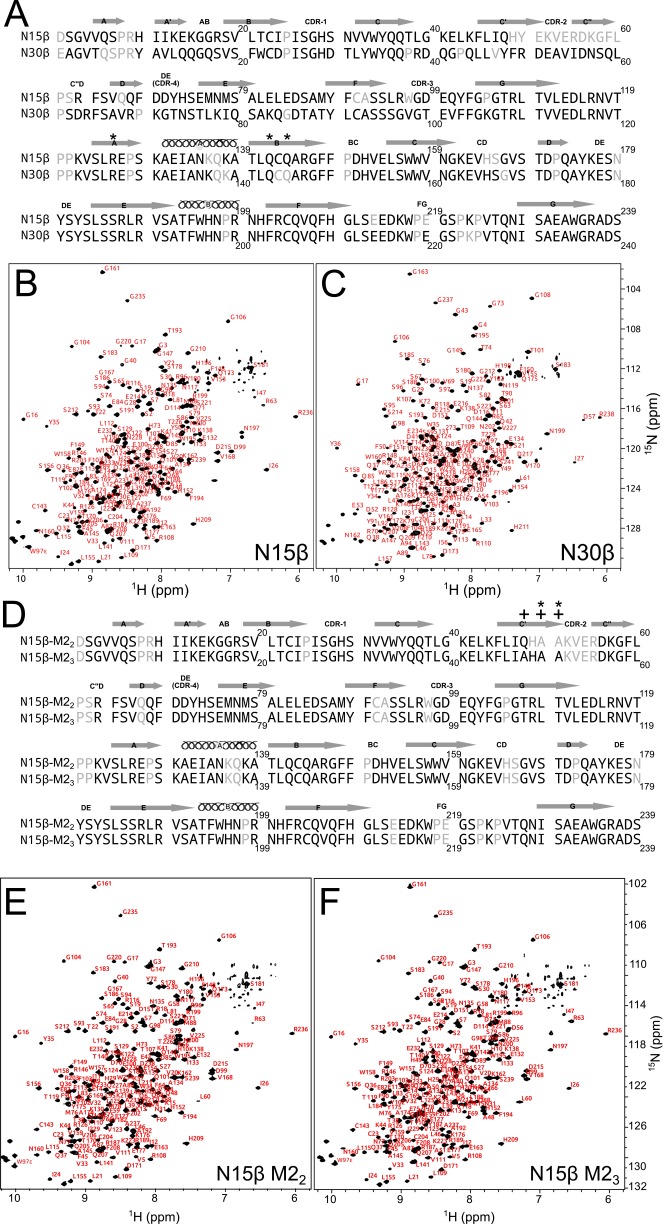
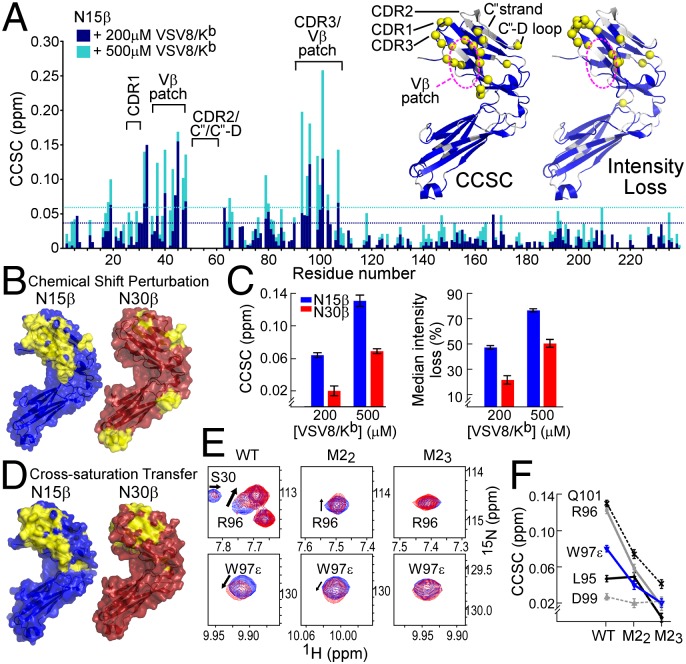
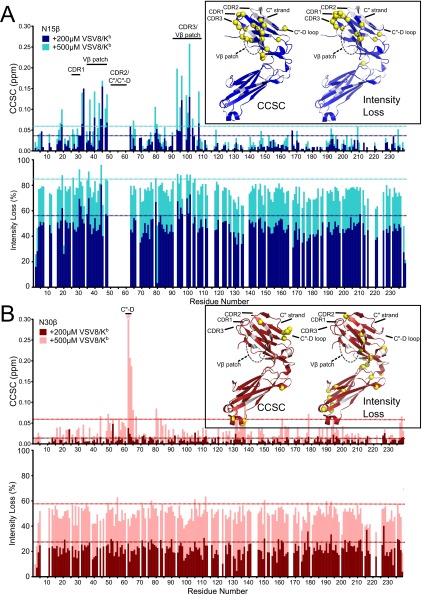
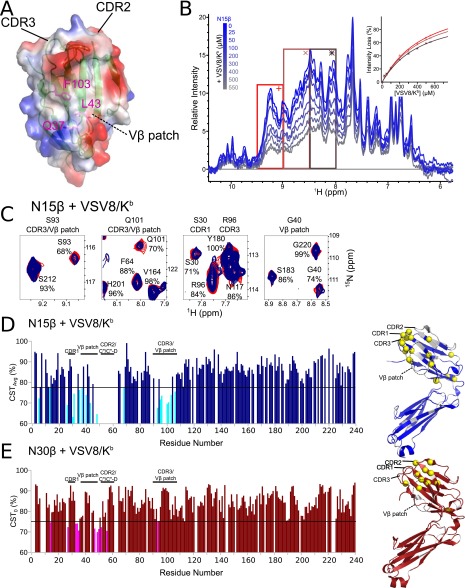
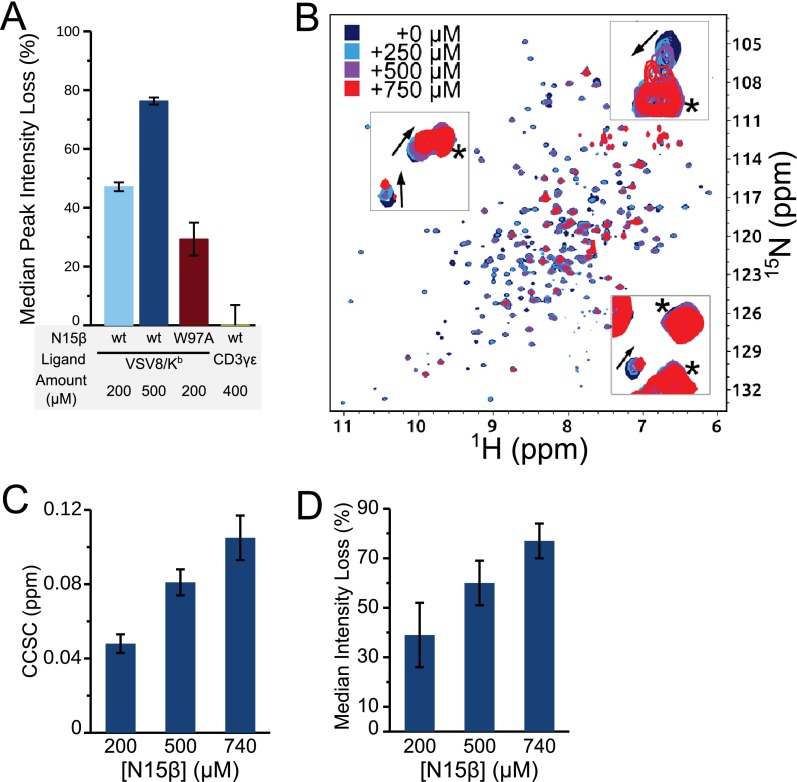
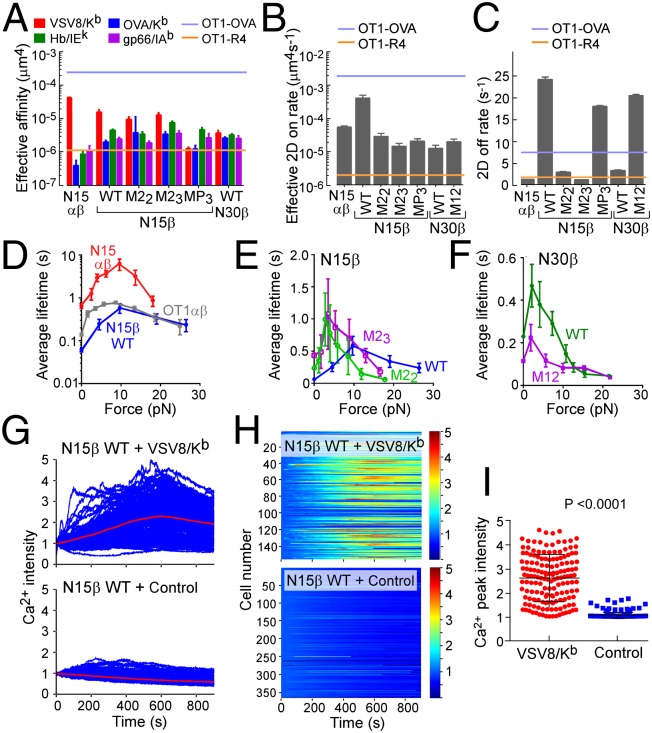
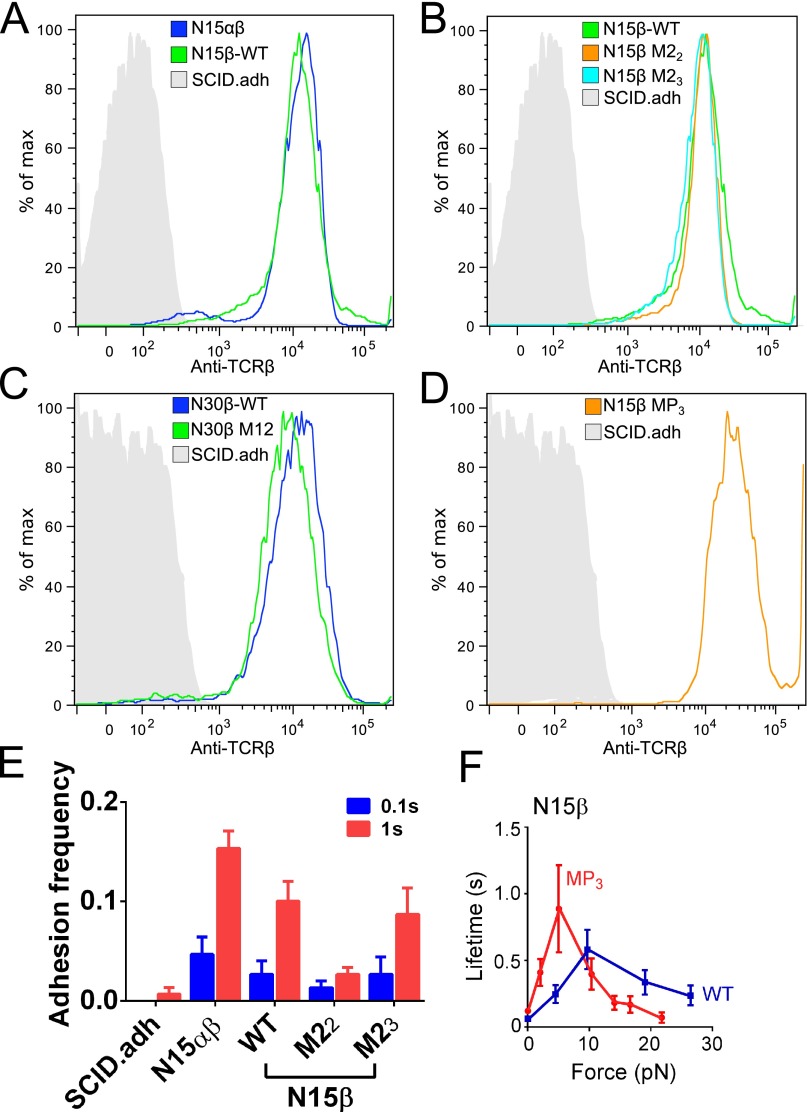
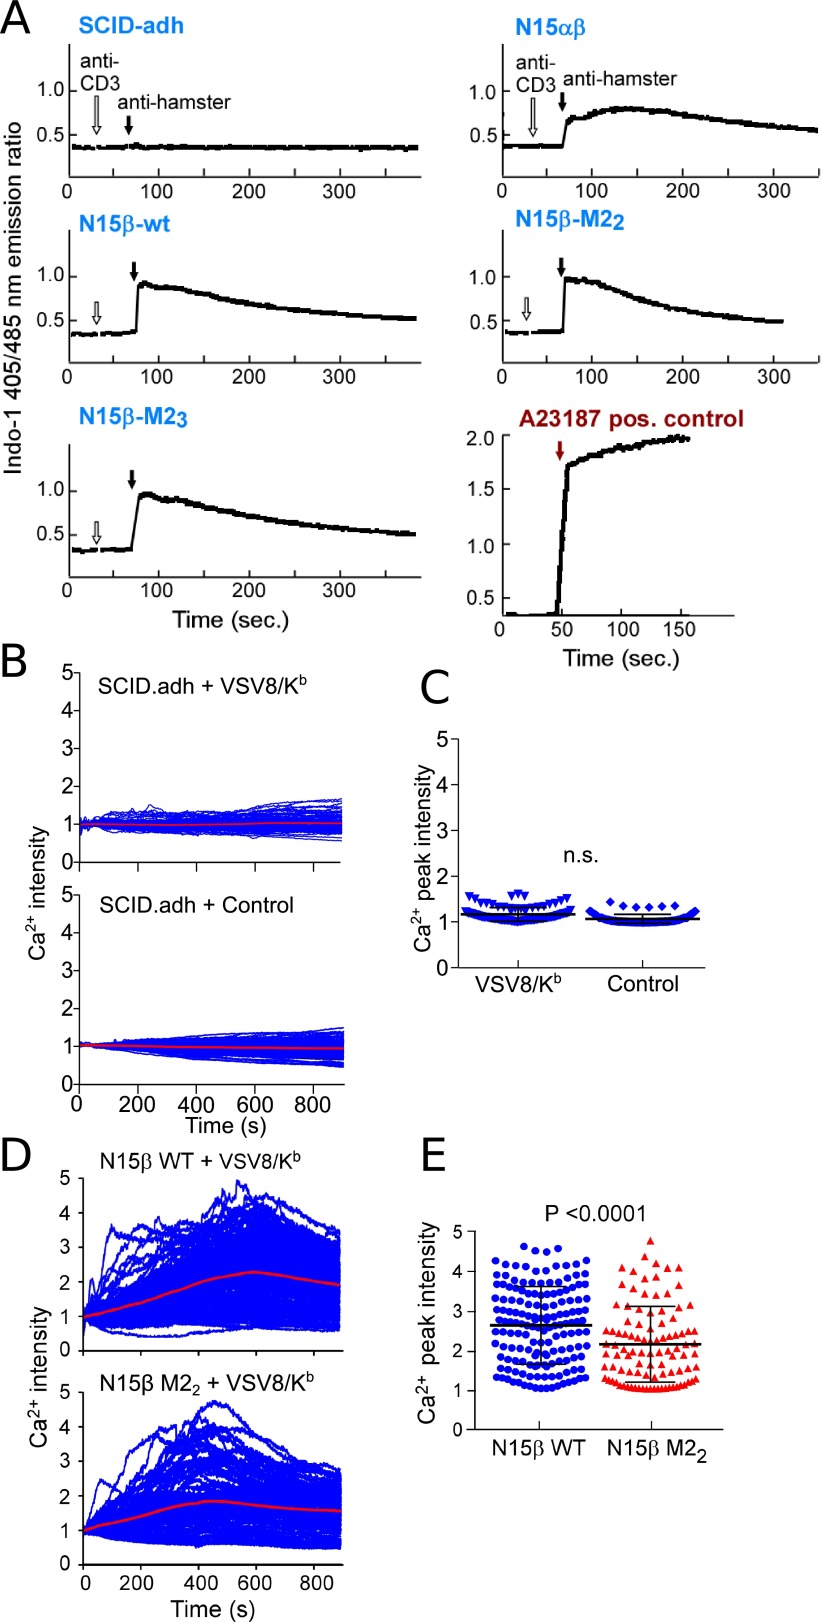
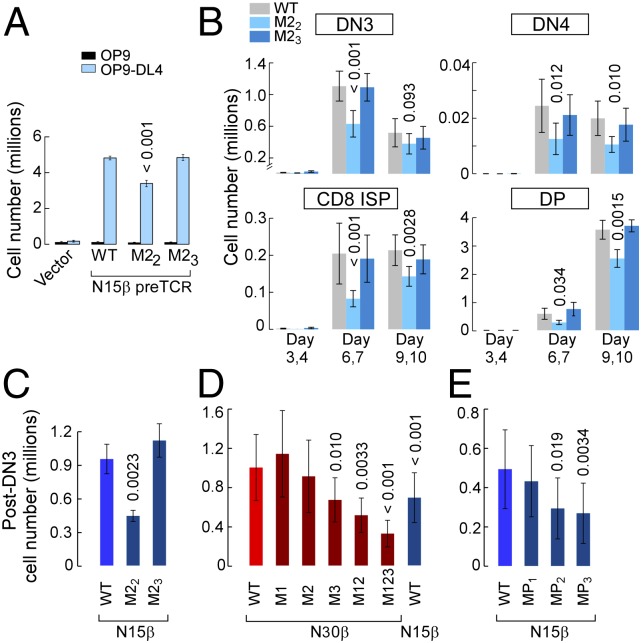
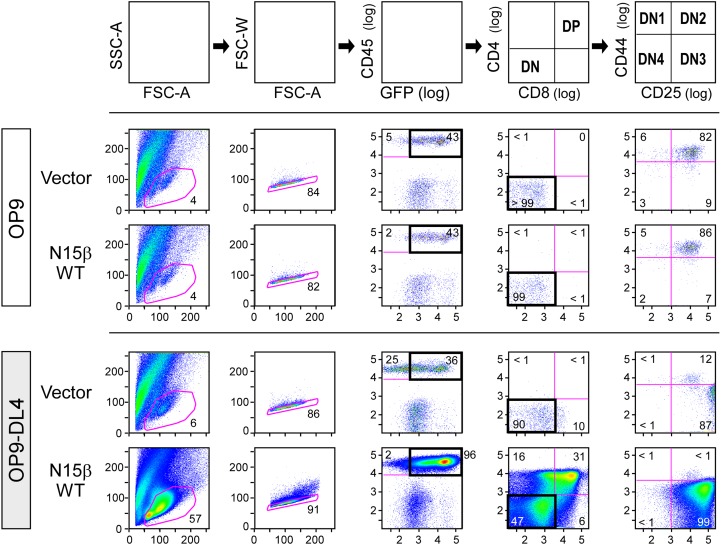
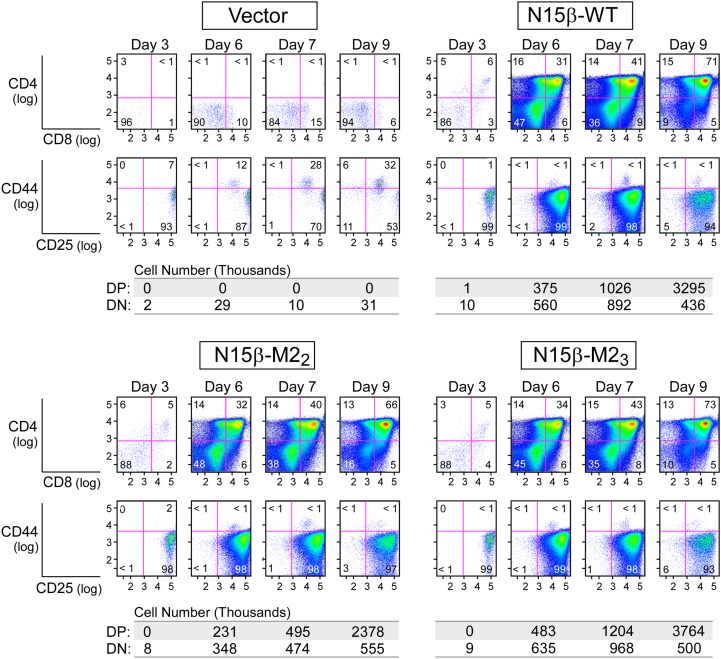
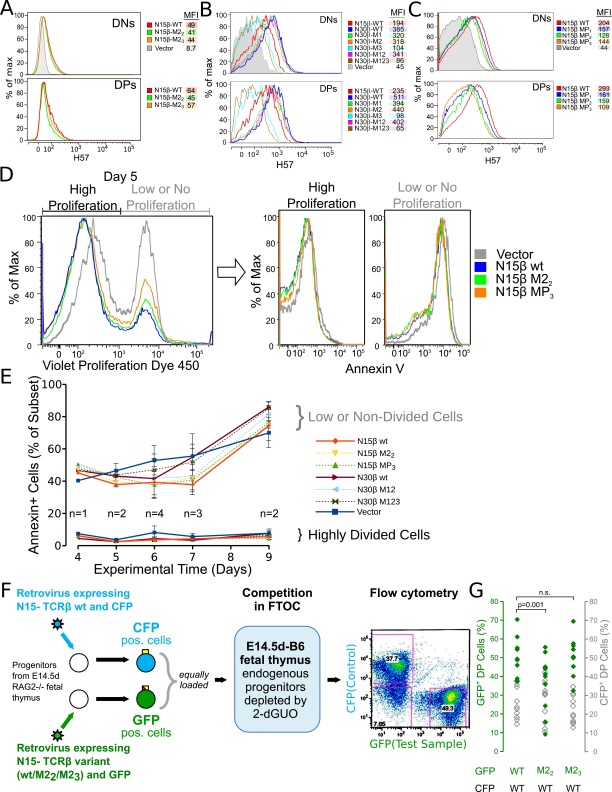
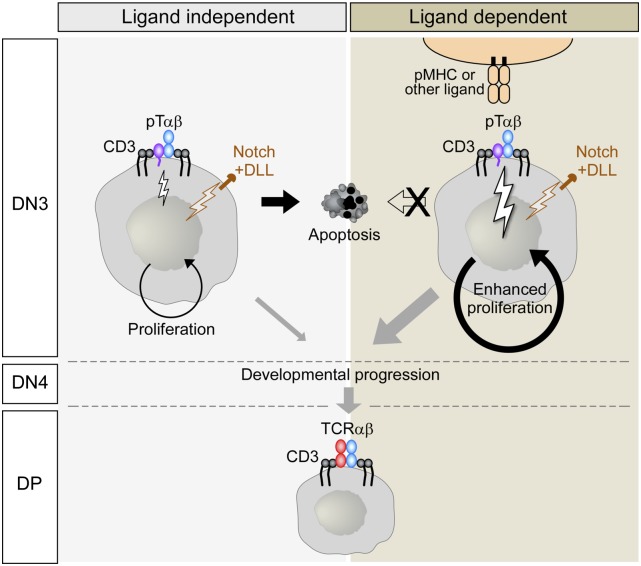
Adaptive cellular immunity requires accurate self- vs. nonself-discrimination to protect against infections and tumorous transformations while at the same time excluding autoimmunity. This vital capability is programmed in the thymus through selection of αβT-cell receptors (αβTCRs) recognizing peptides bound to MHC molecules (pMHC). Here, we show that the pre-TCR (preTCR), a pTα-β heterodimer appearing before αβTCR expression, directs a previously unappreciated initial phase of repertoire selection. Contrasting with the ligand-independent model of preTCR function, we reveal through NMR and bioforce-probe analyses that the β-subunit binds pMHC using Vβ complementarity-determining regions as well as an exposed hydrophobic Vβ patch characteristic of the preTCR. Force-regulated single bonds akin to those of αβTCRs but with more promiscuous ligand specificity trigger calcium flux. Thus, thymic development involves sequential β- and then, αβ-repertoire tuning, whereby preTCR interactions with self pMHC modulate early thymocyte expansion, with implications for β-selection, immunodominant peptide recognition, and germ line-encoded MHC interaction.

Keywords: NMR spectroscopy; biomembrane force probe; pre–T-cell receptor; repertoire selection; thymic development.


Conflict of interest statement

The authors declare no conflict of interest.

Figures

Fig. 1.
Fig. 1.
The structure of the β-subunit when incorporated into pTαβ or TCRαβ heterodimers suggests that the preTCR has ligand binding properties. (A and B) Structures of the (Upper) pTα/LC13β preTCR [Protein Data Bank (PDB) ID code 3OF6] and (Lower) N15αβTCR (PDB ID code 1NFD) heterodimers. (A) The overall fold of β remains consistent within pTαβ compared with within TCRαβ. (B) Highlight of Vβ domain and CDR loops within pTαβ and αβTCR. The hydrophobic Vβ patch, which is exposed in pTαβ but not in TCRαβ, is shown in yellow. (C) TROSY-HSQC spectrum of N15β (with backbone residue assignments overlaid in Fig. S1B) showing spectral dispersion consistent with the β sheet-rich fold of the β-subunit. (D) Select regions of overlaid TROSY-HSQC spectra of 200 μM 1H-15N N15β alone (red) and with the addition of 200 (blue) or 500 μM (cyan) unlabeled VSV8/Kb. Chemical shift changes are highlighted for residues D99 and L95 of CDR3 and L43 and F103 of the Vβ patch. Note the lack of changes in C-domain residues, for example, D125, A139, V168 or A233.
Fig. S1.
Fig. S1.
β-Sequences with secondary structure and NMR assignments annotated. (A) N15β and N30β sequences are shown with secondary structure assignments taken from Zhou et al. (14). Assigned residues are in black, and unassigned residues are gray; 201 of 226 possible (i.e., non-Proline and non-N terminus) residues (89%) were assigned for N15β, whereas 212 of 225 (94%) were assigned for N30β. *Cβ hydrophobic residues mutated for specificity (F126R/V142Q/L144Q; N15β numbering). (B and C) 1H-15N transverse relaxation optimized spectroscopy (TROSY)-heteronuclear single quantum coherence (HSQC) spectrum of (B) N15β and (C) N30β with backbone residue assignments overlaid shows spectral dispersion and completeness of assigned spectra. (D) N15β M22 and M23 sequences are shown with secondary structure assignments as in A; 205 of 226 possible residues (91%) were assigned for N15β-M22, whereas 208 of 226 (92%) were assigned for N15β-M23. *Mutated residues within M22. +Mutated residues within M23. (E and F) 1H-15N TROSY-HSQC spectrum of (E) N15β M22 and (F) M23 with backbone residue assignments overlaid shows that the essential structure of β is undisturbed (compare with each other and N15β WT in B).
Fig. 2.
Fig. 2.
β-Interaction with pMHC in solution as characterized by NMR. (A) The 2D 1H-15N HSQC spectra of 15N-N15β were acquired alone or with 200 (dark blue bars) or 500 μM (light blue bars) VSV8/Kb. Combined 1H and 15N chemical shift change (CCSC) was calculated for each residue. Dotted lines, which are color-coded like bars, indicate 1 SD above median CCSC. Inset is the ribbon representation [Protein Data Bank (PDB) ID code 3Q5Y] of (Left) CCSC analysis or (Right) intensity loss (detailed in Fig. S2A) of VSV8/Kb interaction with N15β. Amide protons exhibiting (Left) significant CCSCs or (Right) intensity losses are shown in yellow spheres in Inset. Regions corresponding to unassigned residues are white. (B) Solvent accessible surface representations of (Left) N15β (PDB ID code 3Q5Y) and (Right) N30β (PDB ID code 3Q5T) ectodomains with significant CCSCs colored yellow on surfaces within 6 Å of measured HN; β- and VSV8/Kb concentrations were 200 μM. Similar results were obtained at 500 μM ligand (Fig. S2). β Is shown rotated ∼120° about the y axis relative to Fig. 1 A and B. (C) Comparison of N15β and N30β interaction with VSV8/Kb. (Left) The 95th percentile of CCSC on mixing 200 or 500 μM VSV8/Kb with 200 μM N15β or N30β. Error bars indicate SD of CCSC for peaks not affected by ligand addition. (Right) Median peak intensity losses of spectral peaks on addition of 200 or 500 μM VSV8/Kb to 200 μM N15β or N30β. Error bars indicate propagated error using noise levels within NMR spectra. (D) Cross-saturation analysis. Surface representations of (Left) N15β and (Right) N30β ectodomains, with surfaces within 6 Å of HN exhibiting significant cross-saturation losses (detailed in SI Materials and Methods) shown in yellow. Representative spectral data and details of interacting surfaces are in Fig. S3 CE. (E and F) Chemical shift perturbation of βCDR3 residues among N15β and CDR2 mutants. (E) Spectral regions of 1H-15N TROSY-HSQC showing R96 or W97ε within CDR3 in the presence (red) or absence (blue) of VSV8/Kb for N15β, M22, or M23. Arrows show directions of change in chemical shift; smaller changes are seen for the CDR2 mutants than for the WT. (F) CCSC of indicated CDR3 residues is less with VSV8/Kb addition for M22 or M23 CDR2 variants vs. the WT N15β. Near-complete backbone assignments for M22 and M23 are shown in Fig. S1 DF.
Fig. S2.
Fig. S2.
Chemical shift perturbation and peak intensity analysis of N15β– and N30β–VSV8/Kb interaction. The 2D 1H-15N HSQC spectra of (A) 15N-N15β or (B) 15N-N30β were acquired alone or with 200 (dark blue or red bars) or 500 μM (light blue or red bars) VSV8/Kb. (Upper) Chemical shift change (CCSC) was calculated for each residue. Dotted lines are color-coded like bars and indicate 1 SD above median CCSC. (Lower) Intensity loss is plotted relative to unligated β. Dotted lines indicate 1 SD above median intensity loss. (A) N15β shows significant changes on addition of VSV8/Kb. Highlighted are changes in CDR1, CDR3, and the Vβ patch regions, which are progressively larger with the addition of more VSV8/Kb. The CDR2, C″ strand, and C″D loop are unassigned. Inset shows ribbon representation of (Left) CCSC analysis or (Right) intensity loss of VSV8/Kb interaction with N15β. Amide protons exhibiting significant (Left) CCSCs or (Right) intensity losses are shown in yellow spheres. Regions corresponding to unassigned residues are white. CCSC data and structural representations in Inset are reproduced from Fig. 2A to aid comparison with N30β. (B) N30β shows nonspecific changes distributed throughout the molecule. Highlighted are C″D loop residues, which show anomalously large CCSCs for the 500 μM level of VSV8/Kb. This anomaly may be caused by a local ring current shift and does not seem to indicate a large binding surface, because very few residues are affected; also, intensity losses are distributed evenly throughout the molecule. *Residue S63, which has a CCSC = 0.44 ppm. The detail of the N30β–VSV8/Kb interaction is the same as in A.
Fig. S3.
Fig. S3.
Biophysical characterization of β-pMHC interaction. (A) Surface charge representation of the Vβ patch region showing apolarity (white) of this large central surface within the interaction domain of the preTCR. Residues targeted for mutagenesis are highlighted along with critical structural elements. (B) The 1D 1H-15N HSQC spectra of 15N-N15β were acquired in the presence of variable amounts of VSV8/Kb. Sections of spectra 0.5 ppm in width were integrated individually, and loss of intensity was calculated relative to the spectrum containing only N15β. Loss of intensity for each individual spectral region was then fit to obtain an equilibrium dissociation constant (Kd) using a monovalent ligand binding equation. Goodness of fit was determined by the SE of fit for the Kd, which was found to be acceptable (relative SE ≤ 15%) for the three boxed regions indicated from 8 to 9.5 ppm. Curve fits for these regions plotted individually are shown in Inset. Kd is reported as the average value determined here ± mean of the SE. (C–E) Detail of cross-saturation–defined β-pMHC interaction sites. (C) Spectral regions showing saturation effect for residues in CDR1, -2, and -3 and Vβ patch. Shown are data from the experiment using a 2-s saturation pulse for 200 μM N15β + 200 μM VSV8/Kb as detailed in SI Materials and Methods. The reference spectrum (red) is overlaid with the saturated spectrum (blue). Relative intensities are shown for each identified peak. (D) Plot of cross-saturation transfer averaged over five experiments (CSTAvg) as detailed in SI Materials and Methods. Residues falling in the top 10% are highlighted on the bar chart and using ribbon representation of N15β (Right) ectodomain. Amide protons exhibiting significant cross-saturation losses are shown as yellow spheres. Regions corresponding to unassigned residues are white. (E) Plot of time 0 cross-saturation transfer rate (CST0) determined from five experiments for N30β + VSV8/Kb as detailed in SI Materials and Methods. Top residues affected are highlighted in the bar chart as well as the ribbon representation in Right, similar to D above.
Fig. S4.
Fig. S4.
Specificity of N15β–VSV8/Kb interaction. (A) Median peak intensity loss on mixing 200 μM N15β W97A with 200 μM VSV8/Kb or 200 μM N15β WT with 400 μM scCD3γε (41). Chemical shift change (CCSC) data for 200 μM N15β WT with 200 and 500 μM VSV8/Kb from Fig. 2B are shown for comparison. (B–D) N15β WT addition to 15N-labeled VSV8/Kb. (B) 1H-15N TROSY-HSQC of VSV8/Kb alone (blue) with increasing levels of N15β WT added. Only the H-2Kb heavy subunit is 15N-labeled. Spectrum was acquired on aBruker 900-MHz Spectrometer with a cryoprobe. Loss of intensity accompanies binding. Insets indicate chemical shift changes, which are denoted by arrows. (*Peaks that do not shift. (C) Combined chemical shift change of the top 5% of changes with addition of N15β. (D) Median peak intensity losses with the addition of N15β. Error bars for C and D are the same as for Fig. 2B.
Fig. 3.
Fig. 3.
Biophysical characterization of pMHC binding to and signaling by cell surface preTCR. (A) Effective 2D affinity was calculated from adhesion frequencies of each of the indicated receptors with the cognate ligand VSV8/Kb, an unrelated peptide bound to the same allele of MHCI (OVA/Kb), or unrelated peptides bound to two MHCII alleles (gp66/I-Ab and Hb/I-Ek). Shown for reference are the 2D affinities for the OT1 αβTCR interaction with its cognate peptide ligand OVA/Kb or the weak Arg-substituted altered peptide ligand R4/Kb. (B and C) Effective (B) 2D on rates and (C) 2D off rates for preTCRs compared with N15αβ. Shown for reference are the 2D rates for the OT1 αβTCR interaction with OVA/Kb or the altered peptide ligand R4/Kb. (D–F) Average bond lifetime measures of cell surface N15β WT, N30β WT, N15β variant preTCRs, or N15αβTCR binding to VSV8/Kb as a function of force. (D) N15αβ vs. N15β WT. The lifetimes of OT1 αβTCR-OVA/Kb interaction are shown for comparison. (E) N15β WT vs. M22 and M23. (F) N30β WT vs. N30β M12. (G–I) Ca2+ triggering of preTCR-expressing cells by VSV8/Kb in a microfluidic cell trap chip. (G) Superposition of individual Ca2+ response traces for N15β WT on exposure to (Upper) VSV8/Kb or (Lower) BSA control-treated surfaces. (H) Heat map showing individual Ca2+ responses, which are indicated by the colorimetric scaling of relative fluorescence signal in arbitrary units for data shown in G. (I) Maximal Ca2+ intensities for individual cells from G and H. P value was determined using Student’s t test.
Fig. S5.
Fig. S5.
BFP characterization of surface-expressed TCRαβ or preTCR. (A–D) SCID.adh parental cell line lacking TCRα and -β was retrovirally transduced with either N15αβ or the indicated β and assayed by FACS using anti-TCR antibody H57. (A) N15αβ, N15β WT, and SCID.adh parental. (B) N15β WT, N15β M22, N15β M23, and SCID.adh. (C) N30β WT, N30β M12, and SCID.adh. (D) N15β MP3 and SCID.adh. (E) SCID.adh parental cell line lacking TCRα and -β showed no adhesion when probed with VSV8/Kb using 0.1- and 1-s contact times. (F) Force lifetime curves for N15β WT vs. MP3 show maximal lifetime at a lower force for MP3. WT data are from Fig. 3 D and E for comparison.
Fig. S6.
Fig. S6.
Calcium flux triggered by activation of preTCR. (A) SCID.adh cells were retrovirally transduced with N15 β-variants (WT, M22, and M23) only or N15-TCRα and -β and then sorted based on the surface staining of H57-597 antibody (against TCRβ) to match surface receptor expression. SCID.adh cells (TCR negative control) or sorted SCID.adh cells were loaded with Indo-1 (1 μg/mL). Calcium flux was recorded as follows: at 30 s, anti-CD3 (145-2c11; 5 μg/mL) was added (open arrows), and at 1 m, anti-hamster IgG (10 μg/mL) was added (closed arrows). Calcium flux is represented as the Indo-1 405/485-nm emission ratio. TCRαβ-positive 257–20-109 DP cells were used for calcium flux positive control and triggered using A23187 calcium ionophore (red arrow). (B) Individual calcium fluorescence measurement traces of untransduced SCID.adh cells loaded into multiwell microfluidics chambers coated with (Upper) VSV8/Kb or (Lower) BSA control protein. Measurements were completed at 37 °C. (C) Peak Ca2+ intensities for all measurements shown in B. Each dot represents the measurement of one cell. No significance of difference (n.s.) between VSV8/Kb or control surfaces as evaluated using Student's t test. (D) Individual calcium fluorescence measurement traces of N15β (Upper) WT- and (Lower) M22-transduced SCID.adh cells loaded into multiwell microfluidics chambers coated with VSV8/Kb. Measurements were completed at 37 °C. (E) Peak Ca2+ intensities for all measurements shown in D. Each dot represents the measurement of one cell. P value evaluated using Student's t test is shown.
Fig. 4.
Fig. 4.
PreTCRβ CDR or Vβ patch mutations modulate proliferation within DN3 and progression from DN3 to DP stages of β-transduced thymocytes in stromal cell systems. (A–C) Developmental effects of CDR2 mutagenesis on N15β-transduced thymocytes; 2,000 sorted DN3 B6 Rag2−/− thymocytes were cultured in the OP9-DL4 system for 9–10 d. Results are shown as averages ± SEMs (n = 4). (A) Total thymocyte numbers at the end of OP9 or OP9-DL4 cultures. (B) Thymocyte numbers in OP9-DL4 cultures at DN3, DN4, CD8 immature single positive (ISP), and DP developmental stages at days 3 and 4, days 6 and 7, or days 9 and 10. (C–E) Number of cells developed beyond DN3 at days 6 and 7 within OP9-DL4 cultures of N15β- or N30β-transduced B6 Rag2−/− thymocytes. Significance of difference with leftmost β-WT is shown above each bar. (C) Developed cells for N15β WT vs. CDR2 mutants. (D) N30β WT vs. CDR mutants and N15β WT (n = 7). (E) N15β WT vs. Vβ patch mutants (n = 7).
Fig. S7.
Fig. S7.
Gating strategy in the transduced thymocyte OP9-DL4 stromal cell culture system. N15β WT or vector-only transduced thymocytes were cultured with OP9 parental or OP9-DL4 stromal cells. Day 6 of culture is shown. Gating strategy is shown at the top, and numbers represent percentages in designated quadrants or circumscribed regions of the dot plots.
Fig. S8.
Fig. S8.
Time dependence in the transduced thymocyte OP9-DL4 stromal cell culture system. N15β WT, M22, or M23 or vector only transduced thymocytes were cultured with OP9-DL4 stromal cells and analyzed for DN to DP transition (CD4/CD8; row 1) as well as progression within DN (CD44/CD25; row 2). Absolute numbers of cells at each kinetic point in culture are given below each set of FACS plots.
Fig. S9.
Fig. S9.
Characterization of transduced thymocytes in stromal cell culture systems. (A) β-Transduced thymocytes were cultured with OP9-DL4 stromal cells and analyzed for preTCR expression using anti-Cβ mAb H-57 compared with vector-only transduced controls. Levels are quantitated using mean fluorescent intensities (MFIs). Levels in DN and DP stages after 6–7 d in culture are shown. Vector data are not available for DP, because vector-transduced thymocytes do not develop beyond DN3. (A) N15β WT, M22, or M23 or vector-transduced thymocytes. (B) N30β WT vs. N30β mutants, N15β WT, or vector. (C) N15β WT vs. β-patch mutants or vector. (D and E) AnnexinV levels are inversely correlated with proliferation in OP9-DL4–cultured, β-transduced thymocytes without regard for identity of transductant. (F) Scheme for transduction of B6 Rag2−/− thymocytes with WT or mutant β within two-color FTOC. Flow cytometry panel shows gating of DP thymocytes before quantitating CFP+ (N15β WT; control) or GFP+ cells (N15β WT, M22, or M23; test), allowing for automatic correction for variability because of size or other thymic lobe differences in FTOC. (G) Proportion of GFP+ test β-transductants (WT or mutant; green symbols) and CFP+ control transductants (WT only; gray symbols) within the DP population of doubly transduced thymocytes (n = 11). Actual percentages are given. Note that fewer M22-transduced thymocytes (P = 0.001) after a 7-d FTOC become DP thymocytes relative to WT. In contrast, M23 was not found to be significantly different from WT (P > 0.1), and there were no CFP+ control samples found to differ between groups (P > 0.1). CFP-containing vector was less effective than GFP-containing vector at supporting β WT development in this system, so that a normalized ratio to WT of 0.702 ± 0.082 for M22 and 1.117 ± 0.073 for M23 was also calculated from the mutant GFP/WT CFP ratio divided by WT GFP/WT CFP, supporting the diminished developmental progression capacity of M22.
Fig. 5.
Fig. 5.
Model for early DN thymocyte selection through ligand-independent and -dependent processes. Interactions with thymic ligands occur in a background of DL-4–dependent Notch signaling as well as constitutive preTCR signaling. Nonetheless, signaling is enhanced through preTCR–ligand interactions, leading to greater proliferation in the DN3 stage. Apoptosis occurs predominantly in nondividing thymocytes. Note that the possibility of non-MHC ligands is indicated, because this has not been excluded experimentally.For simplicity, CD3ζ has been omitted. DLL, Delta-like ligand.

Comment in

References

    1. Prockop S, Petrie HT. Cell migration and the anatomic control of thymocyte precursor differentiation. Semin Immunol. 2000;12(5):435–444. - PubMed
    1. Shah DK, Zúñiga-Pflücker JC. An overview of the intrathymic intricacies of T cell development. J Immunol. 2014;192(9):4017–4023. - PubMed
    1. von Boehmer H. The thymus in immunity and in malignancy. Cancer Immunol Res. 2014;2(7):592–597. - PubMed
    1. Mathis D, Benoist C. Aire. Annu Rev Immunol. 2009;27:287–312. - PubMed
    1. Goldrath AW, Bevan MJ. Selecting and maintaining a diverse T-cell repertoire. Nature. 1999;402(6759):255–262. - PubMed

Publication types

MeSH terms

LinkOut - more resources